Event Probability Engine [Quantum Algo]
A live event database on your chart: eighteen observable conditions, each with its own rolling record of what price did next, shrunk toward neutral, corrected for overlap, bounded by Wilson intervals, conditioned on regime and pooled by quality into one honest probability — with a moon-phase control so you can watch the engine say "no edge".
The short answer
The Event Probability Engine is a free, open-source TradingView indicator that answers one question at the close of every bar: based on the measurable conditions active right now, what is the historical probability that price closes higher one, three and five days from today? Instead of subjective pattern reading, it builds and maintains a live rolling database of forward returns conditioned on eighteen observable events — day-of-week seasonality, oversold and overbought readings, volume spikes, streaks, range position, volatility regime, pivot touches and an optional lunar control — then pools the active events into a single composite probability, displayed as a TODAY headline, a full per-event statistics table and a shaded forecast cone on the chart. Designed for the daily timeframe; on others, the horizons become bars.
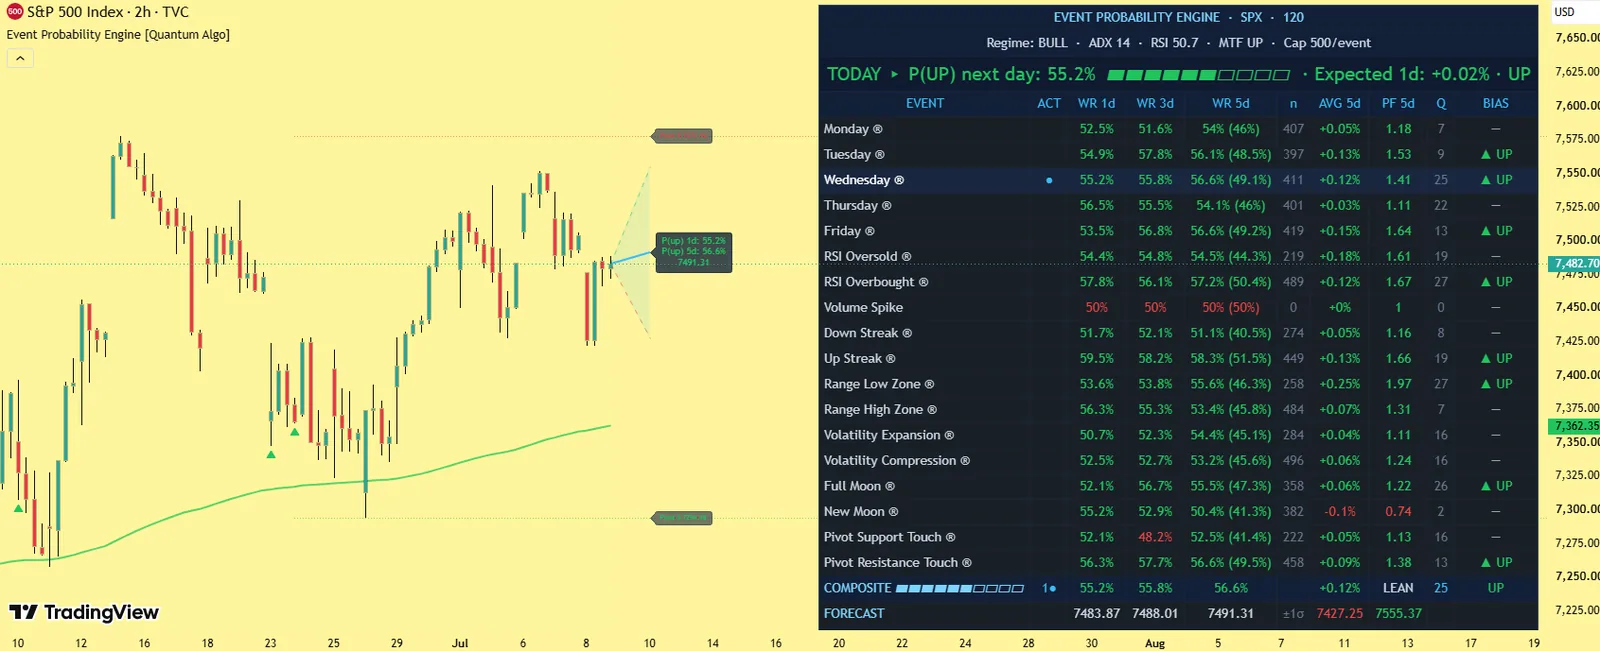
A TODAY headline, the full event statistics table, the composite row and a forward cone, plus regime tint, pivot rails and event markers on price.
Shrinkage, overlap correction, Wilson bounds and regime fallback, combined and pooled by quality-weighted log-odds, in Pine.
Statistics on closed bars; the dashboard and cone update live by design.
What an event study is
An event study measures what a market historically did after a defined, observable condition occurred — what happened over the next five days every time RSI closed oversold, or every Monday, or every time volume spiked two standard deviations above normal. The engine runs eighteen such studies continuously, in real time, on the chart's own data, with the statistical safeguards below. Our quantitative trading guide covers the method; this page is the tool.
What it draws
The TODAY headline
Next-day probability of an up close with a meter and the expected one-day return.
The statistics table
Every event with its shrinkage-adjusted win rate at each horizon, Wilson lower bound, sample count, average forward return, profit factor, a 0–100 quality score and the resulting bias; active rows highlighted; regime-matched rows marked ®.
The composite row
One, three and five-day probabilities with expected returns and a strength grade.
The forecast cone
A projected path with a ±1σ band drawn from the current close.
The chart layer
Optional regime tint, the regime line, live pivot support and resistance rails, and historical event markers on the candles.
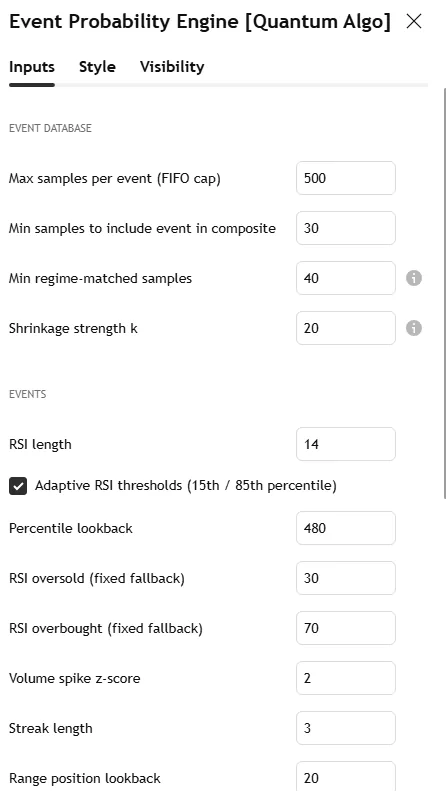
The S&P 500 2-hour screenshot on this page shows the table and the forecast cone; the settings screenshot shows the Inputs tab.
Why it is different
A live event database in Pine.
Eighteen rolling, capped samples of forward returns at three horizons, tagged with the regime at the moment each event fired — self-updating, not a fixed backtest.
Shrinkage estimation.
Every win rate pulled toward 50% by pseudo-samples; fifteen samples cannot display an extreme probability.
Overlap correction.
State-based events generate autocorrelated samples; the effective sample size is deflated by the horizon before any confidence calculation.
Wilson score bounds.
The number an event must clear before its edge deserves trust.
Regime conditioning with fallback.
Bull or bear by the 200 EMA; a bear-market Thursday is not assumed to behave like a bull-market Thursday.
Quality-weighted log-odds pooling.
One strong, well-sampled edge is not diluted by three weak ones.
A built-in falsification control.
Lunar phases included so the engine can show, empirically, which inputs carry no edge.
How it works
Event detection on every bar close — Monday through Friday, adaptive or fixed oversold/overbought thresholds, volume z-score spikes, up and down streaks, range-low and range-high position, volatility expansion and compression by percentile, confirmed pivot touches within an ATR distance, and the optional lunar events.
Database recording. Whenever an event was active one, three or five bars ago, the realised forward return is stored in that event's arrays, first-in-first-out at a cap, with the regime tag.
Per-event statistics as in the table above.
Composite probability. Active events passing the minimum-sample filter are pooled by quality-weighted log-odds into the headline, the composite row and the forecast cone.
Statistics recorded and evaluated on closed bars; the dashboard and forecast update on the live bar by design.
Settings
| Group | Input | What it does | Where to start |
|---|---|---|---|
| Database | Sample cap per event | Rolling window | 200 |
| Minimum samples for composite inclusion | Gate for pooling | 20 | |
| Minimum regime-matched samples | Gate for ® rows | 15 | |
| Shrinkage strength | Pseudo-samples toward 50% | 10 | |
| Events | Oscillator length and thresholds (fixed or adaptive percentile) | The oversold/overbought events | 14; adaptive |
| Volume z-score | The spike event | 2.0 | |
| Streak length | Up / down streak events | 3 | |
| Range lookback | Range-position events | 20 | |
| Pivot lookback and touch distance | Support/resistance events | 10; 0.5 ATR | |
| Lunar events | The control | on | |
| Statistics | Wilson z-score | The bound | 1.645 (90% one-sided) |
| Display | Dashboard position and five text sizes, forecast cone, regime tint, regime line, pivot rails, candle markers | Appearance | — |
Alerts
One named condition: Composite Bias Change — fires once per bar close whenever the five-day composite bias flips state, with the current one-day and five-day probabilities in the message.
How to use it
Apply it to a daily chart of any liquid symbol and let it load; sample counts grow with available bars.
Read the TODAY headline first — probability, meter, expected one-day return.
Scan the highlighted rows and judge each by its Wilson lower bound and quality score, not the raw win rate.
Use the composite row and cone as context. STRONG requires both a meaningful distance from 50% and high average quality.
Treat readings near 50% as weak evidence — the engine is built to display small honest numbers.
Combine with structure. The engine measures conditional history; it does not know tomorrow's news.
Three ways to trade it
The bias tilt.
A STRONG five-day composite in one direction, with the daily regime agreeing, tilts the swing bias; take structure entries from the Smart Money Concepts Engine in that direction only.
The event confluence.
An oversold event with a high quality score firing on the same day as a pivot-support touch and a Capitulation marker from the Market Bottom Finder — three independent reads of one low.
The size adjustment.
A composite near 50% is not a reason to trade smaller; it is a reason to rely entirely on structure and the Zeno signal — the engine has simply said the calendar and the conditions carry no edge today.
Recommended settings by market
Indices and large caps, daily
The design target: defaults; day-of-week events are meaningful.
Crypto, daily:
Disable day-of-week events if you trade weekends as sessions; regime by 200 EMA still applies.
Intraday (any):
Horizons become bars; day-of-week loses meaning; use the oscillator, volume, streak and pivot events only.
How it compares
Against seasonality scripts: those show averages; this shows shrunk, overlap-corrected, regime-conditioned probabilities with bounds and pools them by quality. Against the Volatility Storm Tracker: that projects the size of the move; this estimates the direction's historical odds — the pair is a complete statistical context. Against Zeno: Zeno prints the entry; the engine says whether the day's conditions have historically leaned the same way.
Limitations
Probabilities from historical conditioning are estimates; conditional edges in daily data are typically small. Databases need history to mature. Day-of-week events assume a five-day session calendar. Regime conditioning depends on the 200-period definition. A research and confluence tool, not a standalone system.
Credits
The Wilson score interval by Edwin B. Wilson (1927), Laplace-style shrinkage estimation, and event-study methodology long established in quantitative finance. Their combination into a live, regime-conditional, overlap-corrected event database with quality-weighted log-odds pooling, implemented in Pine Script, is original work by Quantum Algo, published open source.
Step-by-step: adding it to your TradingView chart
Open the script page on TradingView (link above) and click Add to favorites, then Use on chart — or on any chart open Indicators, search "Event Probability Engine Quantum Algo" and add it. Free on every TradingView plan.
Open the indicator's settings and set the inputs for your market and timeframe from the table above; the defaults are tuned for the daily timeframe on liquid symbols.
In the Style tab, match the colours to your chart theme; the dashboard position and text size are in Inputs.
To set alerts, right-click the chart → Add alert, choose the indicator as the condition and pick the event; set "Once per bar close" so alerts match the closed-bar logic.
Save the layout, and add the other free Quantum Algo tools to it — they are designed to sit together.
To read or reuse the code, click Source code on the script page; republishing is subject to TradingView's house rules.
Inside the code, for developers
Pine Script, open source. Worth reading if you want to modify it: every detection and signal gated on barstate.isconfirmed; state held in capped arrays of drawing objects with explicit create, update and retire functions; where statistics are kept, first-in-first-out arrays with shrinkage and a Wilson bound computed inline; named alertcondition calls so webhooks receive a consistent payload. The Academy's Pine Script tutorials and the TradingView backtesting guide cover strategy conversion.
Using it with the other free indicators
The free tools layer on one chart: the Smart Money Concepts Engine for bias and the Confluence Score; Order Blocks with Volume, Fair Value Gaps + Inversion and Institutional Key Levels for the zone; Liquidity Sweeps, Sessionscope and Liquidation Magnet for the liquidity and the trigger; OTE + Silver Bullet for the time-qualified entry; the Institutional Volume Profile and Pressure Oscillator for whether volume agrees; the trend and volatility family — the Adaptive Trend Sentinel, SuperTrend Engine, Golden Cross Engine, Anchored VWAP Engine, Trendline Architect, Keltner Rings and Volatility Storm Tracker — for regime, direction and room; and the momentum and statistics family — MACD Matrix, the Multi-Oscillator Divergence Scanner, the Event Probability Engine, the Market Bottom Finder, the Neural Confluence Engine, the Adaptive Lorentzian Classification and the Directional Strength Index — for momentum, probability and strength. The free-indicators hub lists every tool; the SMC guide is the method behind the layering.
Common mistakes with this indicator
- Trusting the developing bar — every event waits for the close.
- Trading every marker — the tool gives momentum and context; the entry needs a structure level and a stop beyond it.
- Default lengths on the wrong timeframe — adjust the inputs, as the settings table shows.
- Reading the statistics as promises — they describe this chart's history, shrunk toward neutral on purpose.
- Stacking ten random scripts — the free tools layer because they were built to.
Want the signal, not just the structure?
Zeno reads Smart Money structure across timeframes and prints the entry, stop, TP1 and TP2 on your chart — with a public record of 160 posted trades, 120 wins and 40 losses at the stated levels. QuantumBot executes it on Bybit, Binance, OKX, Bitget and Kraken.

Glossary for this indicator
Frequently asked questions
Does the Event Probability Engine repaint?
Statistics are recorded and evaluated on closed bars, and pivot events use confirmed pivots. The dashboard and forecast update on the live bar by design, as a dashboard should.
Why do most probabilities sit near 50%?
Because genuine conditional edges in daily data are small, and the shrinkage and overlap corrections are built to say so. Extreme probabilities on thin samples are the signature of a dishonest tool.
What does the ® mark mean?
That event has enough regime-matched samples, so its statistics are computed only from the current bull or bear regime.
Why are moon phases in a statistics tool?
As a falsification control: the engine should be able to show which inputs carry no edge — and you can watch it do so.
Can I use it intraday?
Yes, but horizons become bars and day-of-week events lose meaning; the design intent is the daily timeframe.
How does it relate to Zeno?
Zeno prints entries with stop and targets; the engine adds the day's conditional probabilities as context — bias, not timing.
Is there a TradingView indicator that shows probability?
This one — but it shows conditional historical probabilities with confidence bounds, not a prediction. The safeguards are the point.
Does day-of-week seasonality really exist?
Sometimes, on some symbols, in some regimes — which is exactly what an engine with shrinkage, bounds and regime conditioning can tell you honestly for your chart.
What is a Wilson lower bound?
The conservative edge of a confidence interval for a proportion; an event with a lower bound above 50% has an edge that survived its own sample size.
Why do the numbers change as the chart loads?
The databases fill as bars are processed; readings stabilise once each event reaches its minimum sample.
Can I use it for crypto?
Yes on the daily; consider disabling day-of-week events if you treat weekends as sessions — the other fifteen events apply unchanged.
What is the forecast cone?
The composite's expected path with a one-sigma band from the current close over the five-day horizon — a range around a small tilt, drawn honestly.
The momentum and statistics family
Momentum, probability and strength — the reads that sit under the Smart Money layer and beside the trend tools.
Add Event Probability Engine to your chart
One click on TradingView, free on every plan, code you can read. Nothing repaints.