Divergence (Regular and Hidden)
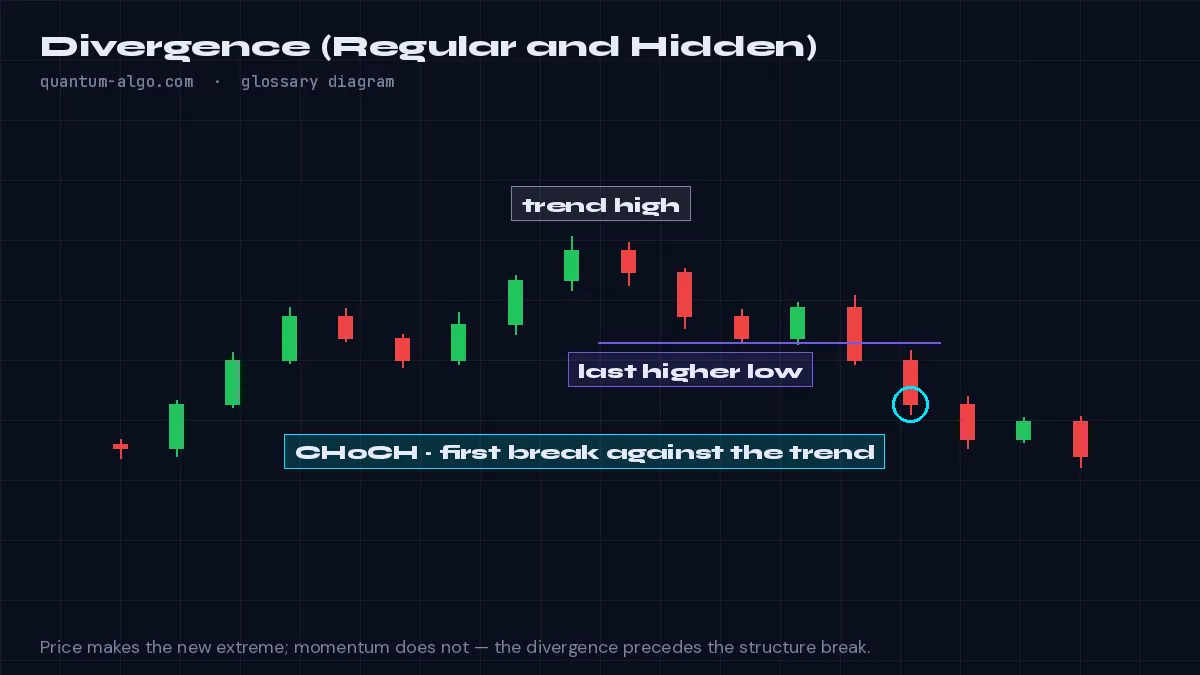
Divergence is when price makes a new extreme but an oscillator does not confirm it: regular divergence (price higher high, oscillator lower high) signals a possible reversal; hidden divergence (price higher low, oscillator lower low) signals trend continuation.
What it means
Divergence compares two slopes at consecutive swing points — the slope of price and the slope of a momentum measure such as RSI, MACD or OBV. When the two disagree, momentum is not supporting the price move. Regular bearish divergence is a higher high in price with a lower high in the oscillator; regular bullish is a lower low with a higher low. These are reversal signals.
Hidden divergence is the continuation form: in an uptrend, price makes a higher low while the oscillator makes a lower low — the pullback was deep in momentum terms but shallow in price, which favours the trend resuming. Hidden bearish is the mirror in a downtrend.
Divergence is evidence, not a trigger. It persists in strong trends and fails often on its own; requiring several independent oscillators to diverge at the same confirmed pivot (confluence) and a structure level at the pivot converts it into a tradeable signal. That is the design of the Multi-Oscillator Divergence Scanner.
How to identify it on a chart
- Mark two consecutive confirmed swing highs (or lows) on price.
- Read the oscillator at the same two bars.
- Opposite slopes: regular divergence if price made the new extreme; hidden if the oscillator did.
Worked example
BTC prints a higher high at 66,800 versus 66,200; RSI reads 61 versus 68 at those bars. Regular bearish divergence — the higher high came with less momentum. OBV and MFI show the same, and the confluence of three engines at a swept high is the short setup.
See it on the chart, read it in depth
Frequently asked questions
Which oscillator is best for divergence?
None alone; RSI is the most used, but agreement across RSI, MACD, OBV and MFI at the same pivot is far more reliable than any one.
Does divergence predict tops and bottoms?
It flags weakening momentum; tops and bottoms come later, at structure. Trade the change of character after the divergence, not the divergence itself.
How is hidden divergence different?
Regular divergence signals reversal; hidden divergence signals continuation. The slopes are compared the same way, but which series made the new extreme is reversed.
Can divergence be automated without repainting?
Yes, using confirmed pivots on both series; the scanner draws the lines only at pivot confirmation.
Related terms
See Divergence (Regular and Hidden) on your TradingView chart
Zeno reads Smart Money structure across timeframes and prints the entry, stop and targets — with a public record of every posted trade. The free indicators draw the concepts this page defines.