Swing Points: The Complete Guide to Swing Highs & Lows
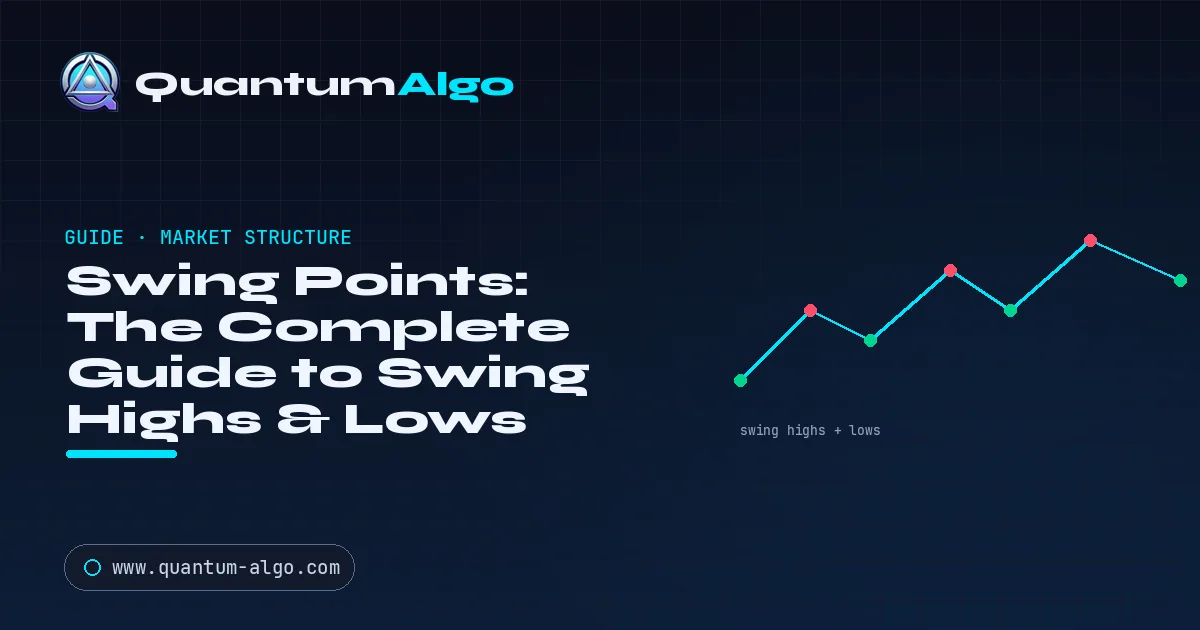
A swing high is a candle whose high exceeds the highs of a set number of candles on each side; a swing low is the mirror. They define structure: higher highs and higher lows make an uptrend, lower highs and lower lows a downtrend. A strength-2 swing confirms after two more candles close, and liquidity rests beyond every swing.
What Are Swing Points in Trading?
A swing point is a local turning point on the chart — a spot where price stops moving in one direction, reverses, and heads the other way. There are two kinds. A swing high is a peak: a candle whose high is higher than the highs of a set number of candles on either side of it. A swing low is a trough: a candle whose low is lower than the lows of the candles on either side. Strung together, swing highs and swing lows are the raw skeleton of market structure — they are how you objectively define where a trend is going.
Everything else in technical analysis is built on top of these points. A series of higher swing highs and higher swing lows is an uptrend. A series of lower highs and lower lows is a downtrend. Support and resistance are drawn from them. Smart Money Concepts, order blocks, and break-of-structure signals all reference swing points. If you can reliably identify swing highs and lows, you can read structure on any market and any timeframe.
How to Identify a Swing High and a Swing Low
The standard definition uses a pivot lookback — often called pivot strength. A swing high of strength 2 is a candle whose high is greater than the highs of the 2 candles before it and the 2 candles after it. A swing low of strength 2 is a candle whose low is below the lows of the 2 candles on each side. The higher the strength, the more significant (and rarer) the swing.
- Strength 1–2: many small swings — useful for scalping and lower timeframes, but noisy.
- Strength 3–5: the major turning points most swing and day traders care about.
- Higher strength: only the biggest structural pivots survive — good for higher-timeframe bias.
The critical practical detail: a swing point can only be confirmed after the candles to its right have formed. A strength-2 swing high is not confirmed until 2 more candles print beyond it. This lag is unavoidable — you cannot know a candle was the peak until price fails to exceed it — and it is why swing-based tools are, by nature, slightly delayed. That is a feature, not a flaw: it filters out noise. It is also closely related to why some tools appear to repaint — a forming swing can change until its confirmation candles close.
Why do swing points define market structure?
Market structure is nothing more than the sequence of swing highs and swing lows. Read them in order and the trend tells itself:
- Uptrend: higher highs (HH) and higher lows (HL). Each pullback bottoms above the last.
- Downtrend: lower highs (LH) and lower lows (LL). Each bounce tops below the last.
- Range: swings oscillate between a roughly flat high and a roughly flat low.
Two structural events matter most, and both are defined by swing points. A break of structure (BOS) happens when price closes beyond the most recent swing point in the direction of the trend — confirming continuation. A market structure shift (MSS), also called a change of character, happens when price breaks a swing point against the prevailing trend — the first hint of a reversal. You literally cannot define either without first marking the swings. This is why swing points sit underneath the entire top-down / higher-timeframe bias workflow.
Why does liquidity rest at swing points?
Here is the part most beginners miss, and it is the single most useful thing about swing points. Above every obvious swing high sits a pool of buy-side liquidity (BSL) — the stop-losses of short sellers and the buy-stop orders of breakout traders. Below every obvious swing low sits sell-side liquidity (SSL) — the stops of longs and the sell-stops of breakout sellers. Swing points are not just chart geometry; they are where the orders are.
Large participants need that resting liquidity to fill big positions without moving price against themselves. So price is frequently drawn toward obvious swing highs and lows, spikes just beyond them to trigger the orders, and then reverses. That behaviour is the liquidity sweep (also called a liquidity grab or stop hunt): a wick through a swing point that closes back inside the prior range. The breakout looks real for a moment, traps everyone who chased it, and reverses. Understanding that swing points are liquidity pools reframes them from "lines on a chart" into "the exact prices the market is hunting."
![Liquidity Sweeps [Quantum Algo] indicator on the BTCUSDT 2-hour chart, marking bullish and bearish liquidity sweeps at swing highs and swing lows with a dashboard of sweep counts and nearest buy-side and sell-side levels.](/blog/guides/swing-points-complete-guide/liquidity-sweeps-swing-points-quantum-algo.webp)
The chart above shows this in practice on Bitcoin. Every liquidity level the tool draws sits at a confirmed swing high (buy-side, above) or swing low (sell-side, below). The "Sweep" markers fire precisely when a wick takes that swing-point liquidity and closes back inside — turning an abstract swing point into a timed, tradeable event.
How to Trade Swing Points
Swing points are a context-and-timing framework, not a standalone buy/sell signal. Four practical ways traders use them:
1. Define trend and bias. Mark the last few major swings on your higher timeframe. HH/HL means only look for longs; LH/LL means only look for shorts. This single filter removes most bad trades.
2. Trade the sweep-and-reverse. Wait for price to sweep a swing point (wick through, close back inside), then look for a lower-timeframe structure shift in the opposite direction as your entry trigger. Your risk goes just beyond the swept extreme — a natural, logical stop.
3. Trade the break (BOS) with retest. When price closes decisively through a swing point in the trend direction, that is confirmation. Enter on the retest of the broken level rather than chasing the breakout candle.
4. Set targets at the next swing. The opposing swing points are natural take-profit zones, because that is where the next pool of liquidity — and the next likely reaction — sits.
Whichever approach you use, pair it with disciplined risk management. Swing points tell you where the important prices are; they do not remove the need to size positions so a single failed read can't hurt you.
How do swing points differ from fractals, pivots and S/R?
Several terms overlap, so it helps to separate them. Fractals (Bill Williams) are a specific 5-bar swing-point definition — a swing high/low with exactly two bars on each side. Pivot points in the classic sense are calculated levels from the prior period's high, low, and close — a different concept that happens to share a name with the pivot-lookback method. Support and resistance are the horizontal zones you draw from clustered swing points. In other words, swing points are the primitive; fractals are one way to detect them, and support/resistance is one thing you build from them. They are complementary, not competing.
Swing points also underpin tools you may already use: the Fibonacci golden pocket is measured between a swing low and a swing high; supply and demand zones form at the origin of moves that begin at swings; and premium and discount ranges are defined swing-to-swing.
Swing points vs fractals, pivots and support/resistance
| Concept | What it is | How it is found | Main use |
|---|---|---|---|
| Swing point | A local high or low where price turns | Pivot strength: beats N bars on each side | Defines structure and marks resting liquidity |
| Bill Williams fractal | A five-bar swing high or low | Middle bar beats two bars on each side | One fixed way to detect swing points |
| Classic pivot point | A calculated price level | From the prior period's high, low and close | Estimated intraday support and resistance |
| Support/resistance | A horizontal price zone | Drawn from clustered swing points | Reaction areas for entries and targets |
◆Swing points are the primitive: fractals are one way to detect them, and support/resistance is built from them.
What mistakes do traders make with swing points?
Using too low a pivot strength. Strength-1 swings appear everywhere and most are noise. Match strength to your timeframe and style.
Trading unconfirmed swings. A swing isn't real until its right-side candles close. Acting early means acting on a shape that can still change.
Treating a swing break as automatically bullish/bearish. Many breaks of swing points are sweeps, not genuine breakouts. The close — inside vs beyond the level — is what distinguishes a trap from a trend.
Ignoring the higher timeframe. A swing that looks major on the 5-minute chart may be trivial on the 4-hour. Anchor your read to the timeframe that matches your holding period.
Forgetting the liquidity angle. If you only see geometry and not the resting orders above/below each swing, you'll keep getting stopped out at exactly the wrong moment.

Automate your trades. Let Quantum Algo trade for you.
Every signal executed on your own account — 24/7, hands-off.
What is the difference between internal and external swing points?
Not all swing points carry the same weight, and separating them is what turns a beginner's messy chart into a clean structural read. Traders divide them into two layers. External swing points are the major highs and lows that define the range you are trading in — the significant peaks and troughs a higher pivot strength would catch. Internal swing points are the smaller swings that form inside that external range as price rotates between the big levels.
The distinction is practical. External liquidity (above the external high, below the external low) is where the largest resting orders sit, so those sweeps produce the biggest reversals. Internal swings are where you find your lower-timeframe entries once an external level has been swept. A clean workflow reads external structure first for direction, then drops down to internal structure for timing. Confusing the two — treating a small internal swing as if it were a major external one — is one of the most common reasons traders get chopped up in a range.
This layering is exactly how the top-down / higher-timeframe workflow operates: the higher timeframe supplies the external swings that set direction, and the lower timeframe supplies the internal swings that time the entry. Marking both, and never mistaking one for the other, is a skill that pays off on every chart.
How do swing points change across timeframes?
The same definition applies on every timeframe, but the meaning of a swing changes with the timeframe it forms on. A swing high on the 1-minute chart is a minor blip; a swing high on the weekly is a level the whole market watches. As a rule, higher-timeframe swings dominate lower-timeframe ones — a lower-timeframe uptrend can run straight into a higher-timeframe swing high and reverse hard. Aligning the two is where consistency comes from.
A simple way to match pivot strength and timeframe to your style:
- Scalping (1m–5m): use lower pivot strength (2–3) to catch fast internal swings, but always check the 15m/1H external swings for the level you are trading into.
- Day trading (15m–1H): strength 3–4 on the trading timeframe, with the 4H/Daily supplying the external bias swings.
- Swing trading (4H–Daily): strength 4–5, with the Weekly marking the major external highs and lows.
- Position trading (Daily–Weekly): only the largest swings matter; a handful of major peaks and troughs define the whole thesis.
Whatever the timeframe, the confirmation rule never changes: the swing is only real once the candles to its right have closed. On a Daily chart that means waiting days; on a 1-minute chart, minutes. The patience the higher timeframe demands is exactly why its swings are more reliable — fewer of them are noise.
How do you read a swing sequence in practice?
Imagine an uptrend. Price prints a swing low at 100, rallies to a swing high at 110, pulls back to a higher swing low at 104, and pushes to a new swing high at 116. Reading the swings in order — low 100, high 110, higher low 104, higher high 116 — you have textbook higher highs and higher lows: a confirmed uptrend. Your bias is long only.
Now price pulls back again. Two very different things can happen at the prior swing low of 104, and swing points tell you which. If price wicks below 104 — taking the sell-side liquidity resting under that swing low — and then closes back above it, that is a bullish liquidity sweep: the stops of weak longs were harvested, the breakdown failed, and the uptrend is likely to resume. You look for a long, with risk just below the wick. But if price closes decisively below 104 and then below 100, that is a genuine break of structure to the downside — a change of character — and the uptrend is now in question. Same level, opposite conclusions, decided entirely by whether the close held inside or broke beyond the swing.
This single distinction — sweep versus break — is the most valuable thing swing points give you, and it is why marking them precisely is worth the effort. It is also the exact logic the Liquidity Sweeps indicator automates on the chart below.
Which other trading tools are built on swing points?
Once you see swing points as the primitive underneath everything, the rest of your toolkit clicks into place. Consider how many popular concepts are secretly just swing points in disguise. A Fibonacci retracement is drawn from a swing low to a swing high (or vice versa) — move either anchor and every level moves with it, which is why sloppy swing selection produces useless Fibs. Supply and demand zones form at the base of the impulsive move that originates from a swing. A golden pocket entry only means anything because it sits between two correctly chosen swings.
The same is true across Smart Money Concepts. Order blocks are validated by the break of a swing point. Fair value gaps form during the displacement that breaks structure — and structure is swings. Even premium and discount is just the range between a swing high and a swing low, split at its midpoint. Learning to mark swings well is therefore not one skill among many; it is the skill that quietly upgrades every other tool on your chart.
How do you build a simple swing-point trading plan?
You can turn everything above into a repeatable routine. Start on your higher timeframe and mark the last three or four external swings to establish bias — are we making higher highs and higher lows, or lower highs and lower lows? That single read decides whether you are hunting longs or shorts today, and nothing on a lower timeframe should override it.
Next, identify the nearest un-swept external liquidity in your trade direction — the swing low below in an uptrend, or the swing high above in a downtrend. That is your area of interest: the price the market is most likely to reach for. Wait for price to arrive and sweep it (wick through, close back inside). Only then drop to a lower timeframe and wait for an internal structure shift in your direction as the entry trigger. Place your stop just beyond the swept wick — the tightest logical invalidation the chart offers — and target the opposing swing where the next liquidity pool waits.
Finally, size every position so that the stop, if hit, costs a small fixed fraction of your account, exactly as covered in the risk-management guide. A swing-point plan does not eliminate losing trades — nothing does — but it ensures every trade you take is anchored to a real level, entered after a real event, with a stop at a real invalidation. That structure is what separates consistent traders from the crowd chasing every breakout.
Mapping Swing-Point Liquidity with Quantum Algo
Marking every swing high and low by hand — and then watching each one to catch the exact moment it's swept — is slow and easy to miss. Quantum Algo's free, open-source Liquidity Sweeps [Quantum Algo] indicator on TradingView automates it: it detects confirmed swing highs and lows at a configurable pivot strength, draws the buy-side (BSL) and sell-side (SSL) liquidity level at each one, and flags the precise candle where that liquidity is swept and rejected. An optional volume filter confirms only sweeps that trade above average volume, filtering out low-conviction wicks, and a dashboard tracks bullish/bearish sweep counts and the nearest un-swept levels with their distance from price.
It's the shown-on-chart version of everything in this guide: swing points as liquidity, and the sweep as the timed event. Because it's open-source, you can read exactly how it defines a swing and a sweep — no black box. For a complete structural read, pair it with the Smart Money Concepts toolkit and confirm entries with market structure and risk management.
Get the free Liquidity Sweeps indicator → See the full toolkitFrequently Asked Questions
A swing point is a local turning point on the chart. A swing high is a peak — a candle whose high is higher than the highs of a set number of candles on each side. A swing low is a trough — a candle whose low is lower than the lows on each side. Swing highs and lows are the building blocks of market structure and define whether a market is trending up, down, or ranging.
Use a pivot lookback (pivot strength). A swing high of strength 2 is a candle whose high exceeds the highs of the 2 candles before and 2 candles after it; a swing low of strength 2 is a candle whose low is below the lows of the 2 candles on each side. Higher strength values keep only the more significant swings. Importantly, a swing is only confirmed once the required candles to its right have closed.
Because they define market structure. A sequence of higher swing highs and higher lows is an uptrend; lower highs and lower lows is a downtrend. Breaks of structure and market-structure shifts are defined by swing points, and support/resistance, Fibonacci levels, and Smart Money Concepts all reference them. They also mark where liquidity (stop orders) rests, which is where price is often drawn.
A swing high is a peak: the high point of a short-term up-move, with lower highs on both sides. A swing low is a trough: the low point of a short-term down-move, with higher lows on both sides. Swing highs are potential resistance and hold buy-side liquidity above them; swing lows are potential support and hold sell-side liquidity below them.
Buy-side liquidity (BSL) is the cluster of buy orders — short-sellers' stop-losses and breakout buy-stops — resting above a swing high. Sell-side liquidity (SSL) is the cluster of sell orders resting below a swing low. Large players are drawn to these pools because they need the orders to fill size, which is why price often spikes just beyond swing points before reversing.
A liquidity sweep (or stop hunt) is when price wicks beyond a swing high or low — taking the resting liquidity — then closes back inside the prior range. The wick grabs the orders; the close shows the breakout failed. A bearish sweep takes buy-side liquidity above a swing high and reverses down; a bullish sweep takes sell-side liquidity below a swing low and reverses up.
It depends on your timeframe and style. Strength 1–2 produces many small swings suited to scalping but noisy; strength 3–5 captures the major turning points most swing and day traders use; higher values keep only the biggest structural pivots for higher-timeframe bias. Match the strength to the size of moves you actually trade.
A confirmed swing point does not change once its right-side candles have closed. However, a forming swing can appear and then disappear until it is confirmed, which some traders describe as repainting. This is expected behaviour — you cannot know a candle was the peak until price fails to exceed it — so always wait for confirmation before acting on a swing.
Four common ways: use the sequence of swings to define trend and bias; trade the sweep-and-reverse (wait for a swing to be swept, then enter on a structure shift the other way); trade a confirmed break of structure on the retest; and set targets at the next opposing swing where the next liquidity pool sits. Always place risk beyond the relevant swing extreme.
Fractals (Bill Williams) are a specific swing-point definition using exactly two bars on each side of the pivot — a 5-bar pattern. Swing points are the general concept; fractals are one method of detecting them. Both mark local highs and lows, but the swing-point framework lets you choose the pivot strength rather than being fixed at two bars per side.
Not quite. Swing points are individual turning points; support and resistance are the horizontal zones you draw from clusters of swing points at similar prices. Support and resistance are built from swing points. A single swing point becomes a stronger level when price has reacted at that area multiple times.
Quantum Algo's free, open-source Liquidity Sweeps indicator on TradingView automatically detects confirmed swing highs and lows at a configurable pivot strength, draws the buy-side and sell-side liquidity level at each, and flags the exact candle where that liquidity is swept and rejected — with an optional volume filter and a dashboard of sweep counts and nearest levels. It turns manual swing-marking into a timed, on-chart signal.
References & Related Guides
More in this topic
- ADX Indicator: Complete Trading Guide
- AlphaTrend Indicator: Complete Trading Guide
- ATR (Average True Range): Complete Trading Guide
- Awesome Oscillator: Complete Indicator Guide
- What Are the Best Volume Indicators?
- Bollinger Bands — Complete Trading Indicator Guide
- CCI Indicator: Complete Guide
- Chandelier Exit: Complete Trading Guide
- Donchian Channels: Complete Indicator Guide
- Fibonacci Bollinger Bands: Complete Trading Guide
- Fibonacci Retracement — Complete Trading Guide
- Hull Moving Average (HMA): Complete Trading Guide
- Gaussian Channel Indicator Guide
- Best Buy/Sell Indicator Guide
Core reading
- BOS & CHoCH: Complete Market Structure Guide
- Order Blocks Trading: Complete Guide
- Best TradingView Indicators — Complete Guide
- Risk Management in Trading — Complete Guide
- Candlestick Patterns Guide — Engulfing, Pinbar & More
- All Premium Guides
- Quantum Algo on TradingView
- Public Track Record