Pivot (Left/Right Lookback)
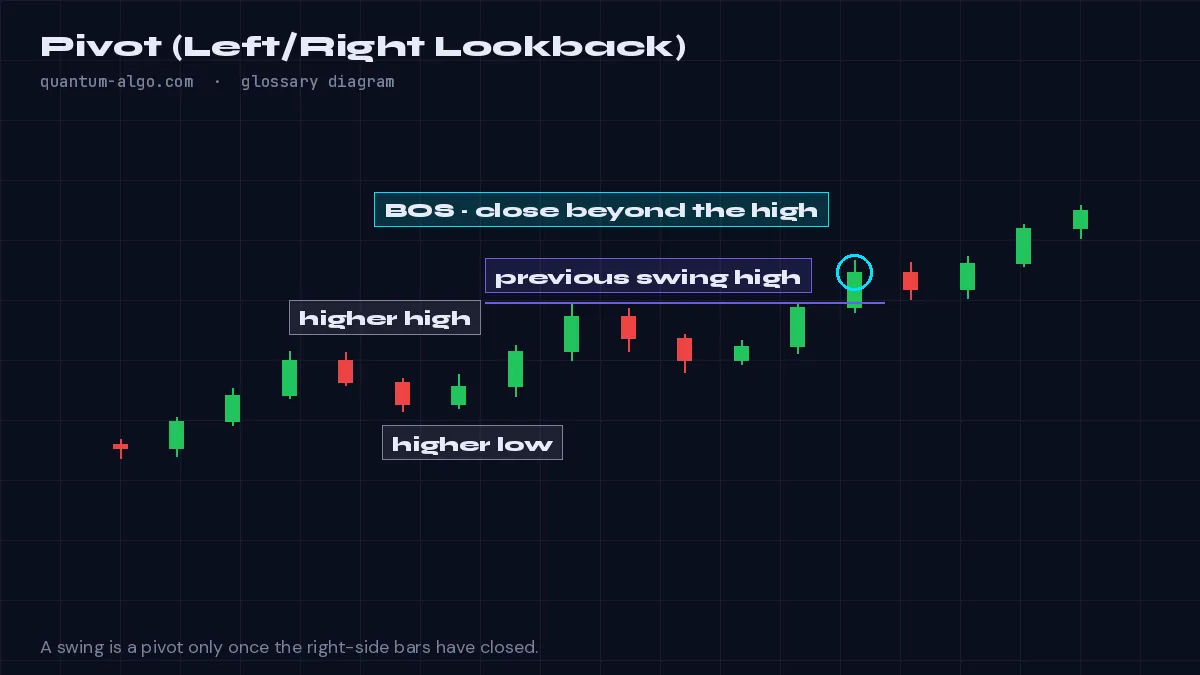
A pivot is a bar whose high (or low) is the highest (or lowest) within a set number of bars on each side — the left and right lookback; the right lookback means the pivot is confirmed only that many bars later, which is the built-in delay of every swing-based indicator.
What it means
Indicators find swing points with a pivot test: a bar is a pivot high if no bar within `left` bars before it and `right` bars after it has a higher high. The left lookback sets how significant the swing must be; the right lookback sets how long you wait to know it is a swing. Pivot length 5/5 confirms a swing five bars after it printed.
This delay is unavoidable and honest. A tool that plotted swings with no right lookback would be guessing that the current high is a top; when price goes higher, the plot would move — repainting. Confirmed pivots, plotted at the confirmation bar or drawn back to the pivot bar once confirmed, do not.
Pivot length is the most important setting in divergence scanners, trendline tools, liquidity-sweep detectors and structure engines: shorter for intraday sensitivity, longer for cleaner swings on higher timeframes.
How to identify it on a chart
- Choose a left/right length (5/5 intraday, 8–10 on 4-hour and above).
- A pivot high exists when the bar's high exceeds every bar within that window.
- Use the confirmation bar (pivot bar + right length) as the earliest moment the swing can be traded.
Worked example
With pivot 5/5, the high at bar 100 is confirmed at bar 105. A divergence scanner compares oscillator values at bars 100 and 80 (the previous pivot) and prints the divergence on bar 105 — five bars after the swing, honestly.
See it on the chart, read it in depth
Frequently asked questions
What pivot length should I use?
5 on 15-minute to 1-hour charts, 8–10 on 4-hour and daily; longer lengths give fewer, more significant swings.
Why does my swing appear late?
The right lookback: the indicator waits that many bars to be sure the swing held. That is confirmation, not a bug.
Can I set right lookback to zero?
You can, but then every swing is provisional and will move — the definition of repainting.
Do all Quantum Algo scripts use pivots?
The structure, liquidity, trendline and divergence tools do, with confirmed pivots and drawings anchored to the confirmed bar.
Related terms
See Pivot (Left/Right Lookback) on your TradingView chart
Zeno reads Smart Money structure across timeframes and prints the entry, stop and targets — with a public record of every posted trade. The free indicators draw the concepts this page defines.