Zig Zag Indicator: How It Works, Settings, Repainting and How to Use It
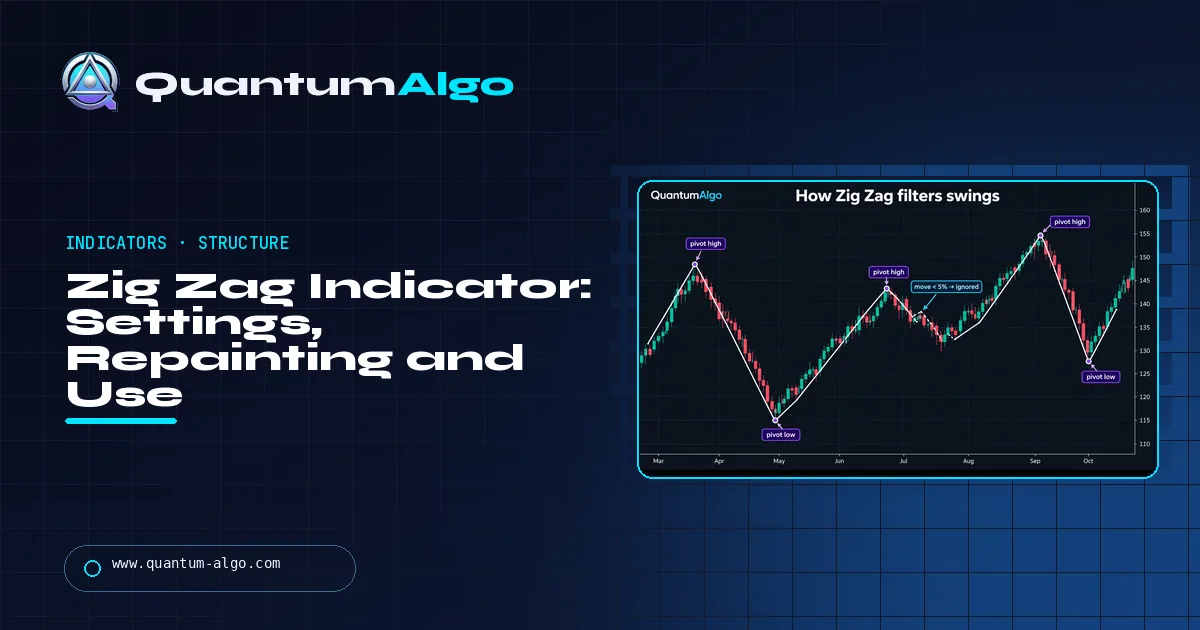
The Zig Zag indicator connects swing highs and lows that are at least a set percentage apart — 5% is the traditional setting — and ignores smaller moves, giving a clean outline of the trend. It repaints by design: the last leg is provisional until price reverses by the full deviation. Use confirmed pivots to read structure, count waves and anchor Fibonacci levels, and time entries on confirmation, not on the last leg.
Every chart is full of swings that do not matter. The Zig Zag indicator removes them: it draws only the turning points separated by a minimum move, so the trend, its pullbacks and its structure become obvious at a glance. It is also one of the most misunderstood indicators, because its last line moves on live data and backtests built on it often cannot be traded. This guide covers how it is calculated, the settings on TradingView and MetaTrader, which deviation to use, why it repaints and how to use it properly — with a calculator.
Indicators that prove themselves in public.
One engine, four precision tools — the Gold (XAU) Scalper, the institutional Gravity Zone, the Zeno momentum Oscillator, and Zeno Stocks for equities.



What is the Zig Zag indicator?
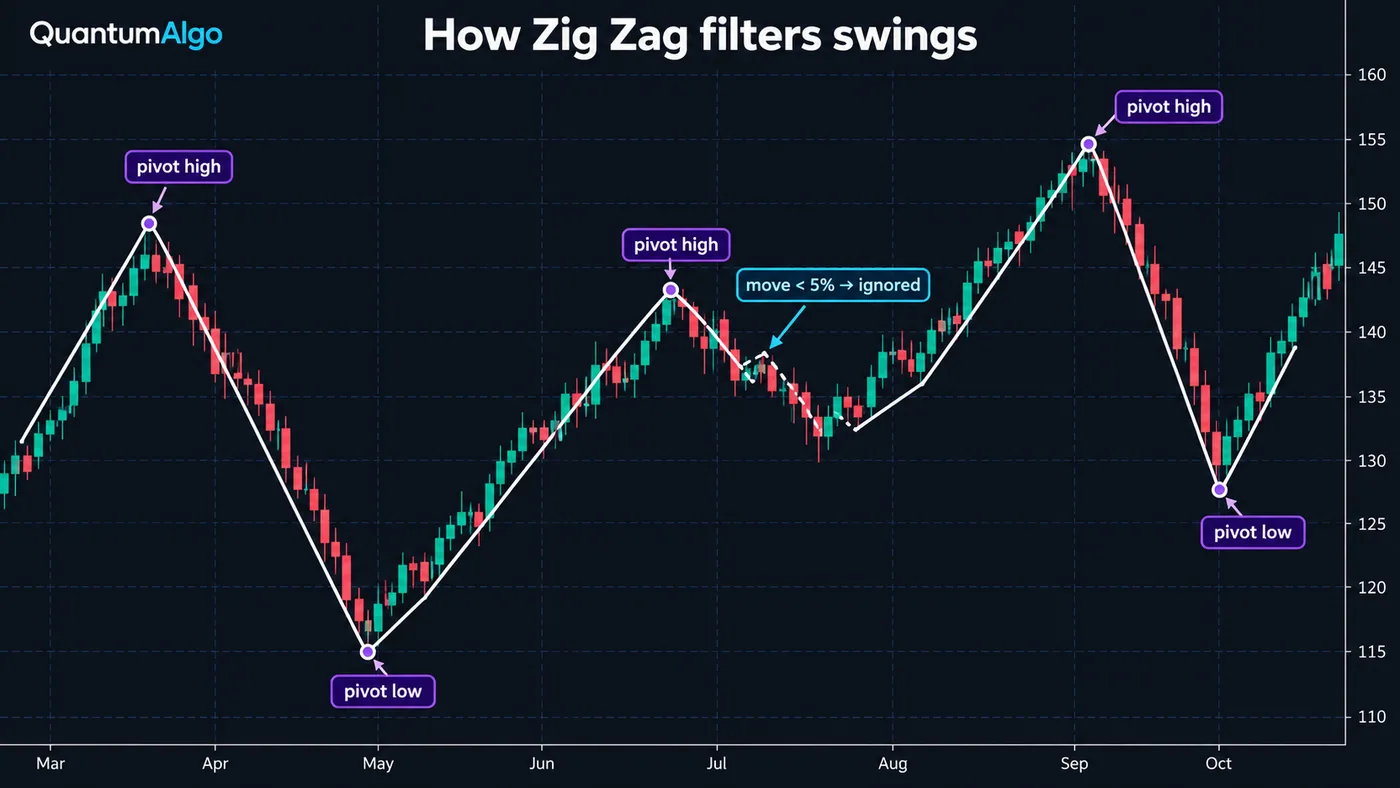
The Zig Zag indicator draws straight lines between swing highs and swing lows that are at least a set percentage apart, and ignores every price move smaller than that. Set it to 5% and it connects only turning points separated by moves of 5% or more; every pullback under 5% disappears inside the leg. The result is a clean outline of the trend — the swings, without the noise.
Two properties define it. It is a filter, not a forecast: it draws its lines on hindsight and has no predictive power on its own. And its last leg is provisional: the most recent line keeps extending or can be redrawn until price reverses by the full deviation, so the Zig Zag repaints on live data. Used with that in mind, it is one of the most useful tools for seeing market structure, counting waves and measuring swings. Its idea goes back to Arthur Merrill's 1977 book Filtered Waves.
How is the Zig Zag calculated?
- Start from a point. The first price in the data, or the first confirmed pivot.
- Track the extreme. In an up-leg, keep recording each new high; in a down-leg, each new low.
- Wait for the reversal. When price retraces from the extreme by at least the deviation — for example 5% — the extreme becomes a confirmed pivot.
- Start the next leg. Track the new extreme in the opposite direction from the pivot.
- Repeat. The chain of pivots is the Zig Zag; the leg from the last pivot to the current extreme is provisional.
On line charts the calculation uses closing prices; on bar and candlestick charts most platforms use the highs and lows, which produces larger swings. Some versions add a minimum number of bars between pivots, which filters by time as well as by size. In practice the settings differ by platform:
What are the Zig Zag settings on TradingView and MetaTrader?
| Platform | Inputs | Defaults |
|---|---|---|
| TradingView (built-in Zig Zag) | Reversal price deviation (%), pivot legs (bars to confirm a pivot), extend to last bar, display reversal price, cumulative volume and price change | Deviation 5%, pivot legs 10 (per published source code) |
| MetaTrader 4/5 (ZigZag) | Depth (bars), Deviation (points, not percent), Backstep (bars) | Depth 12, Deviation 5, Backstep 3 |
| StockCharts | Percentage | 5% traditional |
The two big platforms filter differently. TradingView's version combines a percentage deviation with pivot legs — the number of bars on each side needed to confirm a high or low — so a pivot needs both a large enough move and enough bars around it. MetaTrader's classic ZigZag uses Depth (the minimum bars between pivots), Deviation measured in points rather than percent, and Backstep (bars before a new pivot can replace the previous one). Copying a "5" from one platform to the other does not give the same lines.
Which Zig Zag deviation should you use?
| Use | Timeframe | Starting deviation |
|---|---|---|
| Intraday structure (indices, forex) | 5–15 minute | 0.3%–1% (or ATR-based) |
| Swing trading stocks | Daily | 5%–8% |
| Crypto swings | 4-hour to daily | 5%–10% |
| Major trend legs / Elliott counting | Daily to weekly | 10%–20% |
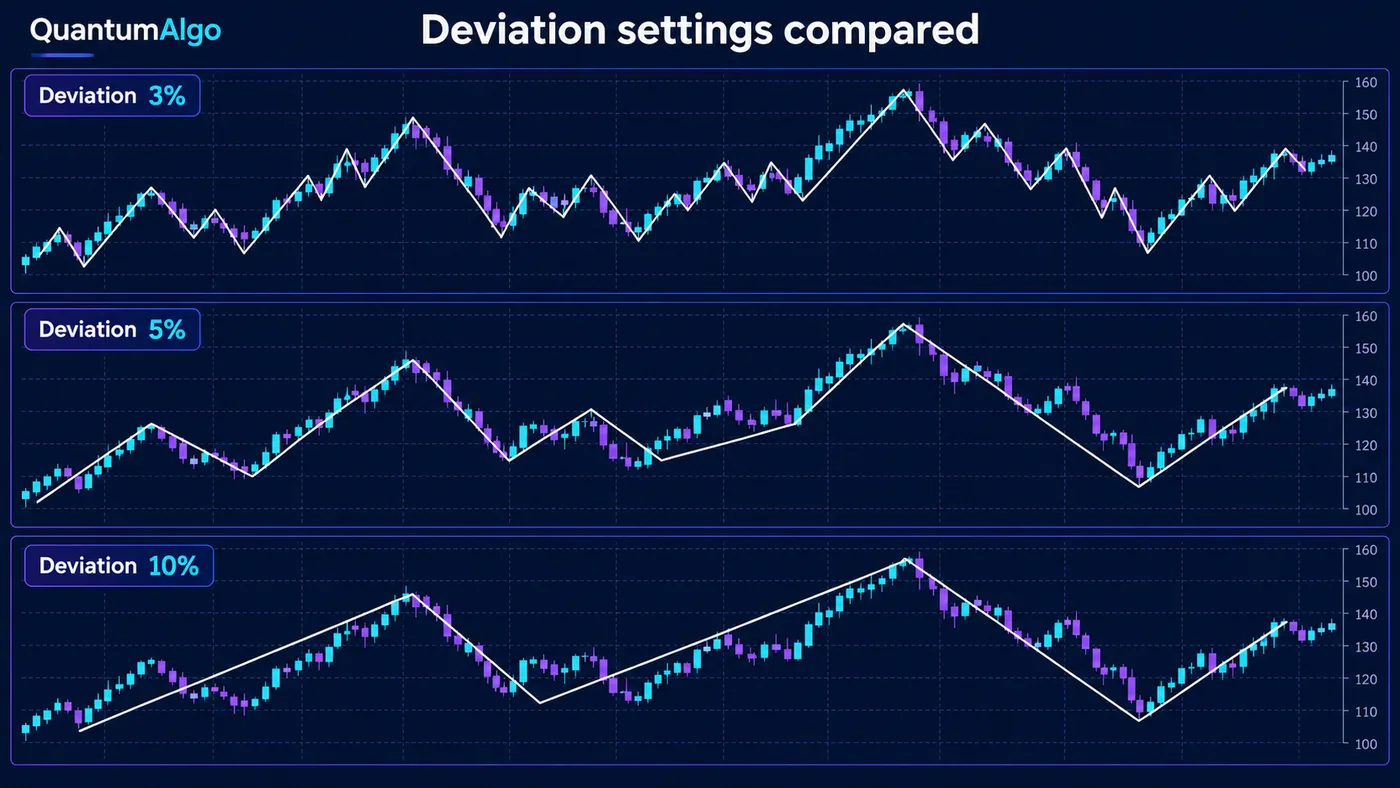
There is no correct setting; there is the swing size you trade. A lower deviation draws every minor swing and is useful for intraday structure; a higher one keeps only the legs that matter for swing or position trading. Because volatility differs by market, a percentage that works on a stock index is too tight for an altcoin and too loose for EURUSD. Two practical methods: set the deviation to roughly the size of the pullbacks you would ignore while holding a trade, or tie it to volatility — a multiple of the ATR as a percentage of price.

Automate your trades. Let Quantum Algo trade for you.
Every signal executed on your own account — on your account, with the plan you define.
Does the Zig Zag indicator repaint?
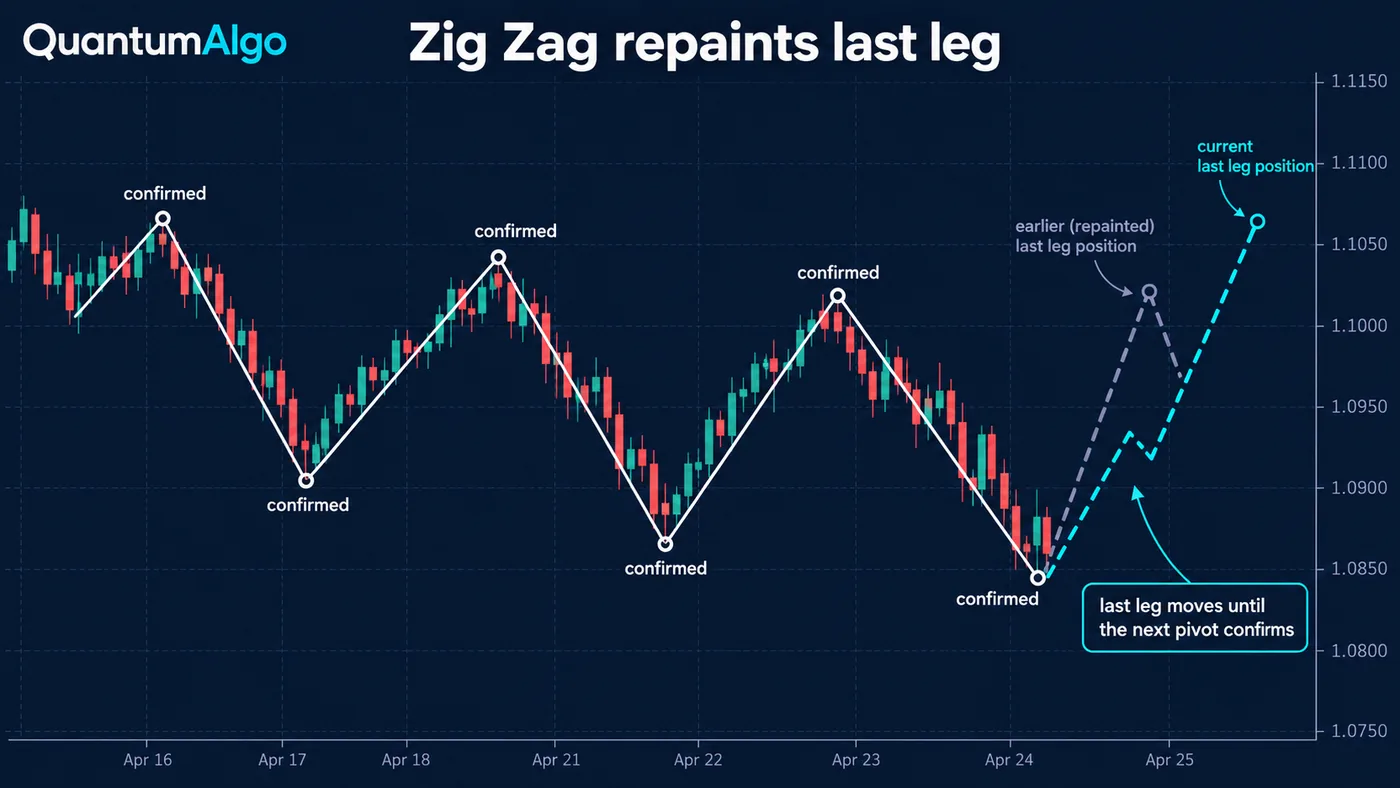
Yes — by design. The last line always runs from the most recent confirmed pivot to the current extreme. While price keeps making new extremes in that direction, the line extends. If price reverses by less than the deviation and then resumes, the line simply continues. Only when price reverses by the full deviation does the extreme become a confirmed pivot — and on platforms with pivot legs, only after enough bars have printed on the right side. TradingView's help states it directly: the latest line is not final.
That has two consequences. A Zig Zag never tells you that a swing has ended in real time; it tells you after the reversal has already travelled the deviation. And backtests that read Zig Zag pivots as if they were known at the turning point produce results that are impossible to trade. Use confirmed pivots for analysis and plan entries on confirmation, not on the provisional leg.
How do traders use the Zig Zag indicator?
| Use | How | Watch out for |
|---|---|---|
| Market structure | Read higher highs and higher lows, or lower highs and lower lows, from the pivots | The last pivot is provisional |
| Elliott Wave counting | Use a deviation that isolates the waves at the degree you count | Different settings give different counts |
| Chart patterns | Pivots outline double tops, head and shoulders, triangles and harmonics | Patterns drawn on the provisional leg can vanish |
| Fibonacci | Measure retracements and extensions between confirmed pivots | Anchor only to confirmed swings |
| Support and resistance | Pivot prices mark swing levels | Combine with liquidity and volume |
The most common practical use is as a structure map. With a sensible deviation, the pivots show the sequence of swing points that define trend: higher highs and higher lows in an uptrend, the first lower high as a warning, and a break of the last higher low as a market structure shift. For Elliott Wave traders the Zig Zag removes subjectivity in where waves start and end; for harmonic and Fibonacci traders it gives consistent anchor points.
Is there a Zig Zag trading strategy?
- Define trend from the confirmed pivots. Two higher highs and higher lows for an uptrend.
- Wait for a pullback into the previous swing area. The zone between the last confirmed high and the Fibonacci 50%–61.8% of the leg.
- Wait for confirmation. A lower-timeframe structure shift or a reaction candle — not the provisional Zig Zag leg.
- Place the stop beyond the last confirmed pivot. If price breaks it, the structure the trade relied on is gone.
- Target the next swing. The previous high, or a Fibonacci extension of the leg.
This is a structure strategy that uses the Zig Zag for the map, not for the trigger. Strategies that buy when a new Zig Zag low prints look excellent on historical charts and fail live, because on live data the low is only confirmed after price has already risen by the full deviation.
Zig Zag calculator
Paste a series of prices — closes from any chart — and choose a deviation. The calculator walks the series exactly as the indicator does and returns the confirmed pivots, each leg's size and the provisional last leg, so you can see which swings a given setting keeps and why the last one is not final. The sample prices are illustrative.
Reference data
| Item | Value |
|---|---|
| Definition | Lines between swing highs and lows at least X% apart |
| Traditional setting | 5% |
| Repaints? | Yes — the last leg is provisional |
| Origin | Arthur Merrill, Filtered Waves (1977) |
| TradingView inputs | Deviation %, pivot legs, extend to last bar, labels |
| TradingView defaults | Deviation 5%, pivot legs 10 (published source) |
| MetaTrader inputs | Depth, Deviation (points), Backstep |
| MetaTrader defaults | 12, 5, 3 |
| Prices used | Closes on line charts; highs and lows on bar and candle charts |
| Main uses | Structure, Elliott Wave, patterns, Fibonacci anchors |
Worked example: what a 5% Zig Zag keeps
Take the calculator's sample series, which rises from 100 to 110, falls to 98, rallies to 115 and dips to 107. With a 5% deviation the first pivot is the start at 100; the rally to 110 is confirmed as a swing high when price falls to 104.5 or below (it reaches 103), the fall to 98 is confirmed as a swing low when price recovers to 102.9 (it reaches 106), and the rally to 115 becomes a swing high when price drops to 109.25 (it reaches 107). The legs are +10%, −10.9% and +17.3%; the small dip from 107 to 105 inside the first rally and the bounce to 104 inside the decline are ignored.
At the last bar, price is 108 — the leg from 115 down to 107 is provisional. If price rose back above 115, that line would be redrawn as part of a longer up-leg; if it fell further, the line would extend. Change the deviation to 3% and the small swings reappear; change it to 10% and only the larger legs remain. That is the whole indicator in one exercise.
What mistakes do traders make with the Zig Zag indicator?
- Trading the provisional leg. The last line can extend or be redrawn; it is not a signal.
- Backtesting on repainted pivots. Results that assume pivots were known at the turn cannot be repeated live.
- One setting for every market. Volatility differs; scale the deviation to the instrument and timeframe.
- Copying settings across platforms. MetaTrader's deviation is in points and TradingView's in percent, with different confirmation logic.
- Forcing pattern counts. Changing the deviation until a pattern appears is curve-fitting.
- Using it alone. It shows structure; it does not show liquidity, volume or confirmation.
How does the Zig Zag fit with structure and the free indicators?
The Zig Zag is a way of seeing swings; the trading decisions come from what price does at them. The useful combination is confirmed swing structure plus a reason to act: a liquidity sweep of a prior pivot followed by a shift in structure, a retest of a broken swing level, or a reaction at a Fibonacci zone between confirmed pivots. The swing points, trendline trading and support and resistance guides cover those decisions.
On TradingView the free Quantum Algo indicators mark swing structure, liquidity and key levels automatically, without the repainting last leg of a classic Zig Zag; Zeno, the premium engine, prints its own buy and sell signals with an entry, a stop and two targets, and the public track record lists every call.
The Zig Zag indicator filters out swings smaller than a chosen percentage so the trend's structure is easy to read. Its last leg is provisional and repaints, so use confirmed pivots for analysis — structure, Elliott Wave, patterns and Fibonacci anchors — and take entries on confirmation. Scale the deviation to the market and timeframe, and remember MetaTrader and TradingView define it differently.
◆ Interactive check
Do you understand the Zig Zag indicator?
Questions traders ask about the Zig Zag indicator
An indicator that draws lines between swing highs and swing lows that are at least a set percentage apart and ignores smaller moves, so the trend's structure is easy to see.
There is no single best. 5% is traditional; intraday traders use much smaller values or an ATR-based setting, and position traders 10% or more. Set it to the size of the pullbacks you would ignore while holding a trade.
Yes. The last line runs from the latest confirmed pivot to the current extreme and can extend or be redrawn until price reverses by the full deviation. Earlier legs do not change.
Add the built-in Zig Zag, set the reversal price deviation (%) and the pivot legs, and optionally display the reversal prices and price changes. Read structure from the confirmed pivots.
Depth 12, Deviation 5 and Backstep 3 by default. Depth is the minimum bars between pivots, Deviation is in points, and Backstep is the bars before a new pivot can replace the previous one.
Yes — it is widely used to mark wave starts and ends consistently. Choose a deviation that matches the degree you are counting, and do not change it until a count appears.
Use it as a map, not a trigger: define trend from confirmed pivots, wait for a pullback and a confirmation, stop beyond the last confirmed pivot and target the next swing.
TradingView combines a percentage with pivot legs, MetaTrader uses depth, deviation in points and backstep, and some versions use closes rather than highs and lows.
Its idea is credited to Arthur Merrill's 1977 book Filtered Waves, which filtered price swings by a minimum percentage.
Versions that only plot pivots after they are confirmed do not change past lines, but they appear with a delay. The delay is the price of not repainting.
References & Related Guides
Read next
- Swing Points
- Market Structure Shift
- Elliott Wave Theory
- Elliott Wave Flats
- Fibonacci Retracement
- Harmonic Patterns
- Trendline Trading
- Support and Resistance
- ATR Guide
- Chart Patterns
- Free TradingView indicators
- Zeno — the premium engine