Non-Repaint Indicators: The Complete Guide to Reliable Signals
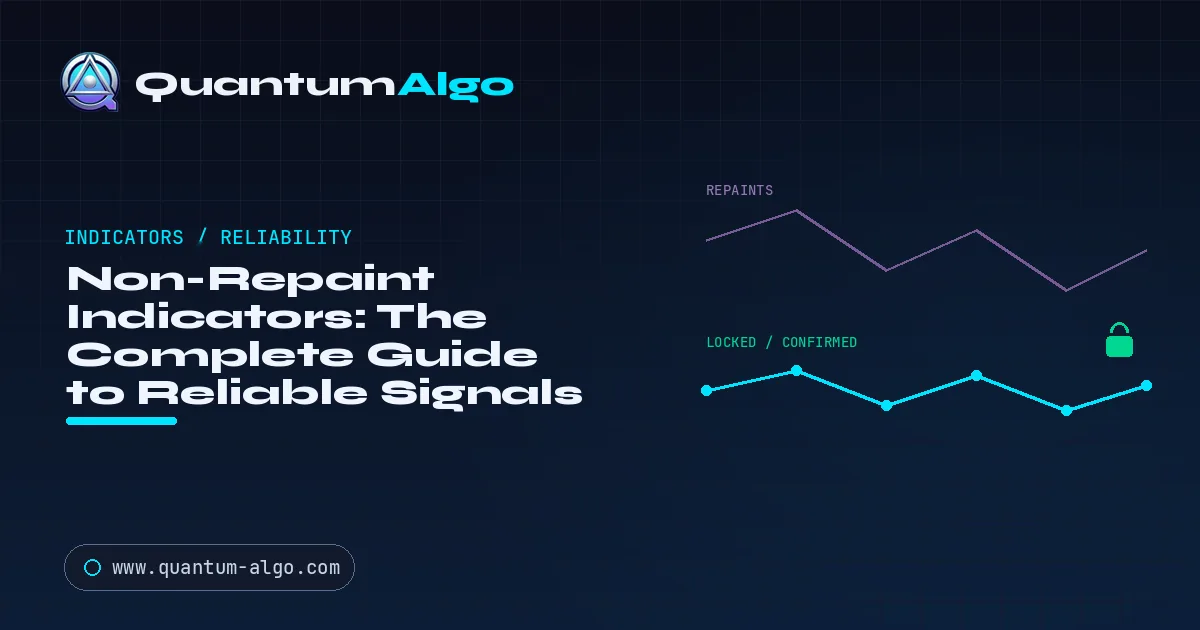
A non-repainting indicator is one whose signals, once printed on a closed bar, never change, move or disappear. A repainting indicator calculates on the still-forming bar and redraws past signals, so its history looks flawless while its live signals vanish. Backtests of repainting tools score hindsight, not a strategy; assume any indicator repaints until you verify it in real time.
Repainting is the quiet reason most traders lose faith in indicators. You find a buy/sell tool with a stunning historical chart, arrows landing at every top and bottom, and you think you have found an edge. Then you trade it live and the signals never seem to work the way the screenshots promised. The problem usually is not you — it is that the indicator repaints, and a non-repainting indicator is what you actually needed all along.
This guide explains exactly what repainting is, why it makes historical charts lie, the different forms it takes, and how to test any indicator so you never get fooled again. Whether you build your own tools or buy them, understanding repainting is the difference between trusting a signal and trusting an illusion.

Automate your trades. Let Quantum Algo trade for you.
Every signal executed on your own account — 24/7, hands-off.
What does it mean when an indicator repaints?
To understand repainting, you have to understand how indicators calculate. An indicator runs a formula on each bar of data. The question is when it locks in its result. A non-repainting indicator waits until a bar is fully closed before it commits a signal, so once that bar is done, the signal is permanent. A repainting indicator calculates on the current, still-forming bar — and because that bar keeps changing until it closes, the signal keeps changing too, sometimes appearing and disappearing several times before the bar is final.
The consequence is subtle but devastating. When you scroll back through history, every bar is already closed, so a repainting indicator shows only its final, hindsight-perfect signals. It looks flawless. But in real time, at the hard right edge of the chart where you actually trade, those signals are unstable — the very arrow you acted on may vanish a minute later.
Repainting versus non-repainting: the same chart, two realities
In history both look clean. In real time, only the non-repainting signal is trustworthy.
How does repainting distort a backtest?
A backtest is only meaningful if it reflects what would have happened in real time. Repainting breaks that assumption completely. Because the indicator draws its signals with full knowledge of how each bar closed, a backtest of a repainting tool is not testing a strategy — it is testing hindsight. The results look extraordinary because the tool effectively knew the future for every bar it evaluated.
Why the backtest and reality diverge
A repainting tool is scored on hindsight-perfect signals. Trade it forward, where the future is unknown, and the edge disappears.
This is why traders get burned: they judge a tool by its historical chart, which is exactly the view a repainting indicator is designed to flatter. The moment they trade it forward, where no future information exists, the edge evaporates. Any performance claim based on a repainting indicator's history is worthless, no matter how impressive the numbers.
What forms can indicator repainting take?
Repainting is not one thing — it comes in several forms, some obvious and some subtle enough to fool experienced traders. Knowing the varieties helps you spot each one.
Signal repainting
The classic form: a buy or sell marker appears on the live bar, then moves to a different bar or disappears once the bar closes. The most directly harmful type because you act on a signal that does not survive.
Line repainting
A drawn line — support, a supply or demand zone, a trend — shifts its historical position as new data arrives, so the level you traded against was never really there at the time.
Backpainting
The indicator plots signals a few bars in the past once a condition confirms, so history looks perfectly timed while live signals always arrive late. Technically not future-leaking, but misleading about timing.
Higher-timeframe repainting
An indicator pulling higher-timeframe data — common in Smart Money Concepts tools — can repaint as that higher bar forms, causing lower-timeframe signals to flicker until the higher bar closes.
How can you test whether an indicator repaints?
You never have to take a seller's word. These methods will expose repainting on any indicator, and they take minutes.
Three ways to catch a repainting indicator
Use any one to expose repainting; use all three to be certain.
Method 1 — watch it live. Put the indicator on a fast timeframe and watch signals form in real time for a session. If an arrow appears on the current bar and then relocates or vanishes when the bar closes, it repaints. Method 2 — bar replay. Use a bar-by-bar replay mode to step through history as if trading live, and compare where signals appear versus where they sit on the finished chart. Discrepancies reveal repainting. Method 3 — the reload check. Note where recent signals are, then refresh the chart. If signals shift position after reload, the tool is recalculating history — a clear repaint.
Why does bar-close confirmation prevent repainting?
Underneath every non-repainting indicator is one principle: act only on confirmed, closed-bar data. In practice, well-built indicators reference the state of a completed bar rather than the live, still-moving one before committing a signal. This single discipline is what guarantees a signal, once printed, will never change — because the data it was based on can never change either.
When a signal locks: bar-by-bar
A non-repainting signal is only committed once the bar that triggered it has fully closed — after that, it never moves.
This is also why non-repainting signals sometimes feel "slower." A non-repainting tool cannot signal until the bar confirming the condition has closed, so you get the signal a little later than a repainting tool appears to — but the repainting tool's earlier signal was never reliable in the first place. A confirmed, slightly later signal you can trust beats an early signal that might disappear. That trade-off — a small delay for genuine reliability — is the entire value proposition of non-repainting indicators.
How do repainting and non-repainting indicators differ?
Seeing the two behaviours contrasted directly makes the choice obvious. The table below summarises how each type behaves across the dimensions that decide whether you can build a real process on it.
| Property | Repainting indicator | Non-repainting indicator |
|---|---|---|
| Historical chart | Looks perfect (hindsight) | Looks realistic, with losers |
| Real-time reliability | Signals can move or vanish | Signals lock at bar close |
| Backtest validity | Meaningless — tests hindsight | Meaningful — reflects live behaviour |
| Signal timing | Appears early, unstable | Slightly later, confirmed |
| Can you build rules on it | No — nothing is fixed | Yes — signals are permanent |
| Track record you can trust | No | Yes, if verified in real time |
There is no scenario in which a repainting indicator is the better choice for actually trading. Its only advantage is looking impressive in marketing — which is precisely why so many tools repaint by design.
How do you choose a non-repainting indicator?
Once you have ruled out repainting, a few practical criteria separate a good non-repainting tool from a merely honest one. Use these when you evaluate any signal indicator you intend to trust with real money.
Transparent logic
The tool should explain the condition behind its signals. If the seller cannot describe when and why a signal fires, you cannot judge it — and it may be hiding repainting behind a black box.
Closed-bar confirmation
Confirm the tool commits signals only on completed bars. This is the mechanical guarantee of non-repainting and the first thing to verify.
Verifiable track record
Prefer tools whose performance is published in real time, so you know signals were called before outcomes were known — not reconstructed afterward.
Honest about losers
A trustworthy non-repainting tool shows losing trades. A flawless record is the signature of the repainting you are trying to avoid.
Why non-repainting matters for real results
Everything about disciplined trading depends on trusting your signals. If you cannot be sure a signal will still be there in a minute, you cannot build rules around it, you cannot backtest it honestly, and you cannot hold a tool accountable. Non-repainting is not a nice-to-have feature — it is the precondition for every other kind of edge. A repainting indicator, however sophisticated, poisons your entire process because it makes your record a fiction. This is why a disciplined trading journal is only as good as the signals feeding it.
This is why serious signal providers — and every quality buy/sell indicator — treat non-repainting as non-negotiable and why a verifiable, real-time track record matters so much: it proves the signals were called before the outcome was known, not drawn in after. When you evaluate any indicator or signal service, the first question is not "how good does the history look" but "were these signals fixed at the time, or filled in afterward." Only the first kind is worth anything.
• Closed-bar logic — Signals commit only on confirmed bars, so they never move or vanish
• No hindsight illusions — Built not to repaint, so your backtests reflect real behaviour
• Verifiable in real time — A public track record proving signals were called before the outcome
◆ Signals that lock and stay locked
Quantum Algo's Smart Money Concepts signals are built on confirmed, closed-bar logic designed not to repaint — and backed by a verified public track record so you can prove the signals were called in real time, not drawn in hindsight.
See the indicator → Verify the track recordFrequently Asked Questions
A non-repainting indicator is one whose signals, once printed on a closed bar, never change, move, or disappear. What you saw in real time is exactly what remains on the historical chart. It is the opposite of a repainting indicator, which redraws its past signals as new data arrives — making it look far better in hindsight than it performed live. Non-repainting is the precondition for trusting a signal and building rules around it.
Repainting is when an indicator recalculates and redraws its signals as new price data arrives, so a marker that appeared on the live bar may move to a different bar or vanish once the bar closes. It is bad because it makes historical charts look flawless while being unreliable in real time — the arrow you acted on may not survive. Any performance claim based on a repainting indicator's history is meaningless.
Use three tests. First, watch it live: put it on a fast timeframe and see whether signals move or vanish as bars close. Second, use bar replay to step through history as if trading live and compare where signals appear versus where they sit on the finished chart. Third, do a reload check: note recent signals, refresh the chart, and see if they shift. Any instability across these tests means the indicator repaints.
Not necessarily more accurate, but far more trustworthy. A non-repainting indicator's historical record reflects what actually happened in real time, so its accuracy — good or bad — is honest. A repainting indicator can look more accurate simply because it draws signals with hindsight. The value of non-repainting is reliability: you can build rules, backtest honestly, and hold the tool accountable, which you cannot do with a repainting one.
A non-repainting indicator waits for the bar that confirms its condition to fully close before committing a signal, because only closed-bar data can never change. This means the signal appears slightly later than a repainting tool's marker, which fires on the still-forming bar. The trade-off is worth it: the repainting tool's earlier signal is unstable and may disappear, while the confirmed signal is one you can actually act on.
There are four main types. Signal repainting is when a buy or sell marker moves or vanishes after appearing. Line repainting is when a drawn level shifts its historical position. Backpainting is when signals are plotted a few bars in the past once confirmed, making history look perfectly timed while live signals arrive late. Higher-timeframe repainting is when an indicator pulling higher-timeframe data flickers until that higher bar closes.
No. Some redrawing is legitimate — for example, an unconfirmed level that honestly updates as price develops, clearly labelled as provisional. The problem is hidden repainting sold as a finished signal. The test is transparency: a trustworthy tool tells you when a signal is provisional rather than pretending every arrow is final. Deceptive repainting is the kind marketed with flawless historical charts and no disclosure.
For discretionary context, a clearly-labelled provisional tool can occasionally help you visualise developing conditions. But for signals you act on, backtests you rely on, or any rule-based process, a repainting indicator is worse than useless because nothing it shows is fixed. If you need to make decisions and hold a tool accountable, you need non-repainting signals.
Because a backtest of a repainting indicator is testing hindsight, not a strategy. The tool draws its signals with full knowledge of how each historical bar closed, so it effectively knew the future for every bar it evaluated. That produces extraordinary-looking results that vanish the moment you trade forward, where no future information exists. This is why historical screenshots of repainting tools should be ignored entirely.
They act only on confirmed, closed-bar data. A well-built non-repainting indicator references the state of a completed bar rather than the live, still-moving one before committing a signal. Because the data behind a closed bar can never change, the signal based on it can never change either. This single discipline — waiting for bar close — is the mechanical guarantee of non-repainting behaviour.
For anything you trade or backtest, yes. Reliability is the foundation of a disciplined process — you cannot build rules on signals that might disappear, nor trust a record that was drawn in hindsight. Judge every indicator by its real-time behaviour, test it for repainting, and trust only signals that lock at bar close. A slightly later signal you can rely on is worth far more than an early one that lies.
Quantum Algo's Smart Money Concepts signals are built on confirmed, closed-bar logic and are designed not to repaint, so a printed signal stays fixed. Just as importantly, performance is published as a verified public track record, which means you can confirm signals were called in real time rather than reconstructed after the fact. That combination — non-repainting logic plus a verifiable record — is what makes the signals accountable.
References & Related Guides
More in this topic
- UT Bot Alerts Best Settings for the Indian Market: Nifty & Bank Nifty on the 5-Minute Chart
- Best Buy/Sell Indicator: How to Choose One That Actually Works
- Best TradingView Indicators
- UT Bot Alerts: Complete Trading Guide
- Supertrend Indicator Guide
- RSI Indicator Guide
- MACD Indicator Guide
- Squeeze Momentum Indicator (TTM Squeeze): Complete Guide
- Range Filter Indicator Guide
- Backtesting Trading Strategy — Complete Validation Guide
- TradingView Backtesting Guide
- Smart Money Concepts (SMC): Ultimate Trading Guide
- Trading Journal: The Complete Guide with AI Insights
- Supply and Demand Trading Guide — Zones, Flips & Strategies
- What Are the Best Indicators for Scalping?
Core reading
- Best TradingView Indicators
- Risk Management in Trading — The Complete Survival Guide
- Backtesting Trading Strategy — Complete Validation Guide
- All Premium Guides
- Public Track Record
- Quantum Algo on TradingView