Sierra Chart Review: Packages, Real Costs and Who It Suits
Sierra Chart is the cheapest serious order-flow platform for futures traders: packages run $26 to $56 a month, up to 35% less when prepaid, plus exchange data fees. It is fast, deep and Windows-only, with a steep learning curve and terse support. Choose Package 11 for footprint charts with a broker connection.
Most Sierra Chart reviews stop at "ugly but powerful." That's true, and it's also the least useful thing you can say about it. The questions that decide whether it's right for you are more specific: which of the five numbered packages includes footprint charts, what CME data really costs with and without a funded account, and whether Sierra Chart's own Denali feed and Teton routing make CQG or Rithmic unnecessary. This Quantum Algo review answers each one with the vendor's current figures, then compares Sierra Chart with NinjaTrader, Quantower, Bookmap and TradingView.
Indicators that prove themselves in public.
One engine, four precision tools — the Gold (XAU) Scalper, the institutional Gravity Zone, the Zeno momentum Oscillator, and Zeno Stocks for equities.
Sierra Chart delivers professional-grade order flow, deep market data and colocated CME routing for less than most rivals charge for charting alone. You pay for it in setup time, a dated interface and support that won't hold your hand. For a futures trader willing to learn it, it's the best value platform we've reviewed.
Pros
- Packages from $26 a month, with up to 35% off when prepaid
- Own Denali feed with up to 1,400 depth levels per side and history back to 2011 for CME tick data
- Teton routing colocated in Aurora with no Sierra per-contract fee
- Complete order-flow toolkit: Numbers Bars, TPO, depth heatmap, market by order
- Delayed data and unlimited simulated trading included in every package
- Fast and light on hardware; ACSIL studies compile to native C++
- Transparent published pricing and licence terms
Cons
- Steep learning curve and an interface that feels decades old
- Confusing package numbering; Base packages can't connect to brokers
- Windows only, no native Mac, mobile or browser version
- About 10 minutes of included support a month; extra support billed at $65 an hour
- Professional or no-account exchange fees can multiply the real cost
- No Tradovate connection
Best for: Futures day traders who read footprints, DOM and volume profile and want low running costs.
Not for: Mac-only users, mobile-first traders, and anyone who wants a polished interface with live support.
Prices and rules checked October 2026.
Who is Sierra Chart actually built for?
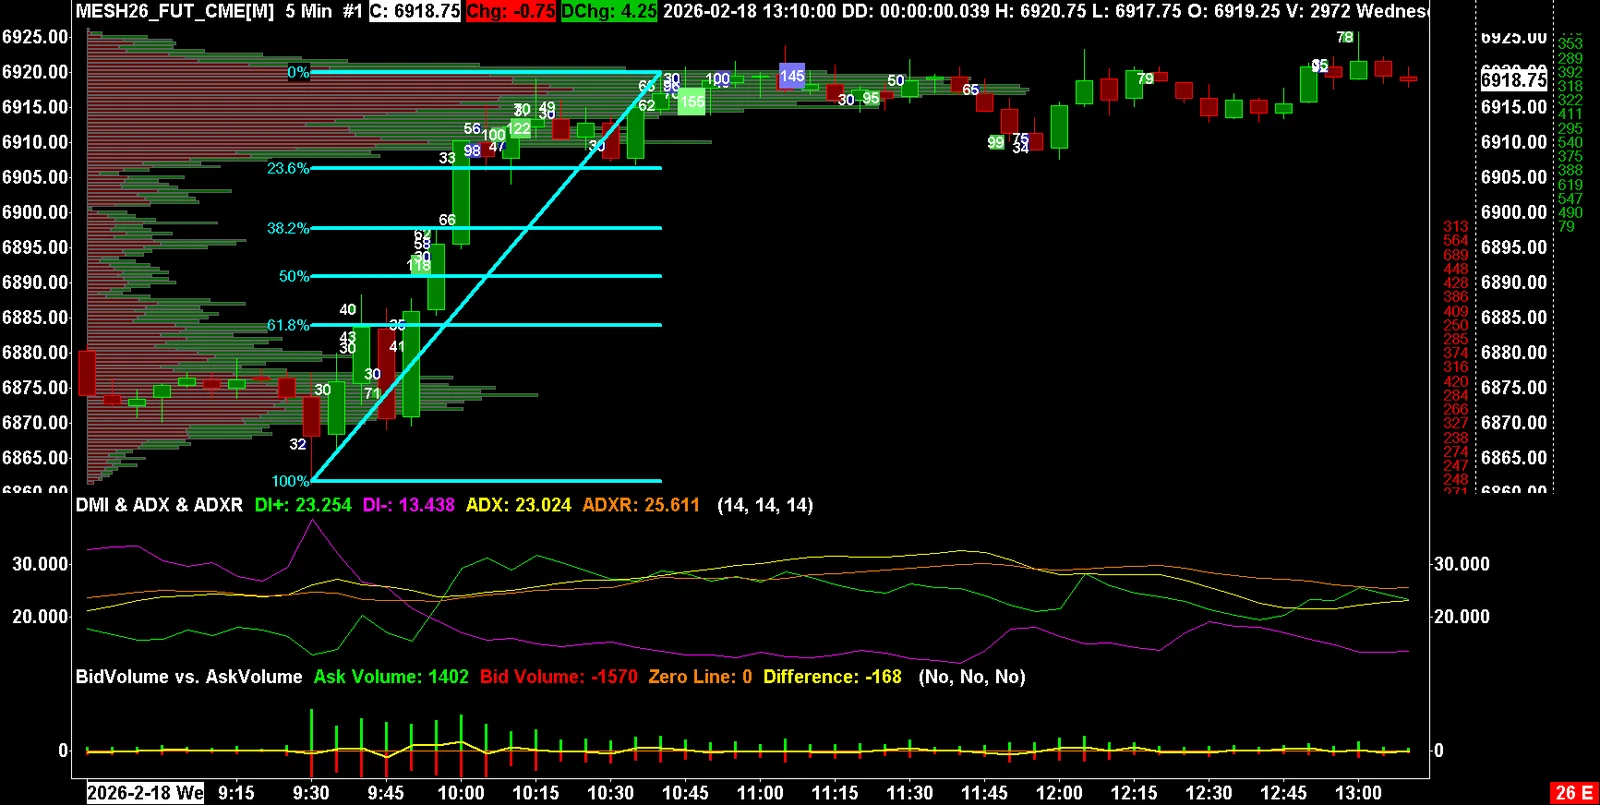
Sierra Chart has been in business since 1996, and it shows. The software is fast, small, and dense with options, and its look hasn't changed much in two decades. That's the deal you sign up for: a desktop platform built for traders who care about tick data, depth of market and execution, and who are willing to read documentation to get it.
Three kinds of trader get the most out of it. The first is the futures day trader who reads order flow on ES, NQ, CL or GC and wants footprint charts and a full market depth ladder without paying three-figure monthly fees. The second is the volume profile and TPO trader who lives inside value areas and session profiles. The third is the programmer who wants to write custom studies and automated systems in C++ and run them close to the metal.
The trader who should probably look elsewhere is someone who mainly swings stocks off daily charts, wants a polished mobile app, or likes building ideas in a browser and sharing them. For that profile the TradingView platform is simpler and cheaper to start. Sierra Chart is Windows-first software with no native mobile app, and its own download page says you need a Windows desktop, laptop or server to run it, with remote access as the mobile workaround.
◆ Prices and rules checked October 2026. Every package price, discount and exchange fee in this review comes from Sierra Chart's own Packages, Denali and Purchase Information pages. Sierra Chart notes that its pricing can change slightly over time without notice, so confirm in your Account Control Panel before you pay.
Which Sierra Chart package do you need?
Sierra Chart sells access as numbered Service Packages, and the numbering confuses almost everyone at first. There are two families. Base packages (3 and 5) only talk to Sierra Chart's own services. Integrated packages (10, 11 and 12) can also connect to external brokers and data services such as CQG, Rithmic and Interactive Brokers, and they are the only ones that support the real-time Denali Exchange Data Feed.
| Package | Name | Monthly | External brokers + Denali | Advanced features |
|---|---|---|---|---|
| 3 | Base Standard | $26 | No | No |
| 5 | Base with Advanced Features | $36 | No | Yes |
| 10 | Integrated Standard | $36 | Yes | No |
| 11 | Integrated with Advanced Features | $46 | Yes | Yes |
| 12 | Integrated, Advanced + Market by Order | $56 | Yes | Yes, plus Market by Order |
"Advanced features" is a specific list, not marketing language. It covers the TPO chart study, Numbers Bars (Sierra Chart's footprint), Numbers Bars Calculated Values, the Market Depth Historical Graph (its heatmap-style view of resting liquidity) and the Volume Profile interactive drawing tool. If footprint or TPO is the reason you're here, Packages 3 and 10 are the wrong buy.
Prepaying cuts the package price, and the discount is generous by software standards:
| Prepay term | Discount | Package 10 per month | Package 11 per month | Package 12 per month |
|---|---|---|---|---|
| 1 month | 0% | $36.00 | $46.00 | $56.00 |
| 3 months | 15% | $30.60 | $39.10 | $47.60 |
| 6 months | 25% | $27.00 | $34.50 | $42.00 |
| 12 months | 35% | $23.40 | $29.90 | $36.40 |
Every package includes the same set of Sierra Chart services: the historical data service, real-time and historical forex/CFD data, the Market Statistics feed, crypto data and trading services, the Delayed Exchange Data Feed (with delayed market depth and market-by-order data) and unlimited server-based simulated trading. That last pair matters more than it sounds. You can learn the whole platform on delayed CME data with a simulated account before paying a cent in exchange fees, which is a better onboarding path than most competitors offer.
The short version
- Package 11 is the default answer for a futures trader who wants footprint, TPO and a broker connection.
- Package 10 fits someone who only needs candles, a DOM and a broker connection.
- Package 12 is worth it only if you will actually use market-by-order data, for example queue position on resting limit orders through Teton.
- Package 5 suits a learner who wants every analysis tool on simulated or Sierra Chart data, with no outside broker.
What does Sierra Chart really cost per month?
The package fee is the smaller half of the bill for most futures traders. Real-time futures data always carries exchange fees, whether it reaches you through a broker feed, an outside data vendor or Denali. Sierra Chart's Denali page lists the current monthly fees, and the gap between non-professional and professional rates is large:
| Denali exchange option | USD / month | Market depth | Funded trading account needed |
|---|---|---|---|
| Full CME Group (CME, CBOT, COMEX, NYMEX) with depth, non-pro | 40.50 | Yes | Yes |
| Full CME Group, top of book only, non-pro | 6.00 | No | Yes |
| CME only with depth, non-pro | 13.50 | Yes | Yes |
| CME only, top of book, non-pro | 2.00 | No | Yes |
| CME, pro or no trading account | 145.00 | Yes | No |
| CME E-mini, pro or no trading account | 78.00 | Yes | No |
| EUREX EOBI | 25.00 | Yes | No |
| NASDAQ TotalView (US stocks) | 17.00 | Yes | No |
The "funded trading account" column is the trap. The cheap non-professional CME rates require a live, funded futures account with a supported broker. A trader running only a prop firm evaluation or no account at all lands on the professional or no-account rows. Sierra Chart's own page is not perfectly consistent here: the table lists $145 per exchange, while a text section elsewhere on the same page quotes $115.50 per exchange and $462 for all four CME Group exchanges. Either way it's an order of magnitude above the $13.50 non-pro rate, so check which bucket you fall into before you plan a budget.
Worked example: three real setups
- ES scalper with depth, paying monthly. Package 11 at $46 plus CME-only with depth at $13.50 = $59.50 a month, or $714 a year.
- Multi-market trader (ES, ZN, GC, CL) prepaying a year. Package 11 on a 12-month prepay is $358.80 up front, which is $29.90 a month. Add the full CME Group bundle with depth at $40.50 and the running cost is $70.40 a month, or $844.80 a year. Pay monthly instead and the same setup is $86.50 a month and $1,038 a year, so the prepay saves $193.20.
- Chart-only trader without a funded account. Package 11 monthly at $46 plus CME E-mini professional/no-account data at $78 = $124 a month. That's more than double setup 1 for less data, purely because of account status.
Two smaller rules affect the math. Exchange fees are billed for the full month regardless of the day you activate, and they are never refunded. CME Group exchanges do come with a free first-month trial on Denali, so time your first activation for the start of a calendar month. The calculator below runs these numbers for your own mix.
Denali and Teton: Sierra Chart's own data and order routing
For years Sierra Chart users needed an outside feed such as CQG or Rithmic to trade futures. Sierra Chart now runs its own pipeline end to end, and it's the main reason the platform has pulled ahead on price.
Denali Exchange Data Feed
Denali delivers real-time and historical data for CME, CBOT, NYMEX, COMEX, EUREX and CFE futures, NASDAQ TotalView and the US consolidated tape for stocks, and CBOE global indexes. Sierra Chart says it provides up to 1,400 levels of market depth per side for all exchanges, which is far beyond the 10 levels many retail feeds show. Its history is deep too: CME tick-by-tick data for popular futures goes back to 2011, and 1-minute data to June 2008. Denali only works on Packages 10, 11 and 12, and exchange-based data runs on one computer at a time unless you pay extra exchange fees.
Teton Futures Order Routing
Teton is Sierra Chart's direct order routing for CME, CBOT, NYMEX and COMEX futures and spreads, with server-side OCO and bracket orders. Sierra Chart states its CME routing servers sit in Aurora, Illinois, colocated with the CME matching engines, and describes round-trip internal processing of roughly 500 microseconds, while giving no guarantee of the latency you'll see. There's no per-contract fee from Sierra Chart; you still pay exchange fees and your clearing firm's commissions. Futures options can't be traded through Teton.
To use it you need a live account with a supported firm. The list on Sierra Chart's Teton page includes AMP Futures, Optimus Futures, Ironbeam, Edge Clear, Stage 5 Trading, Discount Trading, DeepDiscountTrading, Trade Pro Futures, AGN Futures, Canon Trading, Sweet Futures, Lincoln Park Financial, Plus500 Financial Services, Advantage Futures, Dorman Trading, Phillip Capital and Marex. Teton cannot be used during the free trial.
▲ Package fine print. The Teton page says routing works with any Service Package, including Base packages. But Teton takes its real-time data from Denali, and the Packages page limits Denali to Packages 10 to 12. In practice, plan on an Integrated package and confirm with Sierra Chart support before you buy a Base package for live trading.
If you're weighing Sierra's own stack against the two classic futures connections, our Rithmic vs Tradovate comparison explains how third-party routing works and why some prop firms only support one of them.
Which brokers and data feeds connect to Sierra Chart?
Beyond its own services, Sierra Chart's supported services page lists these external connections, all of which require an Integrated package:
- CQG and Rithmic for futures trading and data. These two are how most prop firm accounts reach Sierra Chart.
- Interactive Brokers for multi-asset trading and data.
- LMAX for forex trading.
- DTN IQFeed and Global Data Feeds India as data-only vendors.
- DTC Protocol, Sierra Chart's open data and trading protocol, which other software can use to connect in or out.
Notably absent from the current list: Tradovate. If your broker or prop firm is Tradovate-only, Sierra Chart is not a fit for that account, and a platform like the one in our Tradovate review or NinjaTrader is the more natural path.
For funded-account traders the question to ask the firm is simple: do you offer a Rithmic or CQG login, and do you allow Sierra Chart? Firms change their platform lists often, so we keep a running view in our guides to prop firms that use TradingView the Topstep review and our Earn2Trade review. Also ask which market data agreement you sign, because that decides whether you pay non-professional or professional exchange fees.
Footprint, DOM and market depth: how good are the order-flow tools?
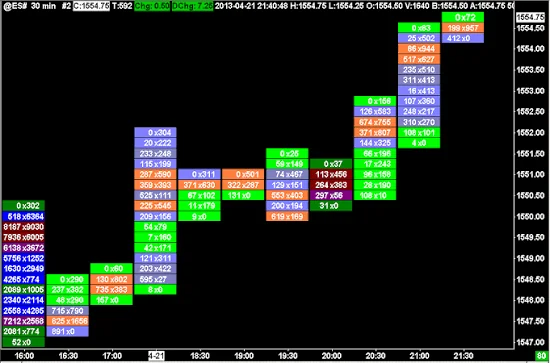
This is where Sierra Chart earns its reputation. The tools are not pretty, but they are complete and they run quickly on tick data.
Numbers Bars (footprint)
Numbers Bars replace candles with up to three columns of numbers per price level. Each column can show bid volume x ask volume, ask minus bid (delta at price), total volume, number of trades, the dominant side's percentage, or diagonal comparisons between adjacent levels, with highlight options for the point of control, maximum values and equal bid/ask prints. Sierra Chart's documentation recommends 1-tick intraday data for accurate values and notes the study only works on intraday charts. If footprints are new to you, our footprint chart trading guide explains how to read imbalances and absorption, and the delta divergence guide covers one of the most common setups traders build on these columns.
Chart DOM and trade DOM
Market depth can sit on the right edge of any chart or in a dedicated trading DOM, with columns for recent bid/ask volume, pulling and stacking, and your working orders. With Denali's depth of up to 1,400 levels you can see far more of the book than the usual 10-level ladder. Our guide to reading Level 2 covers the basics of interpreting a ladder before you add these extras.
Market Depth Historical Graph and Market by Order
The Market Depth Historical Graph plots resting liquidity over time as a heatmap behind price, similar in spirit to the core view in the Bookmap review. It's an Advanced feature (Packages 5, 11 and 12). Market by Order, which shows individual orders at each level instead of aggregate size, is a Package 12 feature, and Teton uses it to show queue position for your limit orders.
Add cumulative delta, volume profiles, VWAP with bands and TPO charts, and Sierra Chart covers the full order-flow toolkit. The gap is presentation: you'll spend real time configuring colours and columns to make these readable. Traders who prefer a curated look out of the box usually end up in Bookmap or Quantower for that reason.
Custom studies with ACSIL: is C++ a dealbreaker?
Sierra Chart's programming interface is ACSIL, the Advanced Custom Study Interface and Language. It's C++, compiled into a DLL that Sierra Chart loads directly. Sierra Chart ships its own editor and build system, and you can also use Microsoft Visual C++. You can build studies, custom bar types and automated trading systems, backtest them, and send orders to supported trading services.
The practical upside is speed and control. A compiled C++ study runs at native speed on every tick, which matters when you're processing market-by-order data or scanning dozens of symbols. Developers can also sell or share studies through Sierra Chart's control panel, limiting access to named users with expiry dates.
The downside is obvious if you've only written Pine Script. C++ is less forgiving, and Sierra Chart says plainly that it does not provide programming help beyond basic technical questions on its Support Board. A 30-line Pine indicator can become 120 lines of ACSIL with explicit array handling. For most discretionary traders the large built-in study library is enough, and third-party ACSIL developers cover the rest. Sierra Chart also offers Spreadsheet studies and systems for people who would rather work with formulas than code.
If you prototype ideas in Pine first, our free algorithmic trading course walks through the logic side, which transfers cleanly even when the syntax doesn't.
Learning curve, support and the account rules nobody reads
Expect the first week to be frustrating. Menus are deep, settings live in chart-level and global dialogs, and the interface assumes you know what a chartbook or a study collection is. The trade-off is that almost everything can be changed. Most traders get productive once they build one chartbook with their charts, DOM and studies and save it.
How support works
Sierra Chart runs a public Support Board and support tickets rather than live chat. Its purchase terms say paying users get a reasonable amount of support for basic use and external connections, generally about 10 minutes per user per month. Anything beyond that can be billed at $65 an hour, with notice in advance, and phone support is usually chargeable. Trial users only get help with account, pricing and basic questions. Answers tend to be accurate and short, sometimes blunt. If you want hand-holding, this is the wrong vendor.
Billing, refunds and licences
- Prepaid balance. You add credit to a services balance, and the package renews automatically only if the balance covers the full selected term. Denali is cancelled if the balance runs short and has to be reactivated by hand.
- Refunds. Usage time is refunded only in whole 31-day blocks, minus a $5 processing fee, with no refunds under $10 and none on exchange fees.
- Machines. You can install on unlimited computers. By default one account runs on 2 systems at once, or 3 depending on the package. Exchange data runs on one system unless you pay extra fees.
- When access lapses. Sierra Chart drops to Free Mode: you can still open charts, use studies and drawing tools and develop studies, but it won't connect to external services and advanced features are restricted.
System requirements
Sierra Chart is 64-bit only and supports Windows 7, 8, 10 and 11 plus Windows Server versions. Its recommended hardware is 16 GB of RAM, at least a 4-core CPU and an SSD. There's no native macOS or Linux build. Mac users run it through CrossOver or Wine, and Sierra Chart provides an ARM64 build for Apple M-series machines running Windows. The program is light, though; it runs comfortably on hardware that struggles with heavier platforms.
Sierra Chart vs NinjaTrader, Quantower, Bookmap and TradingView
Each of these platforms wins for a different trader. This table sticks to what we could verify on each vendor's pricing page, plus our own reviews for the details.
| Platform | Price model | Order-flow tools | Scripting | Strongest for |
|---|---|---|---|---|
| Sierra Chart | $26 to $56/mo, up to 35% off prepaid; exchange fees extra | Footprint, TPO, depth heatmap, MBO (Pkg 12) | ACSIL (C++) | Cheapest serious order flow, fast execution |
| NinjaTrader | Free, $99/mo or $1,499 lifetime; commissions vary by plan | Order Flow+ comes with a funded live account | NinjaScript (C#) | Broker-plus-platform bundle, big add-on market |
| Quantower | Limited free plan; All-in-One licence listed at 70 per month | Volume analysis, DOM Surface, power trades | C# API | Modern UI across many brokers and crypto |
| Bookmap | Tiered subscriptions (see review) | Liquidity heatmap is the core product | Add-on API | Visualising the order book in motion |
| TradingView | Free Basic; paid plans $12.95 to $199.95/mo billed yearly | Volume footprint on paid plans, no full-depth DOM | Pine Script | Charting, alerts, multi-asset ideas, browser and mobile |
The honest read: Sierra Chart beats all four on cost per unit of order-flow capability, and it's the only one here that runs its own colocated CME routing. NinjaTrader wins if you want the broker and platform in one account and a huge marketplace of add-ons. Quantower is the friendlier modern interface. Bookmap is the specialist for watching liquidity move. TradingView remains the best general charting tool and the easiest place to build and share indicators, which is why many futures traders run TradingView for analysis and Sierra Chart for execution side by side. Our best futures trading platform roundup ranks them by trader type.
Mistakes that cost new Sierra Chart users money
- Buying Package 3 or 10 for footprints. Numbers Bars and TPO are Advanced features. Neither package has them.
- Buying a Base package to trade with a broker. Packages 3 and 5 can't connect to CQG, Rithmic or Interactive Brokers, and they don't support Denali.
- Assuming non-pro data rates on a prop evaluation. The $2 to $40.50 CME rates need a funded account with a supported broker. Without one, the CME E-mini row alone is $78 a month.
- Activating Denali mid-month. Exchange fees bill for the full month whatever the activation date, and they're never refunded.
- Letting the balance run low. If your services balance can't cover the renewal, the package doesn't renew and Denali is cancelled, which you find out at the open.
- Loading too much tick history. Numbers Bars on 1-tick data across months of history can slow chart loading. Sierra Chart's own tip is a small Days To Load value, such as 7, for footprint charts.
- Skipping the delayed-data phase. Every package includes delayed exchange data and unlimited simulated trading. Use them to build your chartbook before paying exchange fees. Our paper trading guide covers how to make sim practice count.
How to start: the trial and what to check first
Sierra Chart gives new accounts a 21-day trial with all software functionality available. Intraday charts load 10 days of data and daily charts 186 days during the trial, and both limits go away on a paid package. The trial includes Sierra Chart's own data services (delayed exchange data, forex/CFD, historical, market statistics and crypto) and its simulated trading. External services such as CQG, Rithmic and Interactive Brokers, and Teton routing, are not available on the trial.
A sensible first three weeks looks like this:
- Install and update. Install to the default C:\SierraChart folder (it can't go in Program Files) and use Fast Update for new versions. Antivirus tools sometimes flag the installer; Sierra Chart says these are false positives.
- Build one chartbook. One price chart, one footprint chart on 1-tick data, one DOM, saved together. Resist the urge to build ten layouts.
- Trade the simulator on delayed data. Practise bracket orders and OCO behaviour until the hotkeys feel automatic.
- Price your real setup. Use the calculator below with your package, prepay term and the exact Denali rows you need.
- Confirm your connection. Ask your broker or prop firm whether you'll use Teton, CQG or Rithmic, and which data agreement applies.
Pick the package last. By the end of the trial you'll know whether you actually use Numbers Bars and the depth graph, which decides between Package 10 and 11.
Sierra Chart and Quantum Algo
Sierra Chart and TradingView do different jobs, and plenty of futures traders keep both open. Sierra Chart handles the microstructure: the footprint, the ladder, the fills. TradingView handles the bigger picture: higher-timeframe structure, alerts, and indicators you can tweak in Pine.
That split is where Quantum Algo fits. Our Zeno suite runs on TradingView and gives buy and sell signals with built-in stops and targets; Zeno Stocks covers NAS100 and SPX500 and Zeno Gold covers XAUUSD across timeframes. A common workflow is to let Zeno flag the setup on TradingView, then use Sierra Chart's Numbers Bars and DOM to judge whether the order flow agrees before you click. Index futures traders often add a market-internals check such as the NYSE TICK index to the same routine. You can check how the signals have performed on the public track record.
If you want free tools for the analysis side, the QuantumAlgo Institutional Volume Profile and Anchored VWAP Engine mirror two of the most-used Sierra Chart studies on TradingView, which makes cross-checking levels between the two platforms simple. The free Academy covers the order-flow basics if you're new to reading footprints.
◆ Interactive check
How well do you know Sierra Chart?
Questions traders ask about Sierra Chart
Service packages cost $26 (Package 3), $36 (5 and 10), $46 (11) and $56 (12) a month. Prepaying 3, 6 or 12 months cuts that by 15%, 25% or 35%. Real-time futures data adds exchange fees, from $2 to $40.50 a month for non-professional CME Group data with a funded account.
No. There's a 21-day trial with full software features, and when a paid package lapses the program runs in a limited Free Mode that can open charts and use studies but cannot connect to external data or trading services.
Numbers Bars, Sierra Chart's footprint, is an Advanced feature included in Packages 5, 11 and 12. Package 11 is the usual pick because it also connects to brokers and the Denali feed.
Denali is Sierra Chart's own real-time and historical exchange data feed for CME Group, EUREX, CFE, US stocks and CBOE indexes, with up to 1,400 levels of depth per side. It requires Package 10, 11 or 12 plus exchange fees.
Teton is Sierra Chart's own order routing for CME, CBOT, NYMEX and COMEX futures, with servers colocated near the CME matching engines. You need a live account with a supported firm such as AMP Futures, Optimus Futures, Ironbeam or Edge Clear.
Not natively. Sierra Chart is 64-bit Windows software. Its download page describes running it on a Mac through CrossOver or Wine, and it offers an ARM64 build for Apple M-series machines running Windows.
Often yes, through a Rithmic or CQG login if the firm allows Sierra Chart. Tradovate-only firms won't work. Check which data agreement you sign, since evaluation accounts can fall under professional exchange fees. See our Topstep review for one example.
For order flow per dollar and execution speed, Sierra Chart usually wins. NinjaTrader is easier to start with, bundles a brokerage, and has a larger add-on market. Our NinjaTrader review covers its plans.
Custom studies and trading systems are written in ACSIL, which is C++. Sierra Chart includes its own editor and build system, and Visual C++ also works. Spreadsheet-based studies are an option for non-programmers.
Only on unused usage time in whole 31-day blocks, minus a $5 processing fee, with no refunds under $10. Exchange fees are never refunded.
References & Related Guides
Read next
- NinjaTrader Review
- Quantower Review
- Bookmap Review
- Best Futures Trading Platforms and Futures Prop Firms
- Footprint Chart Trading
- Rithmic vs Tradovate
- TradingView
- Tradovate Review
- Prop Firms That Use TradingView
- Topstep Review
- Free TradingView indicators
- Zeno — the premium engine
Primary sources
- Sierra Chart — Service Packages and Pricing
- Sierra Chart — Denali Exchange Data Feed
- Sierra Chart — Teton Futures Order Routing
- Sierra Chart — Supported Data and Trading Services
- Sierra Chart — License, Purchase and Refund Information
- Sierra Chart — Software Download and System Requirements
- Sierra Chart — Numbers Bars
- Sierra Chart — What Is Included in the Free Trial