Delta Divergence: When Price and Order Flow Disagree
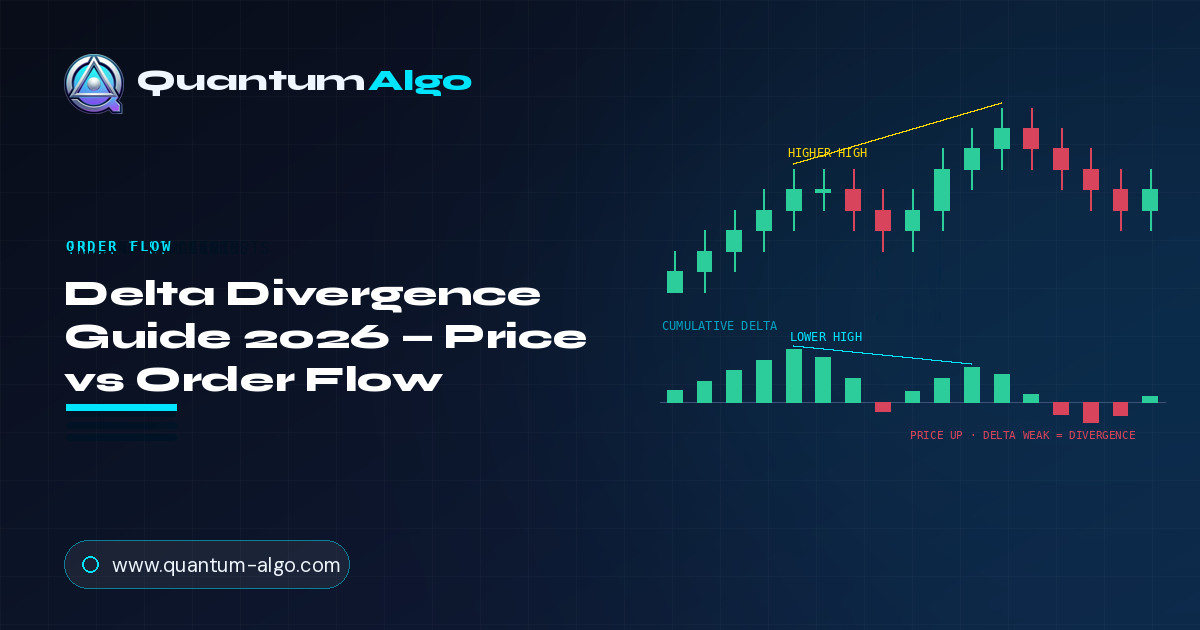
| Signal type | Order-flow reversal / exhaustion |
| Directional bias | Contrarian — fades the current move |
| Built from | Price vs cumulative volume delta (CVD) |
| Best context | At a tested level after an extended move |
| Confirmation | Market structure break in the divergence direction |
| Invalidation | Price + delta both make a new extreme together |
1. What Is Delta Divergence?
Delta divergence is the disagreement between what price is doing and what the underlying order flow is doing. Price makes a new high; the buying pressure behind it does not. Price makes a new low; the selling pressure behind it dries up. That gap between the move and the force driving it is the divergence — and it is one of the earliest warnings that a trend is running on fumes.
To understand it you first have to understand delta. Delta is the net of aggressive buying versus aggressive selling over a period: the volume that traded at the ask (buyers lifting offers, i.e. market buys) minus the volume that traded at the bid (sellers hitting bids, i.e. market sells). Positive delta means aggressors were net buyers. Negative delta means aggressors were net sellers. It is a direct measure of who was pushing, not merely who was present.
Ordinary volume cannot tell you this. A candle can trade a million contracts and close flat — you have no idea whether that was a fight buyers won, a fight sellers won, or a stalemate. Delta separates the two sides of that million. When you accumulate delta bar after bar you get cumulative volume delta (CVD): a running line that rises when aggressive buyers dominate and falls when aggressive sellers dominate. CVD is the curve delta divergence is usually read against, and it has its own complete guide.
The logic is intuitive once you see it. A durable trend needs fresh aggression to keep going — each new high needs new buyers willing to pay up, each new low needs new sellers willing to sell down. When price extends but delta refuses to follow, the new extreme is being made by fewer and weaker aggressors. Someone is still pushing price, but the crowd behind them has thinned. That is the signature of exhaustion, and it usually shows up in the order flow before it shows up in price.
2. The Two Types — Bullish and Bearish
There are exactly two forms, and they are mirror images. Learn to see both and you have the whole pattern.
Bearish delta divergence
Price makes a higher high, but cumulative delta makes a lower high. Buyers pushed price to a new peak, but with less aggressive buying than the previous peak. The rally is thinning. This is a warning that upside is exhausting and a top may be forming — it appears near local highs, at the end of an up-move.
Bullish delta divergence
Price makes a lower low, but cumulative delta makes a higher low. Price fell to a new low, but with less aggressive selling than the previous low. The decline is thinning. This is a warning that downside is exhausting and a bottom may be forming — it appears near local lows, at the end of a down-move.
The chart below shows both on a single BTCUSDT sequence — which is exactly why it is worth studying. Delta divergence is not a rare curiosity you wait weeks for; on an active instrument, both forms appear regularly, and the discipline is telling the real ones from the noise.
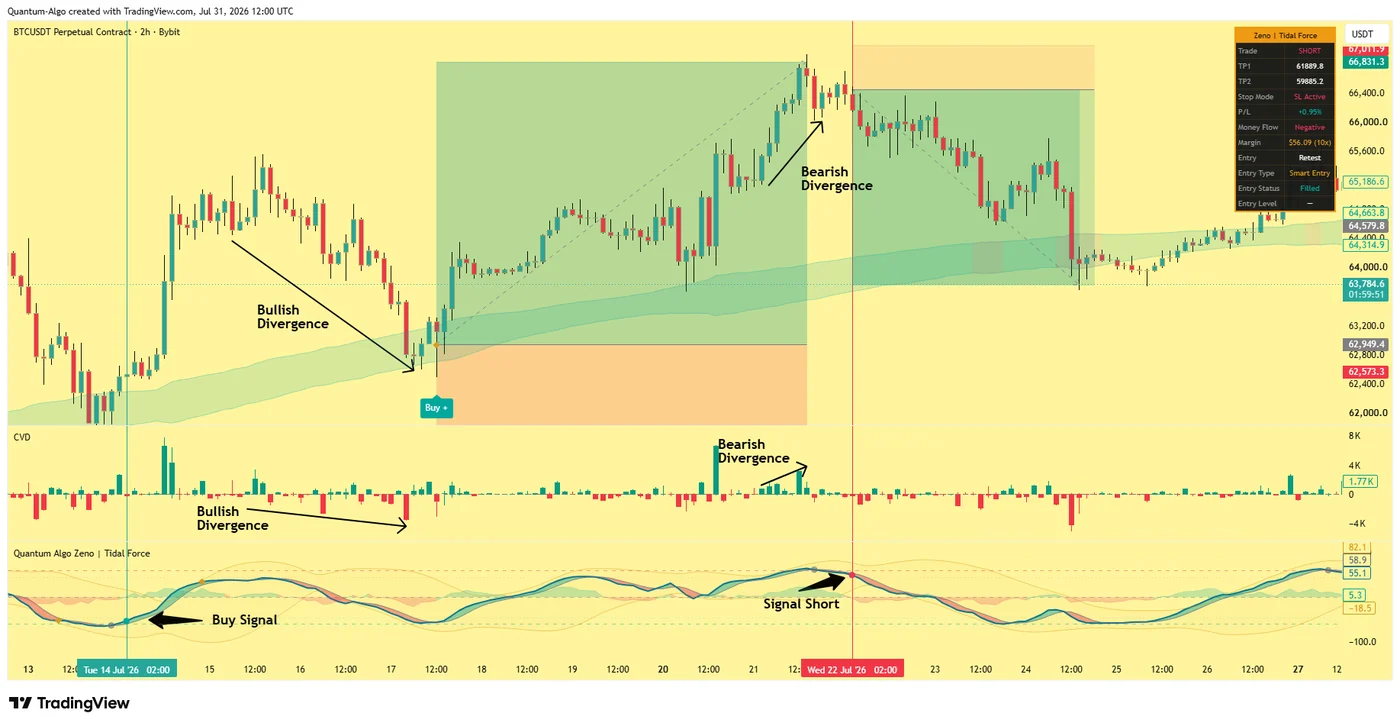
Two things in that chart are worth naming explicitly, because they are the whole edge of the pattern.
First, the divergence led the turn in both cases. On the left, CVD stopped making new lows while price was still dropping — the buying pressure returned before the price bottom was in. On the right, CVD peaked and rolled over while price was still grinding higher — the aggressive buying left before the price top. In both cases, order flow moved first. That lead time is the reason traders watch delta at all.
Second, the divergence did not fire in isolation. Each one resolved at a meaningful level and was followed by a signal — not taken the instant the two lines disagreed. That is the single most important discipline in the entire pattern, and section 4 is devoted to it.
3. Reading Divergence Against CVD, Delta Bars and Footprint
"Delta divergence" is a single idea you can read on three different displays, each showing more or less detail. Knowing which one you are looking at — and its limits — stops you from over-trusting the signal.
CVD line divergence
The most common and the cleanest. A cumulative delta line in a lower panel, compared swing-for-swing against price. You are looking for price highs/lows that the CVD line fails to match. Best for spotting divergence at swing points on the timeframe you trade — it is the version shown in the chart above.
Per-bar delta divergence
Instead of a cumulative line, each candle shows its own net delta as a histogram bar. Divergence here means a candle making a new price extreme while its individual delta bar shrinks or flips against the move. Faster and noisier — useful for scalpers, prone to false positives on higher timeframes.
Footprint / delta-at-price
The highest-resolution view. A footprint chart shows delta at every individual price level inside each candle, exposing exactly where absorption happened. This is where divergence becomes surgical — but it demands dedicated software and a trained eye.
Absorption — the mechanism underneath every divergence
Delta divergence and absorption are the same event seen from two angles. Absorption is what happens when aggressive orders on one side keep hitting the market but price refuses to move — because passive limit orders on the other side are soaking up every one of them. Aggressive buyers keep lifting offers; a large resting seller keeps refilling; price stalls despite heavy buying.
That is precisely the condition that produces a bearish divergence. Delta stays positive (buyers are aggressive) but price stops advancing (a bigger passive seller is absorbing them). When the aggressive side finally gives up and no fresh buyers arrive, there is nothing left to hold price up, and it reverses. The divergence is the footprint of a large passive participant winning a fight the tape says the aggressors were "winning."
4. How to Trade Delta Divergence — The Confirmation Rule
Here is the hard truth that separates traders who make money with delta divergence from those who get chopped to pieces by it: a divergence on its own is not a trade. It is a reason to pay attention, not a reason to click. Divergences appear constantly, and plenty of them resolve by price simply carrying on in the original direction while delta catches up. Trading every divergence is a fast way to fight strong trends and lose.
What turns a divergence into a setup is a four-part sequence. All four should be present before you commit capital.
Location
The divergence must occur at a level that matters — a prior swing high or low, an order block, a fair value gap, a value-area edge, or a liquidity pool. A divergence in the middle of nowhere has no wall for the reversal to lean on. Both divergences in the section-2 chart formed at tested levels, not in open space.
Extension
The move into the divergence should be extended — a decent run, not a two-candle wiggle. Exhaustion signals mean the most after a trend has already spent its energy. A divergence at the start of a fresh move is far weaker than one after an extended push.
Confirmation
Wait for a market structure break in the divergence's direction — a break of the last minor swing that says the balance has actually shifted. This is the trigger. The divergence tells you the fuel is gone; the structure break tells you the vehicle has changed direction.
Invalidation
Your stop goes beyond the extreme that produced the divergence. If price makes a genuine new high (for a bearish setup) with delta confirming it, the divergence has failed and you are wrong — exit. Divergences that resolve into continuation are a normal cost of the strategy, not a reason to widen the stop.
Notice how much of this is not about delta. Location, extension, structure and invalidation are all standard price-action discipline. Delta divergence does not replace that discipline — it sharpens it, by adding an order-flow reason to expect the reversal you were already watching the level for. Traders who treat the divergence as a standalone signal are skipping three-quarters of the setup.
Why waiting for confirmation is not optional
The temptation is always to front-run the structure break — to short the higher high the moment delta diverges, capturing a better price. Occasionally that works. More often, price grinds higher for another few bars while delta stays diverged, stopping out the early short before the reversal ever comes. Absorption can last far longer than it seems it should, because the passive participant doing the absorbing has more size and more patience than you do.
The structure break is what tells you the absorption has actually won — that the aggressive side has given up and price is now moving because of the exhaustion rather than in spite of it. Giving up a few ticks of entry to get that confirmation is the trade-off that keeps you on the right side of the pattern's failure mode.
Spot the divergence
Price on top, cumulative delta beneath. Click the swing where price and delta disagree — where price makes a new extreme that delta refuses to match.

Automate your trades. Let Quantum Algo trade for you.
Every signal executed on your own account — 24/7, hands-off.
5. The Mistakes That Turn Delta Divergence Into a Losing Tool
Delta divergence has a reputation among newer traders for being unreliable. It isn't — but it is easy to misuse, and every one of the following mistakes converts a genuine edge into a coin flip.
Mistake 1 — Trading the divergence, not the reversal
Covered above, and worth repeating because it is the most expensive one. The divergence is a condition, not a trigger. Entering on the divergence alone means entering while the original trend is still technically in control. Wait for the structure break.
Mistake 2 — Ignoring the higher timeframe
A bearish divergence on the 5-minute chart in the middle of a raging daily uptrend is not a short — it is a pause. Delta divergence works best with the higher-timeframe context, not against it. Use it to time entries in the direction of the bigger trend, or to fade genuinely extended moves at major levels, but do not use a low-timeframe divergence to pick a top against a dominant trend.
Mistake 3 — Trusting delta on illiquid instruments
Delta is only as good as the trade classification behind it. On thin instruments — low-volume altcoin perps, exotic pairs — the bid/ask assignment is noisy and the resulting delta is unreliable. The pattern belongs on liquid markets: BTC and ETH perps, major index futures like ES and NQ, high-volume forex. On anything thinner, the divergences you see are as likely to be measurement error as real order flow.
Mistake 4 — Confusing exchange delta with real delta
Single-exchange CVD reflects flow on that venue only. On fragmented markets like crypto, one exchange's delta can diverge from the aggregate simply because of where a large participant chose to execute — not because the market as a whole is diverging. Aggregated delta across venues is the more reliable read, exactly as with funding and open interest.
Mistake 5 — Forgetting that spot and perp delta differ
Spot CVD and perpetual CVD can diverge from each other, and that divergence is information in its own right — it often reveals whether a move is being driven by leveraged derivatives positioning or by real spot demand. But it also means you must know which instrument's delta you are reading before you draw conclusions from it.
| Divergence quality | Weak / skip | Strong / actionable |
|---|---|---|
| Location | Mid-range, no level | At a tested swing / order block / value edge |
| Prior move | Just started | Extended and stretched |
| Timeframe context | Against a strong HTF trend | With HTF trend or at a major level |
| Instrument | Thin altcoin / exotic | BTC, ETH, ES, NQ, major FX |
| Trigger | Entered on divergence alone | Confirmed by structure break |
6. Four Ways to Use Delta Divergence in a Strategy
Delta divergence is a component, not a complete system — but it slots into several proven approaches. Here are four, arranged from most conservative to most aggressive.
1 — Reversal at a level (the core setup)
The bread-and-butter application, and the one the section-2 chart demonstrates. You are already watching a significant level — a prior high, an order block, a value-area edge. Price reaches it after an extended move, delta diverges, and a structure break confirms. You enter in the divergence's direction with a stop beyond the extreme. This is the highest-probability version because every element of the confirmation rule is satisfied by construction.
2 — Exhaustion exit
Even if you never enter on a divergence, you can use it to exit. A bearish divergence forming while you are long is an early warning to tighten your stop, take partial profit, or trail more aggressively — well before price confirms the top. Used purely defensively like this, delta divergence has almost no downside: at worst you leave a little on the table; at best you sidestep the reversal. Many order-flow traders use it this way more than as an entry trigger.
3 — Trend pullback timing
In an established uptrend, a bullish divergence forming into a pullback low is a high-quality signal to re-enter long in the direction of the trend. Here the divergence is not fighting the trend — it is timing an entry within it, catching the moment selling pressure exhausts at the bottom of a dip. This is arguably the safest way to use divergence, because the higher-timeframe context is on your side.
4 — Spot-vs-perp delta divergence
The advanced application. When spot CVD and perpetual CVD diverge from each other, it reveals the character of a move: a rally on strong perp delta but weak spot delta is leverage-driven and fragile; a rally on strong spot delta is real demand and more durable. This is a read on who is driving price rather than a direct entry signal, and it pairs naturally with funding rate analysis for a full picture of derivatives positioning.
7. Setting Up Delta Divergence on TradingView
You need two things on the chart: price, and a measure of delta beneath it. How much detail you get depends on your data.
The CVD line is the practical starting point and the version most traders use. TradingView offers cumulative volume delta as an indicator you can drop into a lower panel; plotted underneath the perpetual chart, it gives you exactly the swing-for-swing comparison shown in the section-2 chart. It is available on standard plans and needs no special data feed for major instruments.
Per-bar delta is the same information shown as a histogram of each candle's individual net delta rather than a cumulative line — useful when you want to see a single bar's flow flip against the move.
True footprint and delta-at-price require dedicated order-flow software and a data feed that provides tick-level bid/ask classification. This is where divergence becomes surgical, but it is a step up in cost and complexity that most traders do not need to begin.
Chart the perpetual
Analyse delta on the same instrument the flow belongs to. For crypto, chart the perpetual contract (e.g. BTCUSDT.P) so price and CVD refer to the same order book — mixing spot price with perp delta muddies the comparison.
Match timeframe to intent
Higher timeframes (2H, 4H) produce fewer but higher-quality divergences suited to swing entries; lower timeframes produce many more, most of them noise, suited only to experienced scalpers. The 2H used in the example chart is a good balance for most.
Mark your levels first
Draw your swing highs/lows, order blocks and value edges before you look for divergence. The whole confirmation rule depends on the divergence occurring at a level — if you find the level after the divergence, you'll rationalise a weak one into looking strong.
Prefer aggregated delta
Where available, aggregated CVD across venues is more reliable than a single exchange's. On fragmented crypto markets especially, one venue's delta can diverge from the market for reasons that have nothing to do with genuine order flow.
One backtesting caution carries over from any order-flow work: historical tick data is expensive, often incomplete, and delta reconstructed from lower-resolution data can differ materially from the real thing. If a strategy's edge depends on precise delta, validate it on the same data resolution you will trade — not on an approximation.
8. Test Your Knowledge
Seven questions covering delta, divergence types, and the confirmation rule.
9. Combine Delta Divergence With Smart Money Concepts
Delta divergence tells you the aggression behind a move is fading. Smart Money Concepts tell you where that fade is most likely to matter and when it has actually turned. They are two halves of the same read, which is why the confirmation rule in section 4 is built almost entirely from SMC ideas.
The confluence is direct. A bearish divergence forming exactly where price sweeps a pool of buy-side liquidity above a swing high, followed by a change of character to the downside, is the same event described in two languages: order flow says the buyers exhausted; structure says the market turned. Neither alone is the trade. Together they are.
• Buy/sell signals with built-in SL and TP — structural entries with risk defined before you click, exactly the buy and short signals in the section-2 chart
• Tidal Force momentum confirmation — reads the same exhaustion delta divergence flags, on your chart
• Market structure mapping — BOS and CHoCH marking the structure break that confirms a divergence
• Order block and FVG detection — the levels a divergence needs to lean on
• Multi-timeframe confluence scoring — so a low-timeframe divergence is checked against the trend that matters
• ATR-based risk management — stops placed beyond the divergence's extreme, sized to volatility
The pairing to internalise: never trade a divergence in isolation, and never ignore one against your open position. The first is how you get run over by an absorbing seller with more patience than you. The second is how you give back a winning trade you had every reason to protect.
Frequently Asked Questions
Delta divergence is a disagreement between price and order flow. It occurs when price makes a new high or low but cumulative volume delta — the running net of aggressive buying minus aggressive selling — fails to confirm it. A new price high on weaker buying delta, or a new price low on weaker selling delta, signals that the aggression driving the move is exhausting, warning of a possible reversal before it appears in price.
Bearish delta divergence is price making a higher high while cumulative delta makes a lower high — buyers pushed to a new peak with less aggression, warning of a top. Bullish delta divergence is price making a lower low while cumulative delta makes a higher low — sellers pushed to a new trough with less aggression, warning of a bottom. They are mirror images of the same exhaustion signal.
CVD, or cumulative volume delta, is a running total of delta — the net of aggressive buy volume minus aggressive sell volume — accumulated bar by bar into a line. Delta divergence is most commonly read against CVD: you compare price swing highs and lows to the corresponding highs and lows on the CVD line, and a divergence is where the two disagree.
It is reliable as a component but not as a standalone signal. Divergences appear frequently and many resolve into trend continuation rather than reversal. It becomes reliable when used with a confirmation rule: the divergence must occur at a significant level, after an extended move, and be confirmed by a market structure break before you act. On liquid instruments with those conditions met, it is a high-quality edge; used alone or on thin instruments, it is close to a coin flip.
Wait for a market structure break in the divergence's direction — a break of the last minor swing that shows the balance has actually shifted. The divergence tells you the fuel is gone; the structure break tells you the vehicle has changed direction. Enter after the break with a stop beyond the extreme that produced the divergence. Front-running the break often results in being stopped out by continued absorption before the reversal arrives.
Absorption is when aggressive orders on one side keep hitting the market but price refuses to move, because a large passive participant is soaking them up with limit orders. It is the mechanism underneath most divergences: delta stays strong (aggressors keep pushing) while price stalls (a bigger passive order absorbs them). When the aggressive side finally gives up, price reverses. The divergence on a CVD panel and the absorption on a footprint chart are the same event.
Liquid markets with clean trade classification: BTC and ETH perpetuals, major index futures such as ES and NQ, and high-volume forex pairs. On thin instruments — low-volume altcoin perps, exotic pairs — the bid/ask classification behind delta is noisy and the divergences you see are as likely to be measurement error as real order flow. Aggregated delta across venues is more reliable than any single exchange's.
Yes. TradingView provides a cumulative volume delta indicator that plots in a lower panel, letting you compare price swings to CVD swings directly — the most common way to read the pattern. Per-bar delta histograms are also available. True footprint and delta-at-price displays require dedicated order-flow software with tick-level data, but the CVD line is enough to trade the core setup.
More guides
References & Related Guides
More in this topic
- Open Interest Explained 2026 — Complete Guide
- Cumulative Volume Delta (CVD): Complete Guide 2026
- Order Flow Trading 2026 - Read the Footprint of Institutions
- Volume Profile Trading Guide 2026 - POC, VAH & VAL
- VWAP 2026 - Complete Volume Weighted Average Price Guide
- What Are the Best Volume Indicators? (2026)
- On-Balance Volume (OBV): Complete Guide (2026)
- Money Flow Index (MFI): Complete Guide (2026)
- Wyckoff Method 2026 - Complete Institutional Trading Guide
- Liquidity Sweep Trading: Stop Hunts Explained (2026)
- Institutional Trading Strategy 2026: Trade Like Banks
- Supply and Demand Trading Guide 2026 - Zones & Flips
- Swing Failure Pattern (SFP): The Complete Guide (2026)
- Funding Rate Trading Guide 2026 - Perpetual Futures
Core reading
- Order Flow Trading 2026 - Read the Footprint of Institutions
- Volume Profile Trading Guide 2026 - POC, VAH & VAL
- BOS & CHoCH: Complete Market Structure Guide 2026
- Support & Resistance: Complete Trading Guide (2026)
- Risk Management in Trading 2026 - Complete Guide
- All Premium Guides
- Quantum Algo on TradingView
- Public Verified Track Record