Free Algorithmic Trading Course: A 12-Week Roadmap from Idea to Live Deployment
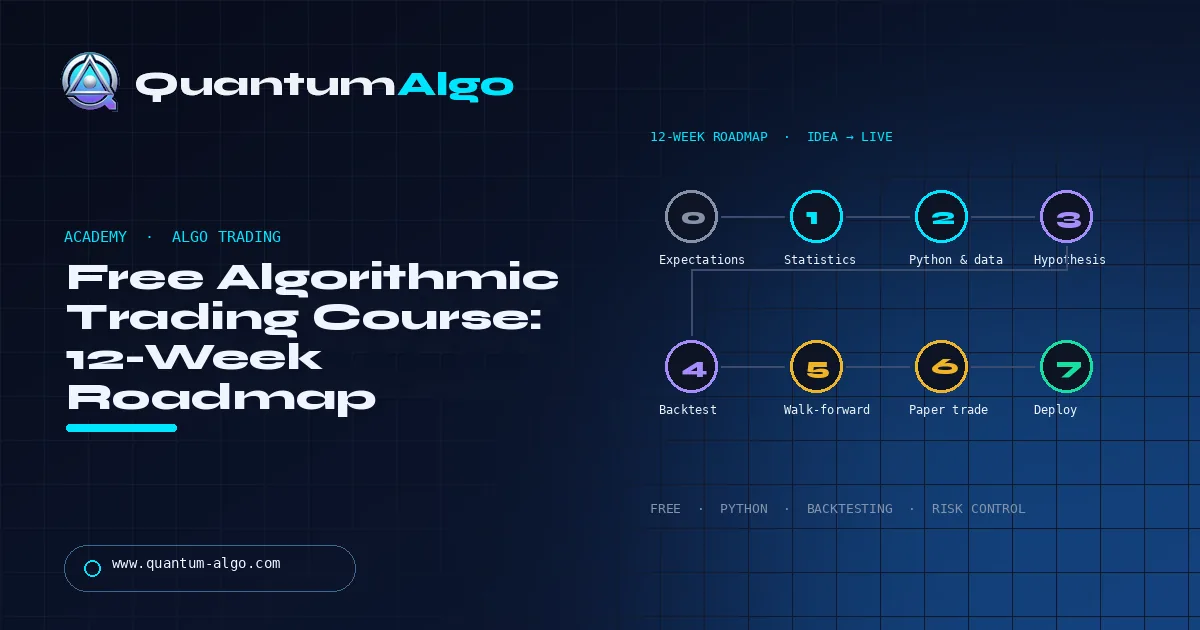
You can learn algorithmic trading for free: the roadmap is expectations and risk first, then market statistics, then Python and data, then one testable hypothesis, a cost-aware backtest, walk-forward and Monte Carlo checks, paper trading and a small live rollout with a kill switch. Twelve weeks is realistic; a profitable bot in a weekend is not.
Most “free algo trading courses” are playlists: an hour of Python, an hour of indicators, and a backtest that looks perfect because it uses tomorrow’s close. This roadmap is the sequence I wish I had followed — ten stages, twelve weeks, one capstone project — with the free resources that actually cover each stage and the traps that cost people real money. Quantum Algo’s free 80-lesson Academy covers the market-structure half; this course covers the code, testing and deployment half. Zeno and QuantumBot are the products, not the curriculum.
Indicators that prove themselves in public.
One engine, four precision tools — the Gold (XAU) Scalper, the institutional Gravity Zone, the Zeno momentum Oscillator, and Zeno Stocks for equities.
Stage 0 — How do you set expectations and protect capital?
Algorithmic trading is not a shortcut around uncertainty. A bot can execute a bad idea faster and more consistently than a human. Before writing code, define the money that can be lost, the markets you understand, and a rule that prevents live trading until the research and paper phases are complete.
Learn the difference between an investment, a discretionary trade, a systematic strategy, and a fully automated execution system. Understand leverage, margin, liquidation, spread, slippage, fees, funding, and gap risk. Read your broker’s contract specification and the exchange’s order rules. The objective of the first stage is not an entry signal; it is knowing what a filled order means.
Stage 1 — Market and statistics foundations
Study OHLC bars, returns, volatility, correlation, liquidity, and market regimes. Learn arithmetic and logarithmic returns, simple and exponential moving averages, ATR, VWAP, momentum, and drawdown. You do not need advanced calculus to begin, but you do need comfort with percentages, distributions, conditional probability, and basic statistics.
Practice with a spreadsheet. Calculate a moving average, a return series, a maximum drawdown, and a position size from a stop. Create a small table that includes wins, losses, average win, average loss, win rate, expectancy, and profit factor. The spreadsheet becomes a reality check before code makes the process look sophisticated.
Stage 2 — Python and data literacy
Learn Python syntax, functions, lists, dictionaries, modules, exceptions, and virtual environments. Then learn NumPy for arrays, pandas for tabular time series, matplotlib for plots, and a data reader or API appropriate for your market. Version-control every notebook and script.
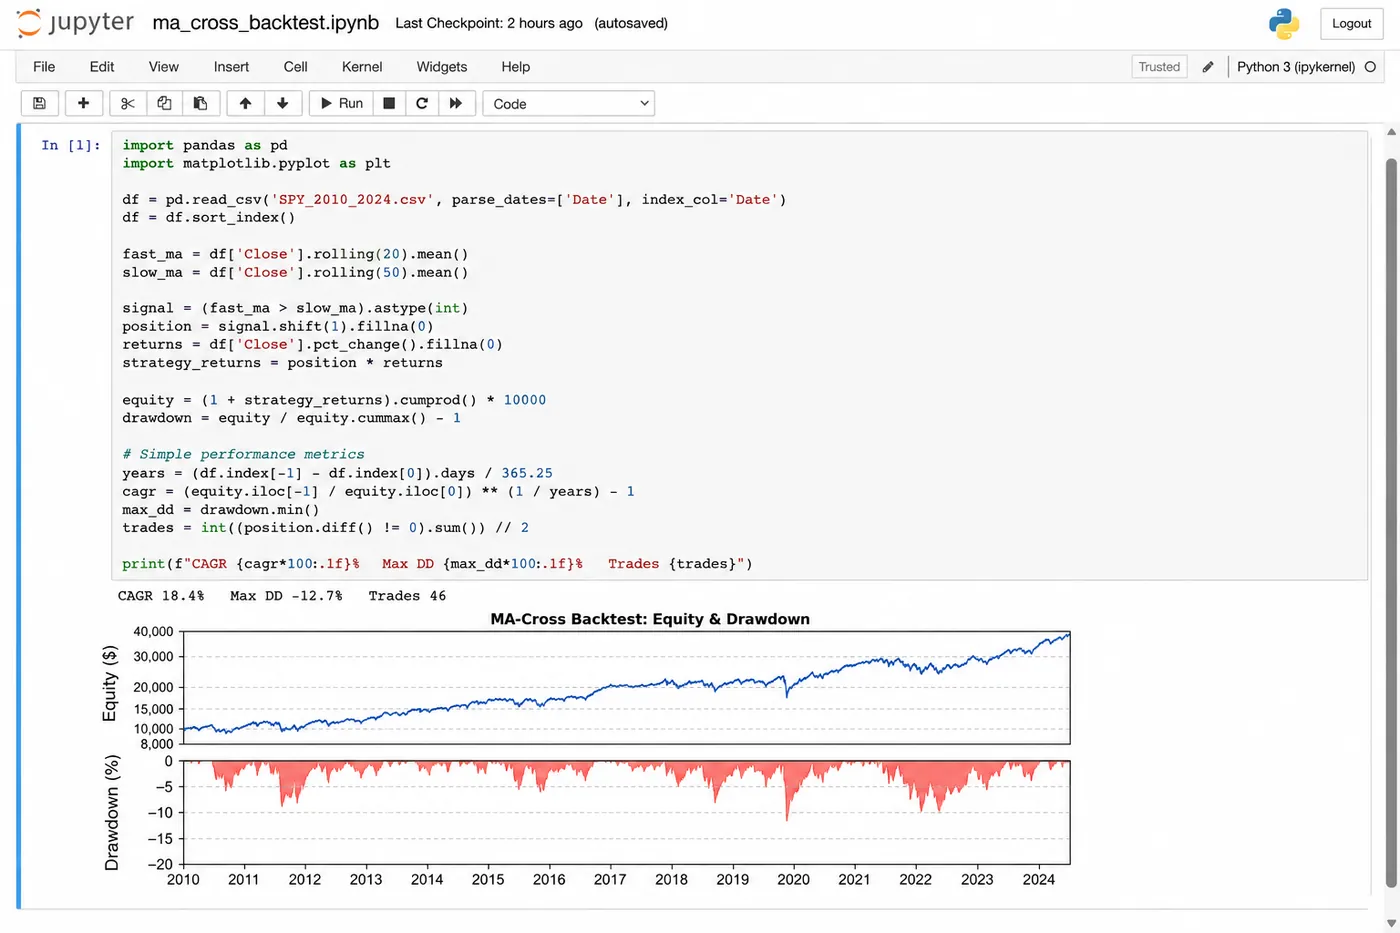
Data literacy matters more than a clever library. Check timestamps, timezone, duplicate rows, missing values, corporate actions, contract rolls, symbol changes, and survivorship bias. Inspect the first and last rows and plot the raw series before calculating an indicator. If you cannot explain where a row came from, do not use it in a backtest.
Stage 3 — How do you form a testable hypothesis?
A hypothesis is specific enough to fail. “Momentum works” is not testable. “When a liquid index closes above a 50-day high and the next-day ATR is below a pre-defined threshold, a position is opened at the next session’s open and exited after 10 bars or a trailing stop” is testable.
Write the market, timeframe, data source, signal, entry, exit, position size, risk limit, session, costs, and evaluation metrics before running the test. Separate discovery from confirmation. If you keep changing the rules after seeing results, label the work as exploration rather than evidence.
Stage 4 — Build indicators and signals
Implement one simple indicator yourself so you understand its inputs and warm-up period. Then compare it with a trusted library. For a volume indicator such as Klinger or VWAP, verify whether the feed provides centralized volume or tick volume. For ATR-based tools, verify the smoothing method.
A signal should be a boolean or numeric rule that can be logged. Avoid vague conditions such as “strong trend.” Convert them into measurable definitions: close above a rising moving average, ADX above a threshold, or a breakout that closes beyond the prior range. Add a bar-confirmation rule so the live system does not act on information that was unavailable at the decision time.
Stage 5 — How do you backtest with realistic mechanics?
A backtest is a simulation, not a time machine. TradingView and QuantConnect both document the importance of order timing, slippage, commission, and the risk of lookahead. Use the next executable price when the strategy signal is created at a bar close. Model partial fills, limit-order non-fills, stop gaps, and trading halts where relevant.
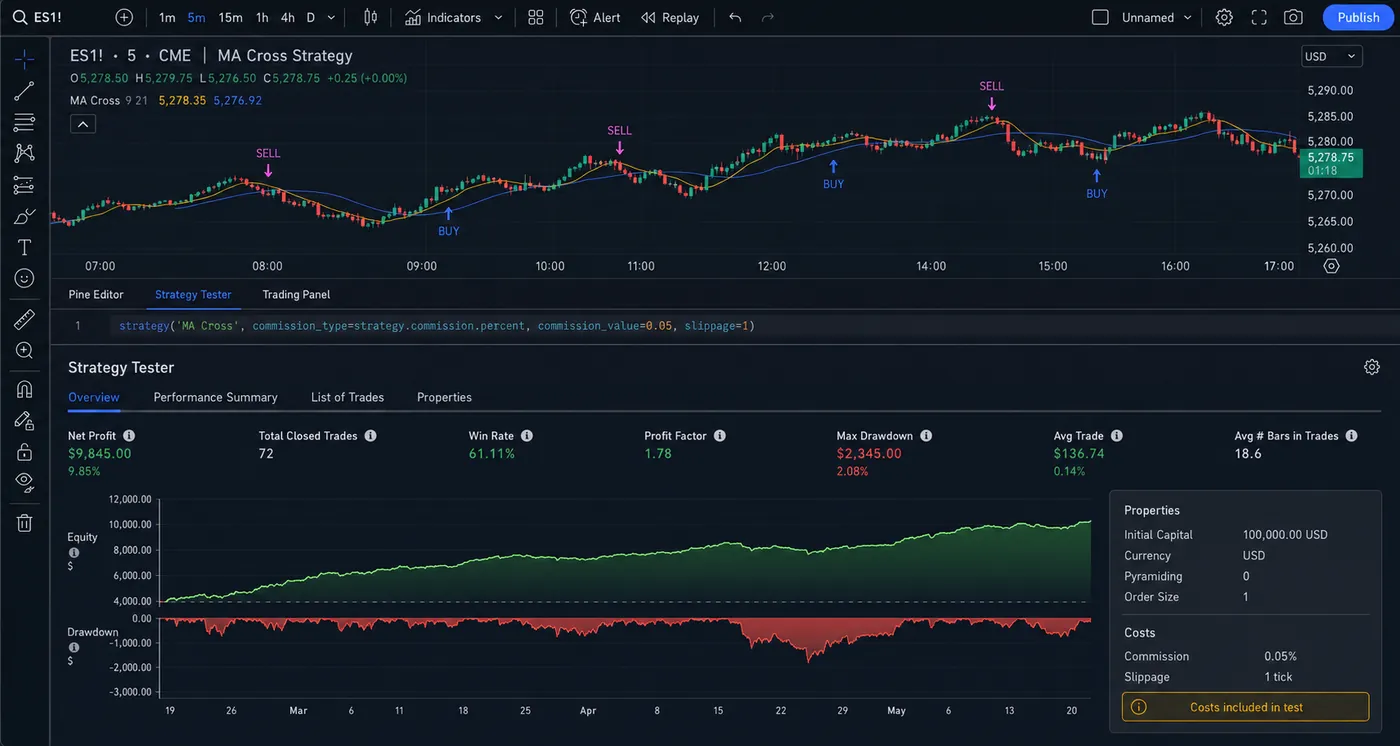
Avoid lookahead bias by ensuring that every feature uses information available at that timestamp. Avoid survivorship bias by including delisted or failed instruments when the strategy’s universe would have included them. Avoid selection bias by testing more than the symbols that already look good. Avoid overfitting by separating in-sample development from out-of-sample evaluation.
Stage 6 — Why evaluate more than return?
Track net return, annualized return, maximum drawdown, volatility, Sharpe-like ratios, Sortino-like ratios, profit factor, expectancy, win rate, average trade, turnover, exposure, and tail loss. No single metric is sufficient. A high return with extreme drawdown may be untradable; a smooth curve with only 12 trades may be statistically weak.
Inspect trade-level distributions and regime splits. Ask how the strategy behaves in trends, ranges, high volatility, low volatility, gaps, and illiquid periods. Compare the result with a simple benchmark and with a no-trade baseline. Save the exact data version and parameter file so the result can be reproduced.
Stage 7 — How do walk-forward and Monte Carlo test robustness?
Use walk-forward testing: optimize or choose rules on one historical window, then test them on the next unseen window. Roll the process forward without changing the rules after seeing the holdout result. Run parameter sensitivity around the chosen values. A robust strategy usually degrades gradually when inputs move slightly; a sharp performance spike is a warning.
Monte Carlo resampling can stress the sequence of trades and estimate how losing streaks or drawdowns might vary. It does not solve regime change or create a probability guarantee. Treat it as a stress test, not proof.
Stage 8 — What does paper trading actually test?
Paper trading tests the operational path: data arrives, signals trigger, orders are constructed, risk checks run, and logs are written. It does not reproduce every liquidity and emotional effect of live capital, but it can expose broken timezones, duplicate alerts, wrong quantities, and missing stops.
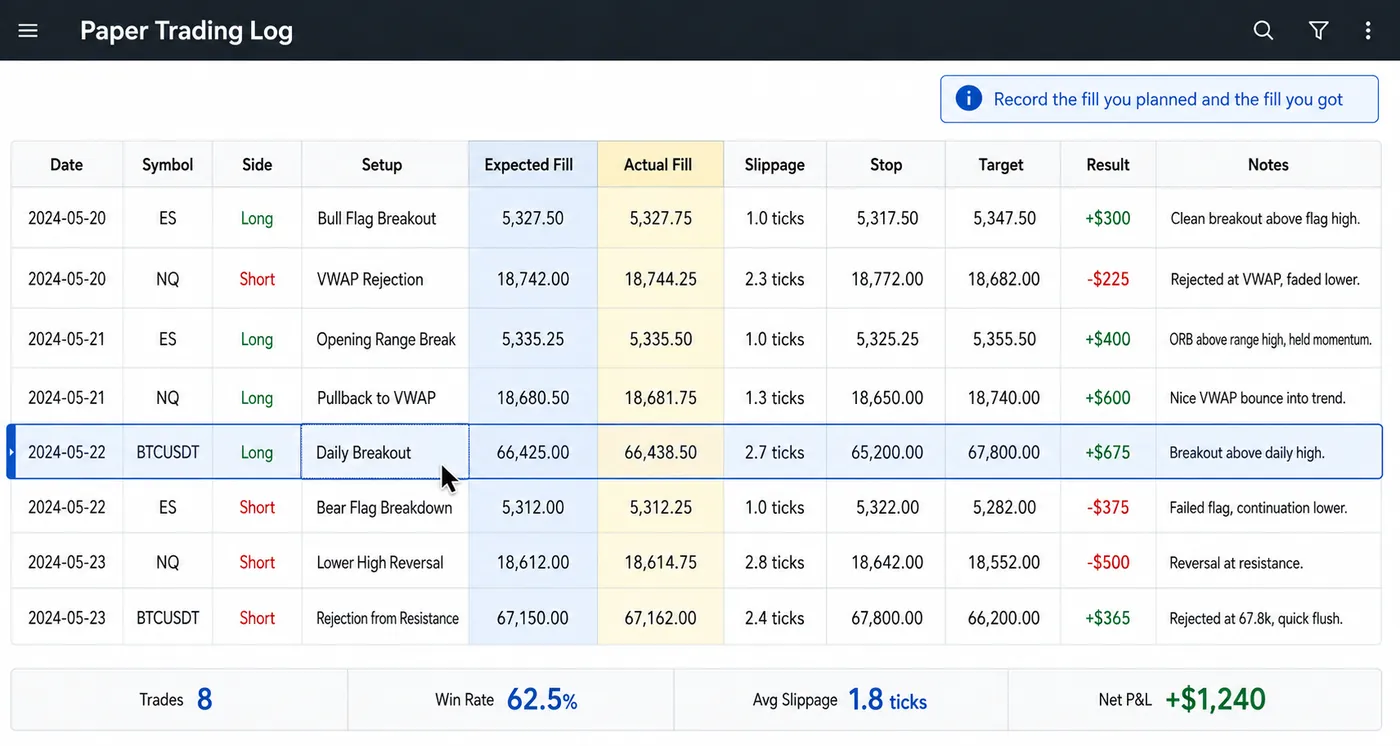
Run a meaningful sample that includes ordinary days, volatile days, gaps, market closures, and data interruptions. Compare expected fills with observed quotes. If the paper result differs materially from the backtest, investigate before deploying.
Stage 9 — Deployment architecture
QuantConnect’s algorithm framework separates universe selection, alpha, portfolio construction, execution, and risk management. This modular structure is useful even if you use another platform. Keep signal generation separate from order routing. Add a position limit, max daily loss, max drawdown stop, stale-data check, duplicate-order guard, and emergency kill switch.
Use secrets management for API keys. Log every decision with a timestamp, symbol, input values, order request, response, and error. Add monitoring for process health, data freshness, connection status, rejected orders, and unexpected positions. A bot that cannot explain what it did is not production-ready.
Stage 10 — Live rollout
Start with the smallest practical size. Compare live fills with the backtest’s assumptions. Do not optimize the strategy while it is simultaneously changing in production. Use a change-control process: one code or parameter change, a recorded reason, a new paper test, and a rollback path.
Define when the system is paused: daily loss limit, data outage, abnormal spread, exchange notice, repeated order rejection, or a drawdown threshold. A pause rule is not an admission of failure; it is an operational risk control.
What does the 12-week schedule look like?
| Weeks | Focus | Deliverable |
|---|---|---|
| 1 | Market mechanics and risk | One-page risk policy |
| 2 | Statistics and spreadsheets | Return/drawdown workbook |
| 3 | Python basics | Clean time-series script |
| 4 | pandas and plotting | Reproducible chart notebook |
| 5 | Indicator implementation | One tested indicator |
| 6 | Hypothesis and signals | Written strategy specification |
| 7 | Backtest engine | First cost-aware backtest |
| 8 | Bias and robustness | Out-of-sample report |
| 9 | Metrics and Monte Carlo | Risk report |
| 10 | Paper trading | Operational log |
| 11 | Deployment controls | Monitoring and kill switch |
| 12 | Review | Go/no-go decision |
The schedule is intentionally slower than “build a profitable bot in a weekend.” Speed is useful for learning, but live capital deserves evidence.
Which projects should you build?
Beginner: a moving-average crossover on one liquid asset with fixed fractional risk and realistic fees. Intermediate: multi-asset momentum with volatility targeting and walk-forward evaluation. Advanced: event-driven execution with partial fills, order-state reconciliation, and a portfolio risk model. Avoid starting with deep reinforcement learning or a large multi-strategy system. Complexity can hide simple errors.
Which beginner traps end algo careers early?
- Using future data: the strategy knows the completed high or close before it could have.
- Ignoring costs: a high-turnover edge disappears after spread and commission.
- Optimizing everything: many parameters fit noise.
- Changing markets mid-test: the universe becomes inconsistent.
- Trading illiquid assets: fills are theoretical.
- No position reconciliation: the bot’s state differs from the broker.
- No shutdown rule: an outage becomes an uncontrolled position.
- Confusing a chart marker with an executable order: timing is different.
How do you turn signals into portfolio risk limits?
Signals do not determine portfolio size by themselves. Portfolio construction converts desired exposures into quantities while respecting leverage, cash, concentration, volatility, and correlation limits. Risk management then monitors the live portfolio and can reduce or close positions.
For a simple system, cap risk per trade, risk per symbol, daily loss, and portfolio drawdown. For a multi-asset system, use volatility scaling carefully and test correlations during stress. A strategy that is diversified by ticker can still be concentrated in one macro risk.
How do you know you are ready to go live?
At the end of the course, score the project against five milestones:
| Milestone | Evidence |
|---|---|
| Understands the market | Can explain product, session, costs, and failure modes |
| Understands the code | Can trace data from bar to order |
| Understands the statistics | Can explain drawdown, expectancy, and uncertainty |
| Understands execution | Can reconcile fills and handle errors |
| Understands risk | Can stop, size, and monitor the system |
If any milestone is missing, continue learning before live deployment. A roadmap is successful when it prevents avoidable mistakes, not when it produces a fast answer.
What should your first portfolio project be?
Choose one liquid instrument, one timeframe, one simple signal, and one fixed-risk rule. Build the smallest complete loop: load data, calculate the signal, size a position, simulate a fill, apply costs, record the trade, and plot equity and drawdown. Then deliberately break the assumptions: remove a data row, delay a fill, double the spread, or stop the process. If the project fails loudly and safely, you have learned something important. Expand only after the small loop is understandable.
This project also gives the learner a portfolio artifact for interviews or client work: a README, data dictionary, research report, backtest, paper-trading log, and risk checklist. The artifact demonstrates process, not a claim of future returns.
What capstone proves you understood the course?
The capstone should be deliberately modest: one liquid market, one transparent signal, fixed fractional risk, and a cost-aware backtest. The learner submits the strategy specification, data dictionary, code, unit tests, out-of-sample report, paper-trading log, and deployment checklist. A reviewer should be able to reproduce the headline result and identify exactly where the strategy can fail. This is a better completion standard than a screenshot of a rising equity curve.
Learn in order: expectations and risk, statistics, Python and data, one testable hypothesis, a cost-aware backtest, robustness tests, paper trading, then a tiny live rollout with a kill switch. Judge yourself by the milestone rubric, not by a backtest curve, and treat a failed hypothesis with clean evidence as course progress.
◆ Interactive check
Are you skipping a stage?
Questions traders ask about learning algorithmic trading
Yes, the core learning materials, programming tools, documentation, and paper-trading environments can be free. Data, broker access, compute, and live execution may still incur costs.
You can start with arithmetic, probability, statistics, and careful reasoning. More advanced strategies may require linear algebra, optimization, time-series analysis, or machine learning.
Python is a practical first language because of its data and research ecosystem. Learn enough software engineering to test, log, version, and deploy safely.
There is no safe universal timeline. Move only after you have a written strategy, realistic backtest, out-of-sample evidence, paper execution, risk controls, and a small-size rollout plan.
No. Its documentation is a useful reference architecture. Other platforms can work if they provide reliable data, realistic fills, testing, logging, and broker integration.
Yes. Every stage links to free documentation, open-source Python libraries and free paper-trading environments. What may cost money is premium data, broker access and, later, the capital you put at risk.
Not to start, but structure-based rules (order blocks, liquidity sweeps, fair value gaps) are among the easiest to specify precisely, which makes them good hypotheses. Quantum Algo’s free 80-lesson Academy covers that side; this roadmap covers the code and testing.
Start with none — paper trade. The first live rollout should be the smallest size your broker allows, sized so that a full stop-out is an inconvenience, not a decision. Our guide on how much money you need to start day trading covers the numbers by market.
Pine Script covers stages 4–6 well: indicators, signals and a broker-emulator backtest. It is weaker for walk-forward automation, Monte Carlo and deployment controls, which is where Python or a platform like QuantConnect fits.
Yes — QuantumBot executes Zeno’s signals on your own exchange account for $199/mo. It replaces the deployment stage, not the understanding: you should still finish stages 0–8 so you can judge what it does.
References & Related Guides
Read next
- What Is Quantitative Trading? Rules, Data and Who Actually Does It
- What Is Paper Trading? How to Practise Without Risking Money (and When to Go Live)
- Monte Carlo Simulation for Trading: Drawdown, Risk of Ruin and Position Size
- Algorithmic Trading for Beginners
- Backtesting Trading Strategies
- Pine Script v6: Getting Started
- Best Trading Bots
- How Much Money to Start Day Trading?
- Trading Journal: Complete Guide
- Algorithmic SMC Trading (Academy)
- Trading Profit Calculator
Authoritative sources
- QuantConnect documentation
- TradingView Pine Script: strategies
- pandas documentation
- SEC: automated trading and investor alerts
- CFTC: advisories on automated trading systems