Institutional Volume Profile [Quantum Algo]
Volume by price as a gradient heat map, coloured by buy/sell delta, with the Control Level, the 68% Equilibrium Zone, automatic Dense and Void Nodes, the POC Migration Trace and a live dashboard — 490 levels over 3,000 bars, free on any plan.
The short answer
The Institutional Volume Profile is a free, open-source TradingView volume profile indicator that goes beyond the flat histogram most profile scripts draw: it renders volume density as a gradient heat map, colours each price level by buy/sell delta dominance, marks the Control Level (point of control) and the Equilibrium Zone (value area, default 68% of density), automatically classifies Dense Nodes (high-volume nodes) and Void Nodes (low-volume nodes), traces how the point of control migrates through the scan window, and reports it all on a live analytics dashboard that tells you whether price sits in premium, discount or equilibrium. Built on a direct-mapped accumulation engine, it runs at up to 490 vertical levels over a 3,000-bar window without slowing the chart.
Volume by price: heat-mapped rows, the Control Level, the 68% Equilibrium Zone, Dense and Void Nodes, delta colouring, the POC Migration Trace.
Rotation around the Control Level in ranges; edges as dynamic S/R; Dense Nodes as reversal zones; Void Nodes as acceleration zones.
Direct range-mapped accumulation — 490 levels over 3,000 bars without lag.
What it draws
The profile
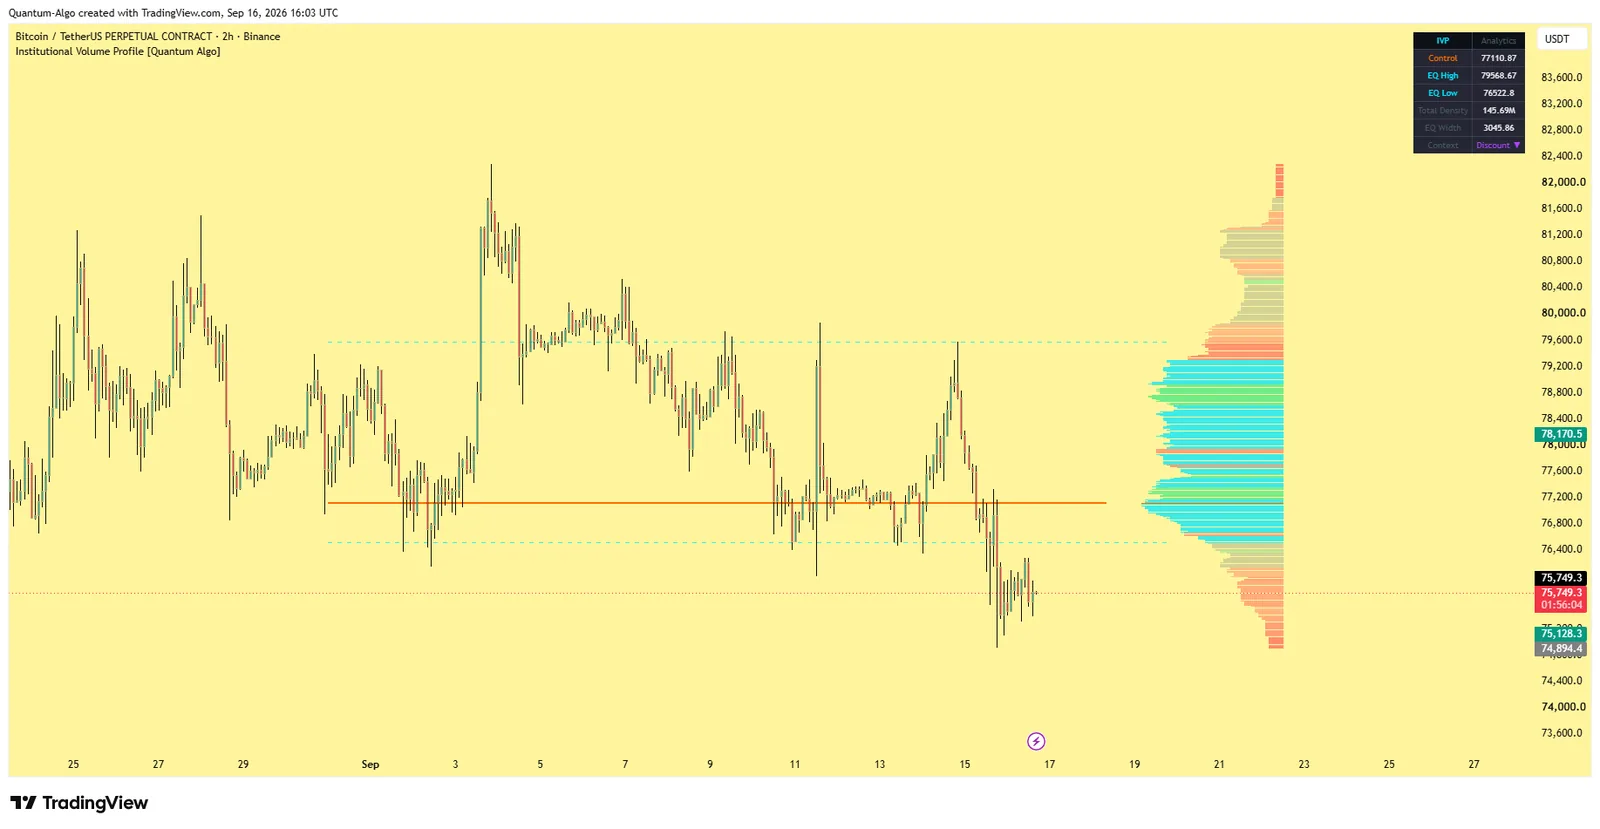
Up to 490 rows on the right of the chart, each a horizontal bar of accumulated volume at that price.
Gradient heat mapping
Rows transition from cool (sparse, muted grey) to warm (dense, vivid cyan) by density relative to the peak; inside the Equilibrium Zone the gradient shifts brighter.
Buy/sell delta background
When enabled, rows are coloured green where buy-side volume dominates and red where sell-side dominates, intensity scaling with the imbalance.
The Control Level
The single price with peak density, drawn as a prominent line across the analysis window (solid, dashed or dotted).
The Equilibrium Zone
The zone holding the configured share of total density (default 68%, one standard deviation), with dashed upper and lower edge lines.
Dense Node and Void Node labels
On the right edge — abnormally high-density levels that act as magnets, and negligible-density levels price travels through fast.
The Migration Trace
A dotted trail of where the Control Level sat at each sampling interval as the window developed.
The analytics dashboard
Control Level price, Equilibrium Zone edges, total density, zone width, and Premium / Discount / Equilibrium context.
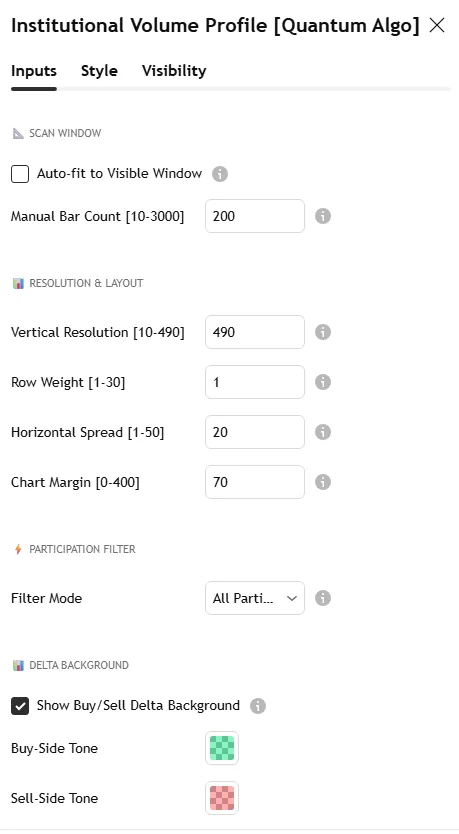
The Bitcoin 2-hour screenshot on this page shows the heat-map profile with the Control Level, zone edges and dashboard; the settings screenshot shows the Inputs tab.
Volume profile, in plain words
A volume profile turns time-based volume into price-based volume: instead of asking how much traded in each bar, it asks how much traded at each price. Where a lot traded, the market agreed on value — those levels attract price back and hold it. Where little traded, the market rejected the price — those levels are passed through quickly. The point of control is the price with the most volume; the value area is the range holding most of it. Our volume profile strategy guide covers the concept; this page is the tool, and the reason it differs from the standard version is the next section.
What makes it different from other volume profiles
| Standard volume profile | Institutional Volume Profile |
|---|---|
| Flat single-colour bars — every level looks equally important | Gradient heat mapping — the eye lands on the institutional clusters |
| No directional insight | Buy/sell delta colouring reveals hidden bias at every level |
| No node detection | Automatic Dense Node and Void Node classification with configurable thresholds |
| No context | Live dashboard: Control Level, zone edges, density, width, premium/discount/equilibrium |
| Static POC | Migration Trace shows the control level drifting as institutions reposition |
| O(bars × levels) scanning | Direct range-mapped accumulation — 490 levels over 3,000 bars without lag |
The seven features
Gradient heat mapping — density relative to the peak drives colour; the zone brightens.
Buy/sell delta background — directional dominance per level; compare the profile with delta on and off, because a symmetric aggregate shape often hides a one-sided market.
Control Level — peak density, the centre of institutional gravity; in ranges price oscillates around it, and a sustained break with volume confirms a directional move.
Equilibrium Zone — the value area; the edges are dynamic support and resistance grounded in real participation.
Node classification — Dense Nodes as reversal and consolidation zones, Void Nodes as acceleration zones to the next dense level.
Migration Trace — a flat trace means institutions committed to one level; a migrating trace reveals active repositioning. A feature from institutional platforms brought to TradingView.
Analytics dashboard — the numbers, and the premium/discount/equilibrium context, without reading the profile by eye.
Settings
| Group | Input | What it does | Where to start (crypto 1H–1D) |
|---|---|---|---|
| Scan window | Auto-fit to visible, or fixed bar count | Range of bars profiled | 200 bars |
| Resolution & layout | Vertical resolution, row weight, horizontal spread, chart margin | Detail and footprint | 490 levels |
| Participation filter | All / Buy-side only / Sell-side only | Which side to accumulate | All |
| Delta background | Toggle, buy and sell tones | Directional colouring | on when reading bias |
| Heat mapping | Toggle, warm and cool tones | The gradient | on |
| Control Level | Toggle, weight, tone, line form | The POC line | on, solid |
| Migration Trace | Toggle, colour | Developing POC trail | on for session study |
| Equilibrium Zone | Share %, edge lines, tone, weight | The value area | 68% |
| Node classification | Dense/Void toggles, thresholds (× profile mean) | Node labels | Dense 2.0×, Void 0.3× |
| Analytics panel | Toggle, corner | The dashboard | on |
Lower timeframes (5m, 15m): scan 100–150 bars. Weekly / monthly: scan 500–1,000 bars.
How to use it
Control Level as gravity.
In ranges, expect rotation around it; a sustained break with volume confirms direction.
Equilibrium edges as dynamic support and resistance.
Longs near the lower edge with stops below; shorts near the upper edge with stops above.
Delta for bias.
Heavy green below price and heavy red above is a bullish structure; the reverse is bearish.
Dense Nodes as reversal zones
, Void Nodes as acceleration zones to the next dense level.
Dashboard context.
"Discount" — look for longs; "Premium" — look for shorts or exits; "Equilibrium" — range conditions.
Pair it with the level tools.
A Dense Node that coincides with a ranked line from Institutional Key Levels, or with an order block from Order Blocks with Volume, is the confluence we trade; the Zeno oscillator times the entry inside that structure.
Three ways to trade it
Value-area rotation — inside the zone with a flat Migration Trace, fade the edges toward the Control Level.
Value-area break — a close beyond an edge on rising volume with the trace migrating in the same direction; trade the continuation into the next Dense Node.
Void run — price entering a Void Node accelerates; enter with the move and target the next Dense Node, stop back inside the last dense level.
Recommended settings by market
Crypto perpetuals, 1H–daily:
200-bar scan, 490 levels, delta on — exchange volume makes the delta reliable.
Index futures, 15m–1H:
150-bar scan for the session; the cash-session profile is the one that matters.
Stocks, daily:
250-bar scan for the year's composite; nodes are the swing levels.
Forex CFDs:
Tick volume makes the delta indicative only; the shape and nodes still hold.
How it compares
Against TradingView's built-in profiles: those need a paid plan for the session and visible-range tools and draw flat bars; this is free on any plan and adds heat, delta, nodes, migration and the dashboard. Against Bookmap-style heatmaps (reviewed on this site): those are order-book liquidity, live; this is traded volume, accumulated — different data, complementary reads. Against Zeno: Zeno's Institutional Gravity Zone reads structure; the profile shows where the volume behind that structure sits.
Limitations
The profile is only as good as the volume data: exact on exchanges and futures, indicative on CFD tick volume. Delta is inferred from where bars closed within their ranges, not from exchange-side buy/sell tape. The scan window bounds the picture — a 200-bar profile knows nothing about last year's nodes. Drawing objects are managed within TradingView limits.
Step-by-step: adding it to your TradingView chart
Open the script page on TradingView (link above) and click Add to favorites, then Use on chart — or on any chart open Indicators, search "Institutional Volume Profile Quantum Algo" and add it. Free on every TradingView plan.
Open the indicator's settings and set the inputs for your market and timeframe from the table above; the defaults are tuned for crypto and gold.
In the Style tab, match the colours to your chart theme; the dashboard position and text size are in Inputs.
To set alerts, right-click the chart → Add alert, choose the indicator as the condition and pick the event; set "Once per bar close" so alerts match the closed-bar logic.
Save the layout, and add the other free Quantum Algo tools to it — they are designed to sit together.
To read or reuse the code, click Source code on the script page; republishing is subject to TradingView's house rules.
Inside the code, for developers
Pine Script, open source. Worth reading if you want to modify it: pivot confirmation with ta.pivothigh / ta.pivotlow and a symmetric lookback (the source of the deliberate lag); state held in capped arrays of drawing objects with explicit create/update/retire functions; every detection and signal gated on barstate.isconfirmed; named alertcondition calls so webhooks receive a consistent payload. The Academy's Pine Script tutorials and the TradingView backtesting guide cover strategy conversion.
Using it with the other free indicators
The free tools layer on one chart: the Smart Money Concepts Engine for bias and the Confluence Score; Order Blocks with Volume, Fair Value Gaps + Inversion and Institutional Key Levels for the zone; Liquidity Sweeps, Sessionscope and Liquidation Magnet for the liquidity and the trigger; OTE + Silver Bullet for the time-qualified entry; the Institutional Volume Profile and Pressure Oscillator for whether volume agrees. The free-indicators hub lists every tool; the SMC guide is the method behind the layering.
Common mistakes with this indicator
- Trusting the developing bar — every event waits for the close.
- Trading every marker — the tool gives context and location; the entry needs structure confirmation and a stop beyond the level.
- Default lengths on the wrong timeframe — adjust the pivot inputs, as the settings table shows.
- Ignoring volume quality — indicative on CFD tick volume, real on exchanges and futures.
- Stacking ten random scripts — the free tools layer because they were built to.
Want the signal, not just the structure?
Zeno reads the same Smart Money structure across timeframes and prints the entry, stop, TP1 and TP2 on your chart — with a public record of 160 posted trades, 120 wins and 40 losses at the stated levels. QuantumBot executes it on Bybit, Binance, OKX, Bitget and Kraken.

Glossary for this indicator
Frequently asked questions
Is the Institutional Volume Profile free?
Yes — open source on TradingView, on every plan including the free tier; TradingView's own session and visible-range profiles need a paid plan.
What is the Control Level?
The point of control — the price with peak accumulated density in the scan window, the centre of institutional gravity. In ranges price rotates around it; a sustained break with volume confirms a move.
Why 68% for the Equilibrium Zone?
It matches one standard deviation, the convention for the value area; the share is configurable (70% is the other common choice).
What is the Migration Trace?
A dotted trail of where the Control Level sat at each sampling interval — the developing POC. Flat means commitment to one level; migrating means repositioning.
Does it work on lower timeframes?
Yes — reduce the scan window to 100–150 bars on 5m and 15m charts so the profile describes the session rather than a week.
How does it relate to Zeno?
Zeno reads structure and times entries; the profile shows where the volume behind that structure sits. Run them together — the profile for location, Zeno for timing.
How is it different from TradingView's built-in volume profile?
Free on every plan, and it adds gradient heat mapping, buy/sell delta per level, automatic node classification, the POC Migration Trace and a live dashboard — none of which the built-in flat-bar profiles have.
Is the delta real buy/sell data?
It is inferred from where each bar closed within its range, the same way every on-chart profile must infer it; exchange-side tape is not available to Pine Script. On exchanges and futures it is a reliable proxy; on CFD tick volume, indicative.
What scan window should I use?
200 bars on 1H–daily crypto and index charts; 100–150 on 5m–15m; 500–1,000 on weekly and monthly. Auto-fit to the visible range for a quick read.
What is a Dense Node?
A level whose density exceeds the configured multiple of the profile mean (default 2×) — a magnet and a reversal or consolidation zone. Void Nodes are the reverse (default 0.3×).
Can I profile only buy-side or sell-side volume?
Yes — the Participation Filter accumulates All, Buy-side only or Sell-side only, which is a different view from delta colouring.
The other free Smart Money indicators
Built to layer on one chart: the engine for bias and the score, the dedicated tools for each element.
Add Institutional Volume Profile to your chart
One click on TradingView, free on every plan, code you can read. Nothing repaints.