Bookmap Review (2026): The Order-Book Heatmap, and What It Actually Shows a Smart Money Trader
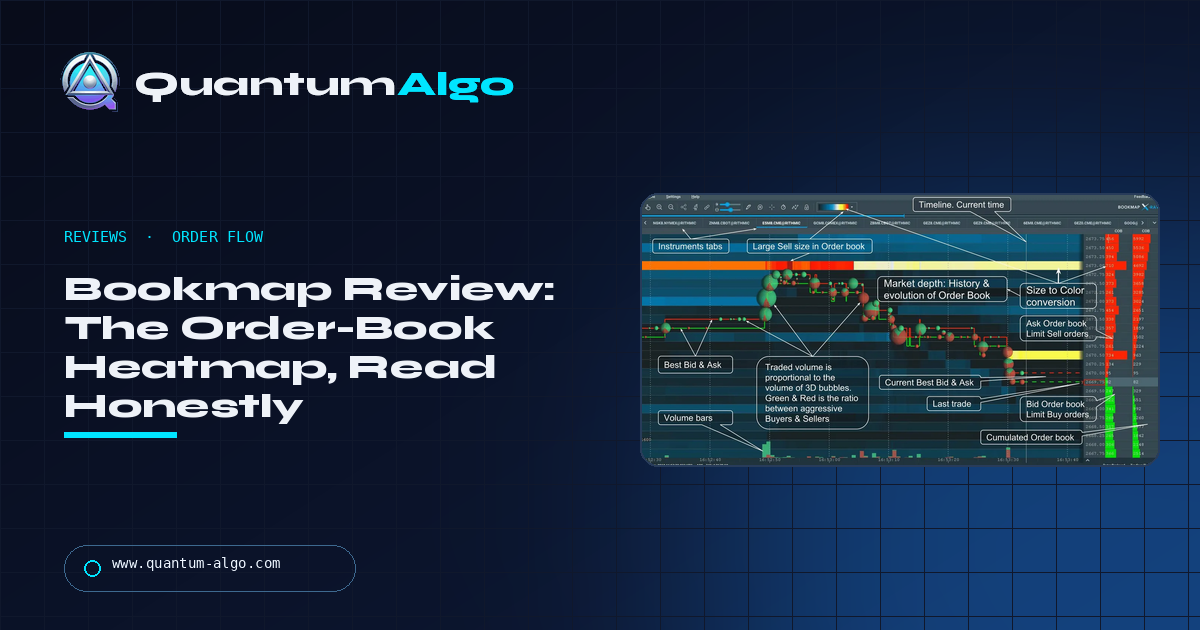
Bookmap draws the order book over time: a heatmap of resting bids and asks at every price, executed volume as bubbles, price running through it. It is the best liquidity heatmap available to retail, with a permanent free tier on crypto; futures and stocks need Global ($49/mo) or Global+ ($99/mo, $1,990 lifetime) plus exchange data fees that can double the cost. The heatmap shows a Smart Money footprint forming; it does not make the read easier. Rating 4.0 / 5.
Bookmap is the closest a retail trader gets to watching an order block form rather than reading it afterwards — a dense band of resting bids being hit and not moving is absorption, and when price breaks away, that band is the block you would later mark on a candle chart. This review is about when that extra layer is worth the screen space, what the headline price hides, and the traps (spoofing, screen density) that catch people who open it before they can read a normal chart. The translator below maps Bookmap events to the concepts Zeno marks.
Indicators that prove themselves in public.
One engine, four precision tools — the Gold (XAU) Scalper, the institutional Gravity Zone, the Zeno momentum Oscillator, and Zeno Stocks for equities.



What is Bookmap?
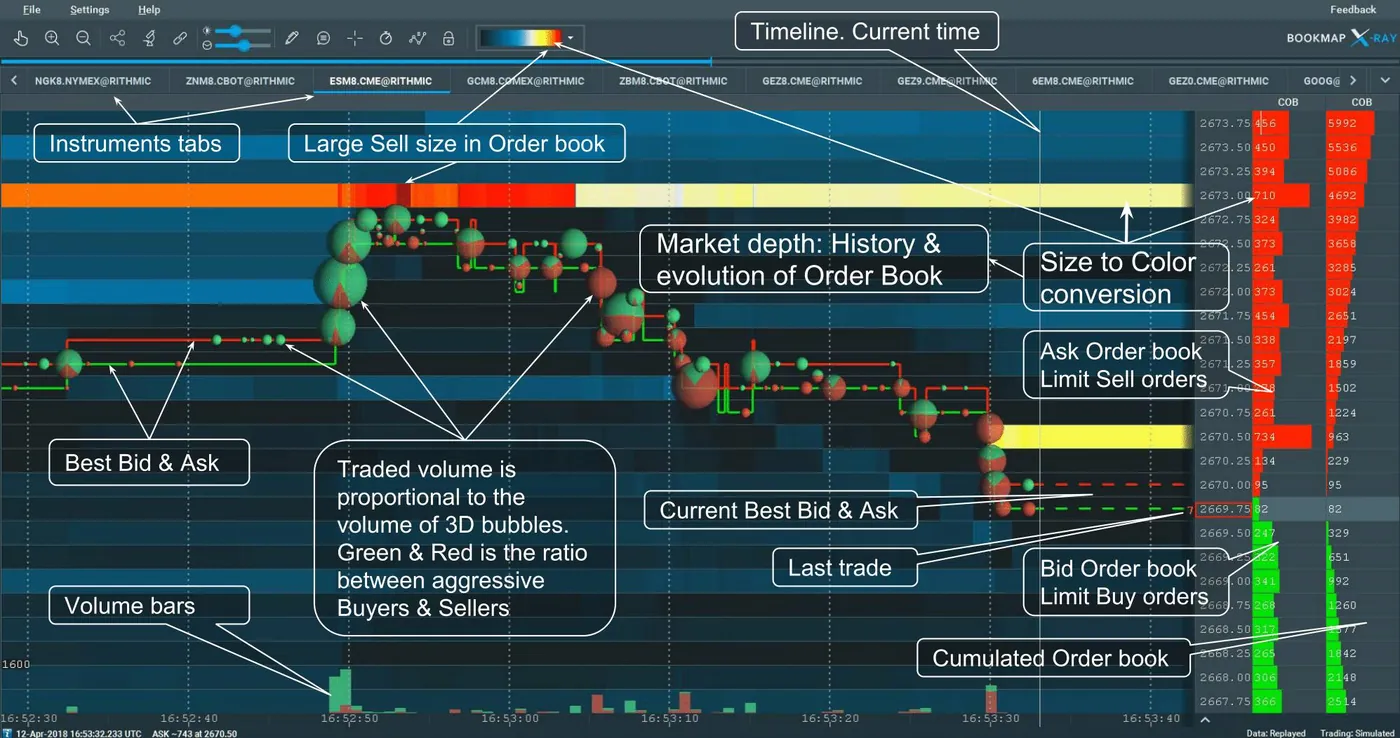
Bookmap is a market-visualisation platform that draws the order book over time: a heatmap of resting limit orders at every price, brighter where more size is waiting, with executed volume as bubbles on top and the price line running through it. Where a candlestick chart shows what traded, Bookmap shows what was waiting to trade and what happened to it — pulled, filled, absorbed. It runs on futures, stocks and crypto, with the crypto tier free, and it is the tool most associated with "order flow" in retail trading.
For Smart Money traders it is the closest you can get to watching the footprint form rather than reading it afterwards, and that is both its value and its trap: the heatmap is dense, the learning curve is steep, and most of what it shows can be read from an ordinary chart once you know what to look for. This review is about when the extra layer is worth the screen space.
Basis of this review: Bookmap's published pricing, documentation and knowledge base (verified September 2026), the free Digital tier on crypto, and the way heatmap events map onto the structure Zeno marks. Screenshots are the vendor's own and are credited.
At a glance: the verdict
Rating: 4.0 / 5. The best liquidity heatmap available to retail, with a free tier that is genuinely usable on crypto. Loses points for the data fees on futures and stocks that are not in the headline price, the four-tier lineup that is easy to misread, and the fact that heatmap reading is a skill with a long ramp — the visual is not the edge.
Best for: futures and crypto day traders who want to see resting liquidity being absorbed or pulled in real time; scalpers; anyone learning what an order block looks like while it is forming. Not for: swing traders, anyone trading forex or gold at a CFD broker (no order book to show), or traders who have not yet learned structure on a normal chart.
What Bookmap does
- Liquidity heatmap — resting bid and ask size at every price, over time, colour-scaled; the darker band in the chart screenshot is where size sat and how long it survived.
- Volume bubbles — executed volume as circles, sized by quantity, split by aggressor; the annotated screenshot in this review labels every element.
- Depth of market (DOM Pro) — a live ladder alongside the heatmap.
- Large-lot tracker, iceberg detector, imbalance and absorption indicators — on the higher tiers, flags for the events order-flow traders trade.
- Cumulative volume delta, VWAP, point of control and the usual volume tools.
- Record and replay — play back a session's order book, which is the only way to practise reading it.
- Multibook — a consolidated crypto order book across exchanges.
- One-click trading through supported brokers and exchanges; simulation mode.
- Marketplace add-ons and an API for custom indicators.
Pricing in September 2026
| Tier | Price | What it is |
|---|---|---|
| Digital (free) | $0 | Real-time heatmap on one crypto instrument at a time, delayed stocks and futures, core indicators — a permanent free plan, not a trial |
| Digital+ | roughly $19–39 / month depending on billing and bundle | More instruments, price tools, record/replay, one-click crypto trading, multibook |
| Global | $49 / month, $39 annual | Real-time futures and stocks (data fees extra), up to 20 symbols, replay |
| Global+ | $99 / month, $79 annual, or $1,990 lifetime | DOM Pro, Execution Pro, large-lot and iceberg tools, imbalance, cross-venue tools |
The number the headline price hides: market data for futures and stocks is billed separately — CME depth via Rithmic or dxFeed, full US equity depth from around $59 a month — so a working futures setup on Global is closer to $100–150 a month all in. Crypto is the exception: exchange data is free, which is why the free tier is real.

Automate your trades. Let Quantum Algo trade for you.
Every signal executed on your own account — on your account, with the plan you define.
Where it is genuinely good
You can watch a footprint form. A dense band of resting bids that gets hit repeatedly and does not move is absorption — and when price finally breaks away from it, that band is the order block you would later mark on a candle chart. Seeing it consumed in real time teaches what the concept means faster than any diagram. The heatmap-to-price-action illustration in this review pairs the two views.
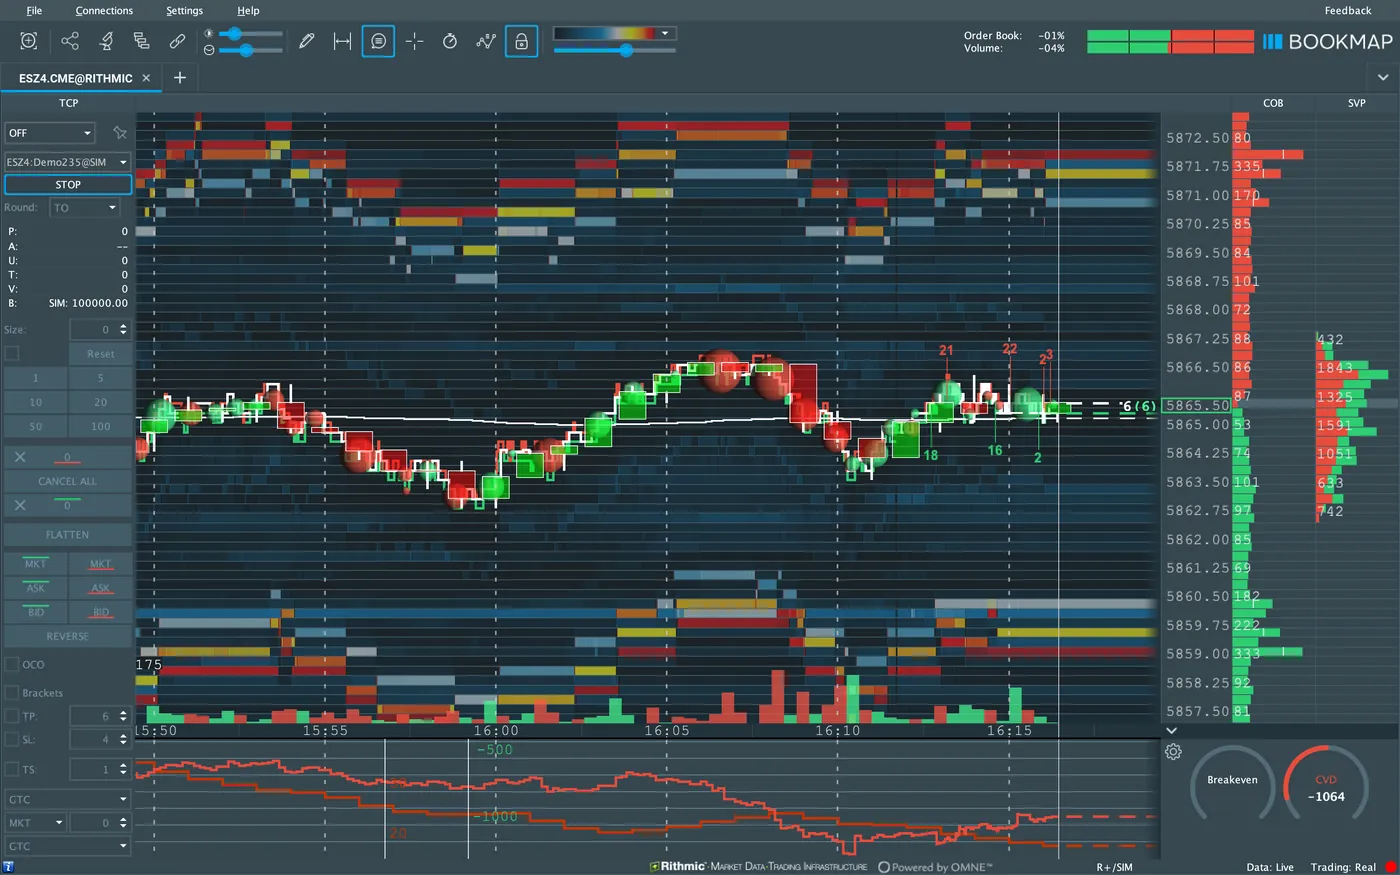
Icebergs and pulled liquidity. Large orders that refill at the same price, and large orders that vanish as price approaches, are the two behaviours behind most sweeps; Bookmap shows both, and the Global+ tools flag them.
The free tier. A real-time depth heatmap on a live crypto book at no cost, indefinitely, is more than the category usually gives away. Learn on BTC before paying for ES.
Replay. Practising heatmap reading on a recorded session is the only way to build the skill without paying tuition in live trades.
Where it falls short
Data fees. Global's $49 is not the cost of trading futures on Bookmap; the exchange data can double it. Budget for the real number.
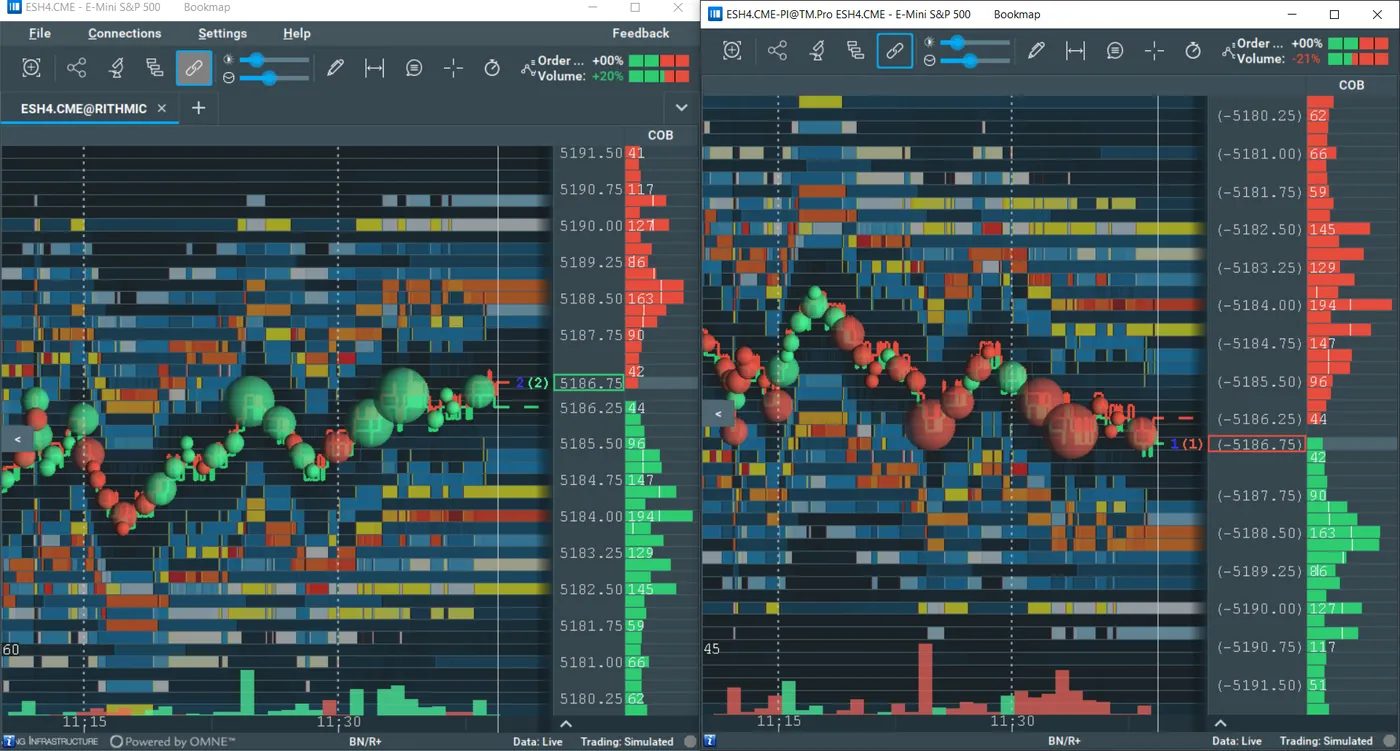
Screen density. The heatmap is a wall of colour until you have spent weeks with it. New traders often see patterns that are not there — a bright band is not a support level, it is a resting order that can be pulled a second before price arrives.
Spoofing. Large visible orders are sometimes placed to be seen, not filled. The heatmap cannot tell you which; only the behaviour when price approaches can.
Not for CFD or spot forex. There is no central order book; the platform has nothing to draw. Gold at a CFD broker is the same.
The visual is not the edge. The structure Bookmap shows forming is the structure that appears on the candle chart minutes later. For most traders the candle chart, with the footprints marked, is enough — Bookmap is for the ones who want to trade the formation itself, at scalping timeframes.
Bookmap vs footprint charts vs a Smart Money chart
A footprint chart (Sierra Chart, Jigsaw, TradingView's volume footprint) shows executed volume per price inside each bar — what traded and on which side. Bookmap shows what was resting — the passive size waiting. Absorption is where the two meet, which is why both try to mark it. A Smart Money chart shows neither directly; it marks the result — the block where absorption happened, the imbalance the break left, the highs that were swept. Same event, three views, from most to least granular. Most traders should master the third before paying for the first.
How it fits a Smart Money workflow
The translator tool on this page maps Bookmap's events onto the concepts Zeno marks: a resting band being absorbed → order block; a burst through pulled liquidity → displacement and fair value gap; a bright band above the highs being hit and vanishing → liquidity sweep. If you already trade those on TradingView, Bookmap is a second monitor for confirmation at the moment of entry on futures or crypto — not a replacement, and not something to open before the structure read is solid.
Bookmap shows the order book over time better than anything retail can buy, and the free crypto tier is real. Budget for the data fees on futures, expect a long ramp before the heatmap makes sense, treat bright bands as resting orders rather than support, and use it as a second monitor at the moment of entry — the structure it shows forming is the structure a Smart Money chart marks minutes later.
◆ Interactive check
Can you read the heatmap?
Questions traders ask about Bookmap
The Digital tier is a permanent free plan: real-time heatmap on one crypto instrument at a time, delayed stocks and futures. Paid tiers add instruments, real-time futures and stocks (plus separate data fees), replay and execution tools.
Not for spot forex or CFDs — there is no central order book to display. It works on currency and gold futures at CME, with the data fees.
No. A bright band is resting size that can be pulled before price arrives. Support is what happens when price gets there — absorption — not the band itself.
Global at $49 a month plus exchange data through Rithmic or dxFeed; a working ES setup lands around $100–150 a month all in. Global+ is $99 ($79 annual) or $1,990 lifetime.
No. The footprints Bookmap shows forming are the ones Zeno marks on the candle chart afterwards. Bookmap is for traders who want to trade the formation at scalping timeframes on futures or crypto.
Not before you can read structure on a normal chart. The free crypto tier is a good place to learn what absorption and pulled liquidity look like, but the heatmap is a wall of colour until you know what you are looking for.
Yes — record and replay of the order book on the paid tiers, which is the only practical way to practise heatmap reading without paying tuition in live trades.
Different views of the same event. Bookmap shows what was resting; a footprint shows what executed per price inside each bar. Absorption is where they meet. Most traders should master the candle chart with the footprints marked before either.
Yes, with one-click trading through supported brokers and crypto exchanges on the paid tiers, and a simulation mode for practice.
No. It shows the footprint forming in real time on futures and crypto; Zeno marks the result on the candle chart — block, sweep, imbalance, entry, stop, targets — on any market TradingView charts, including the forex and gold CFDs Bookmap cannot see.
References & Related Guides
Read next
- What Is Institutional Trading?
- Institutional Order Flow on TradingView
- Liquidity Sweep Trading
- Order Blocks & Fair Value Gaps Explained
- Footprint Chart Trading
- Futures Trading for Beginners
- Unusual Whales Review
- Displacement Trading
Authoritative sources
- Bookmap: pricing (Digital, Digital+, Global, Global+)
- Bookmap: product site and knowledge base
- CME Group: market data (depth fees context)
- SEC: order types, venues and spoofing context
- CFTC: advisories (spoofing is prohibited)