Anchored VWAP Engine [Quantum Algo]
Seven anchored VWAP streams that place and reset their own anchors — week, session, month, swing highs and lows, the highest-volume bar, and the exact bar of a liquidity sweep — with true volume-weighted deviation bands, automatic confluence clusters and a metric that names the VWAP the market is respecting today. One clean line by default; every other stream is a checkbox.
The short answer
The Anchored VWAP Engine is a free, open-source TradingView indicator that removes the hardest part of trading with anchored VWAP: choosing the anchor. It runs up to seven independently anchored Volume Weighted Average Price streams that place and reset their own anchors automatically — the week open (the default), session open, month open, confirmed swing highs and swing lows, the highest-volume bar in a lookback, and a liquidity-sweep anchor that re-anchors from the exact bar where a stop run occurred. On top of the streams it adds true volume-weighted deviation bands, automatic confluence cluster zones where several streams converge, band-rejection signals, and an In Control metric that names which VWAP the market is respecting most. Out of the box the chart shows one clean line — the week-anchored VWAP with its bands — and every other stream is a checkbox away.
Up to seven self-anchoring VWAP streams, volume-weighted bands, cluster zones, σ rejections and a dashboard with the In Control stream.
The liquidity-sweep anchor — a VWAP averaged from the exact bar where stops were run.
No — confirmed anchors, exact swing rebuilds, closed-bar signals.
What an anchored VWAP is
The Volume Weighted Average Price is the average price weighted by traded volume — the closest public approximation of the average position price of everyone who transacted since a chosen starting point. An anchored VWAP starts that calculation from a meaningful event rather than an arbitrary date: a weekly open, a swing low, a high-volume climax bar. Price above an anchored VWAP means the average participant since that event is in profit; price returning to it often behaves as a decision level, because it is where the average position breaks even. The power of the tool depends entirely on where it is anchored — which is exactly what this engine automates. Our VWAP guide covers the concept; this page is the tool.
What it draws
The primary stream
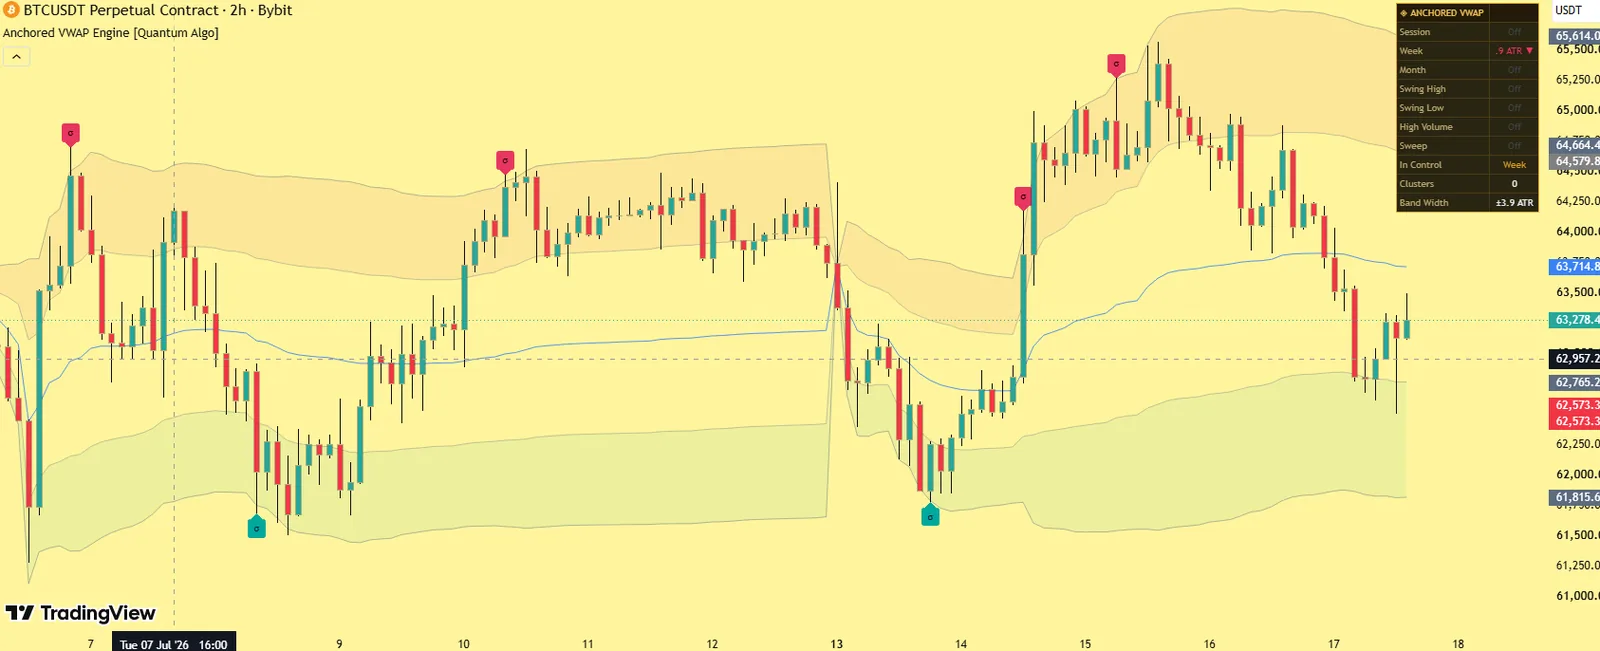
The week-anchored VWAP by default, with inner and outer deviation bands and softly tinted zones between them.
Six optional streams
Session open, month open, swing high, swing low, highest-volume bar, and the liquidity-sweep anchor — each in its own colour, each resetting on its own event.
Confluence cluster zones
When two or more active streams converge within an ATR tolerance, a labelled zone with its strength.
σ rejection signals
A single sigma character where price wicked beyond the outer band and closed back inside on the correct side of the VWAP; the full context is in the hover tooltip.
The dashboard
Every stream with its live distance from price in ATR units and side, the In Control stream, active cluster count, and the current band width.
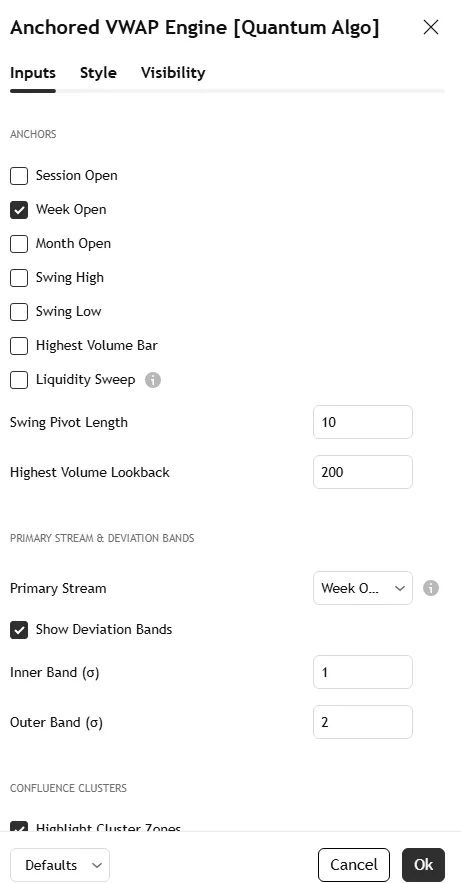
The Bitcoin 2-hour screenshot on this page shows the week stream with its bands, a second stream enabled and the dashboard; the settings screenshot shows the Inputs tab.
Why it is different
Automatic multi-anchor engine.
Seven streams anchor and re-anchor themselves from objectively defined events — no manual anchor placement, no stale anchors, no guessing.
The liquidity-sweep anchor.
When a swing level is wicked through and rejected, the sweep stream re-anchors from that exact bar and colours itself by implication: the accumulation tone after a sell-side sweep, the distribution tone after a buy-side raid. Averaging from the stop-run bar tracks the entry basis of the participants who engineered it — an anchor type we have not seen published before.
Exact swing anchoring.
Swing-anchored streams rebuild their sums retroactively from the true pivot bar once the pivot confirms, so the calculation is identical to a VWAP hand-anchored on the swing itself — not started late at the confirmation bar.
Confluence clusters.
Multiple independent volume-weighted averages agreeing on one price is the strongest form of VWAP confluence, and the engine detects it automatically.
The In Control metric.
An exponentially decayed crossing-rate measures how cleanly price is respecting each stream; the dashboard names the one currently in control, so you watch the anchor that matters today.
True volume-weighted bands.
Built from the volume-weighted variance of the primary stream — not a simple price standard deviation — at two configurable widths.
Quiet by default.
One stream, one set of bands, capped signals, a compact dashboard. The engine detects everything; the chart shows what you ask for.
How it works
Streams. Each stream maintains volume-weighted price and variance sums that reset on its anchor event — new week, new session, new month, a confirmed swing, a lookback volume record, or a qualified liquidity sweep. Between events the sums accumulate bar by bar.
Sweep detection. A sweep qualifies when price wicks through the last confirmed swing level but closes back inside it, with per-level memory so the same level cannot re-trigger; the sweep stream re-anchors from that bar.
Deviation bands. The primary stream carries inner and outer bands at configurable sigma multiples computed from its own volume-weighted variance.
Signals. A wick beyond the outer band with a close back inside, on the correct side of the VWAP, prints the σ rejection — reversion bias toward the average — on closed bars only, rate-limited by a cooldown.
Clusters. On the live bar the engine groups all active stream values within the tolerance and draws a labelled zone for each group of two or more.
Non-repainting. Anchors use confirmed events, sweeps and signals are evaluated at bar close, and swing streams rebuild exactly rather than approximately.
Settings
| Group | Input | What it does | Where to start |
|---|---|---|---|
| Anchors | Seven stream toggles | Which VWAPs run | Week Open only (default) |
| Swing pivot length | Confirmation for swing anchors | 10 intraday, 15 on 4H+ | |
| Highest-volume lookback | Window for the volume-record anchor | 50 | |
| Primary stream | Stream selection; inner and outer band multiples | Which stream carries the bands, and how wide | Week Open; 1σ / 2σ |
| Clusters | Detection toggle, ATR tolerance | How close streams must be to form a zone | on; 0.25 ATR |
| Signals | Toggle, cooldown, signals to keep | The σ rejections | on; 10 bars; 6 |
| Colours | One per stream plus accent and neutral | Appearance | — |
| Dashboard | Position, four text sizes, title band, background, frame, grid, three text colours | Fully themeable | — |
Alerts
Six named conditions: Bullish Band Rejection, Bearish Band Rejection, Price Crossed Above Primary VWAP, Price Crossed Below Primary VWAP, VWAP Cluster Formed, and Sweep Anchor Reset.
How to use it
Read the week stream as the institutional benchmark. Above it with rising distance, the average weekly participant is in profit; a return to it is the decision level.
Treat the outer bands as stretch. A σ rejection at the outer band carries a reversion bias back toward the average — a fade with the stop beyond the wick, as the stop-loss page describes.
Enable the swing and sweep anchors to study reactions. Price returning to a sweep-anchored VWAP is returning to the average entry of the stop run — a level worth watching alongside the Liquidity Sweeps indicator.
Trade the clusters. Several independent volume-weighted averages agreeing on one price is the highest-value level the engine produces; watch first touch.
Follow the In Control row to pick the stream that deserves attention today, and the distance column to see what is nearby before it is hit.
Choose the primary stream for your horizon — Session Open for intraday, Month Open for swing.
Three ways to trade it
The VWAP reclaim.
Price loses the week VWAP, sweeps a low, and reclaims the average with a close — the sweep stream re-anchors from the run, and the reclaim is the entry with the stop beyond the sweep. The classic institutional "average is defended" trade.
The cluster reaction.
A week-VWAP, a swing-low VWAP and a sweep VWAP converge; price returns to the cluster and prints a σ rejection or an order-block reaction there. Highest-quality location the tool finds.
The band fade in a range.
With the Keltner Rings or Choppiness read confirming a range, the outer-band σ rejection back toward the average is the mean-reversion trade with the target at the VWAP itself.
Recommended settings by market
Crypto perpetuals, 1H–4H:
Week stream primary, swing anchors on (pivot 15), sweep anchor on; exchange volume makes every stream reliable.
Index futures and stocks, 5m–1H:
Session-open primary for the cash session; the highest-volume-bar anchor catches the opening drive.
Forex and gold:
Volume is tick volume on most feeds; the streams still work as structure, but weight the swing and sweep anchors over the volume-record anchor.
How it compares
Against TradingView's built-in anchored VWAP: that one needs a manual anchor and gives you one line; this runs seven self-anchoring streams with bands, clusters and a stability reading. Against session VWAP indicators: session VWAP is one of this engine's streams. Against the Institutional Volume Profile: the profile shows where volume sits by price; the engine shows the average price of participation since each event — complementary reads. Against Zeno: Zeno's signals come from structure and order flow; the VWAP streams are the participation context they can be read against.
Limitations
Volume quality determines VWAP quality; symbols with unreliable volume produce unreliable averages. Deviation bands need bars to mature after each re-anchor. Cluster detection reports convergence, not a guarantee of reaction. The In Control metric measures recent respect, not future behaviour.
Credits
The Volume Weighted Average Price was introduced by Berkowitz, Logue and Noser (1988); the anchored application was popularised by Brian Shannon. The multi-stream auto-anchoring engine, the liquidity-sweep anchor, the exact retroactive swing rebuild, confluence clustering, the In Control metric and all code are original work by Quantum Algo, published open source.
Step-by-step: adding it to your TradingView chart
Open the script page on TradingView (link above) and click Add to favorites, then Use on chart — or on any chart open Indicators, search "Anchored VWAP Engine Quantum Algo" and add it. Free on every TradingView plan.
Open the indicator's settings and set the inputs for your market and timeframe from the table above; the defaults are tuned for crypto on intraday and 4-hour charts.
In the Style tab, match the colours to your chart theme; the dashboard position and text size are in Inputs.
To set alerts, right-click the chart → Add alert, choose the indicator as the condition and pick the event; set "Once per bar close" so alerts match the closed-bar logic.
Save the layout, and add the other free Quantum Algo tools to it — they are designed to sit together.
To read or reuse the code, click Source code on the script page; republishing is subject to TradingView's house rules.
Inside the code, for developers
Pine Script, open source. Worth reading if you want to modify it: every detection and signal gated on barstate.isconfirmed; state held in capped arrays of drawing objects with explicit create, update and retire functions; statistics kept in first-in-first-out arrays with shrinkage and a Wilson bound computed inline; named alertcondition calls so webhooks receive a consistent payload. The Academy's Pine Script tutorials and the TradingView backtesting guide cover strategy conversion.
Using it with the other free indicators
The free tools layer on one chart: the Smart Money Concepts Engine for bias and the Confluence Score; Order Blocks with Volume, Fair Value Gaps + Inversion and Institutional Key Levels for the zone; Liquidity Sweeps, Sessionscope and Liquidation Magnet for the liquidity and the trigger; OTE + Silver Bullet for the time-qualified entry; the Institutional Volume Profile and Pressure Oscillator for whether volume agrees; and the trend and volatility family — the Adaptive Trend Sentinel, SuperTrend Engine, Golden Cross Engine, Anchored VWAP Engine, Trendline Architect, Keltner Rings and Volatility Storm Tracker — for regime, direction and the room a move has. The free-indicators hub lists every tool; the SMC guide is the method behind the layering.
Common mistakes with this indicator
- Trusting the developing bar — every event waits for the close.
- Trading every marker — the tool gives regime and context; the entry needs a structure level and a stop beyond it.
- Default lengths on the wrong timeframe — adjust the inputs, as the settings table shows.
- Reading the statistics as promises — they describe this chart's history, shrunk toward neutral on purpose.
- Stacking ten random scripts — the free tools layer because they were built to.
Want the signal, not just the structure?
Zeno reads Smart Money structure across timeframes and prints the entry, stop, TP1 and TP2 on your chart — with a public record of 160 posted trades, 120 wins and 40 losses at the stated levels. QuantumBot executes it on Bybit, Binance, OKX, Bitget and Kraken.

Glossary for this indicator
Frequently asked questions
Does the Anchored VWAP Engine repaint?
No. Anchor events are confirmed before they act, swing streams rebuild exactly from the confirmed pivot bar, and signals are evaluated on closed bars. Swing confirmation carries its standard pivot lag by design.
Why do I see only one line?
By default only the week-anchored stream is enabled for a clean first chart; every other anchor is a checkbox in Settings.
What makes the sweep anchor special?
It averages price and volume from the exact bar where stops were run — the basis of the participants who engineered the move — rather than from a calendar date or a swing alone.
Why is there no cluster or In Control reading?
Both compare multiple streams; enable two or more anchors and they activate.
Which markets should avoid it?
Any VWAP tool is only as good as the volume feed; on symbols with unreliable or synthetic volume, treat every stream with caution.
How does it relate to Zeno?
Zeno prints signals from structure with entry, stop and targets; the VWAP streams show the participation basis those signals form around. Run them together — Zeno for the trade, the streams for who is in profit.
Which anchored VWAP should I use?
The week open is the default institutional benchmark; session open for intraday, month open for swing; swing and sweep anchors for reactions. The picker above sets them by style.
What is the difference between VWAP and anchored VWAP?
Standard VWAP resets every session; anchored VWAP starts from an event you choose. The engine automates the choosing with seven event-driven streams.
Why do the bands look different from other VWAP bands?
They are built from the volume-weighted variance of the stream, not a plain price standard deviation — the correct construction, and rarer than it should be.
How many streams should I run?
Two or three. The tool is quiet by default because more lines rarely mean more information; enable the streams the picker suggests and let the In Control row tell you which matters.
Does it work on stocks?
Yes — exchange volume makes every stream reliable; the highest-volume-bar anchor catches the opening drive and earnings bars.
How does it relate to Zeno?
Zeno prints structure signals with stop and targets; the VWAP streams show whether the average participant is in profit at that level — location from Zeno, context from the streams.
The trend and volatility family
Regime, direction and room — the tools built to sit under the Smart Money layer.
Add Anchored VWAP Engine to your chart
One click on TradingView, free on every plan, code you can read. Nothing repaints.