How to Read Level 2: The Order Book, Explained for Traders
Level 2 is the order book: the resting limit orders at each price above and below the last trade, with the size at each level. Reading it means watching five things — the spread, the imbalance between bid and ask depth, whether size stacks or pulls as price approaches, how much trades against a level compared with what it displays, and the speed of the tape — and confirming every one of them with time and sales, because the book shows intent and only the tape shows what actually traded. Its horizon is seconds to minutes, and it is for timing entries, not choosing direction.
I spent my first year with a DOM buying stacked bids and wondering why they kept disappearing the moment I needed them. The book is a claim; the tape is the proof, and nobody told me to read them together. This page is the anatomy of the order book, the five things worth reading on it, the imbalance and spoof problem, the four book-plus-tape combinations and what each deserves, an ES morning read tick by tick into an order block, and where the whole approach fails. The tool scores depth against prints.
Indicators that prove themselves in public.
One engine, four precision tools — the Gold (XAU) Scalper, the institutional Gravity Zone, the Zeno momentum Oscillator, and Zeno Stocks for equities.



What Level 2 actually shows
Level 2 is the order book: the resting limit orders at every price above and below the last trade, with the size at each. Level 1 is the inside market — best bid, best ask, last trade. Level 2 shows the queue behind them, usually five to ten levels each side on a broker screen and the full depth on a futures platform. Some platforms call it market depth, depth of market or DOM; in US equities the term still means the display of each market maker's or ECN's quote at each price, which is where the name comes from.
What the book shows is intent. A 400-lot on the bid at 5,221.75 is a trader saying they want to buy there; it is not a trade, and it can be cancelled a millisecond before it would have filled. That is why Level 2 on its own is a poor predictor and why the traders who use it well read it together with time and sales — the tape — which shows what actually traded, at what price and against which side. The book is the map; the tape is the traffic.
What Level 2 does not show: hidden size (see iceberg orders), orders on other venues in fragmented markets, stop orders (which are not in the book until they trigger), and anything about the next hour. Its horizon is seconds to a few minutes. Anyone using it to decide a swing trade is reading the wrong screen.
The anatomy of the book
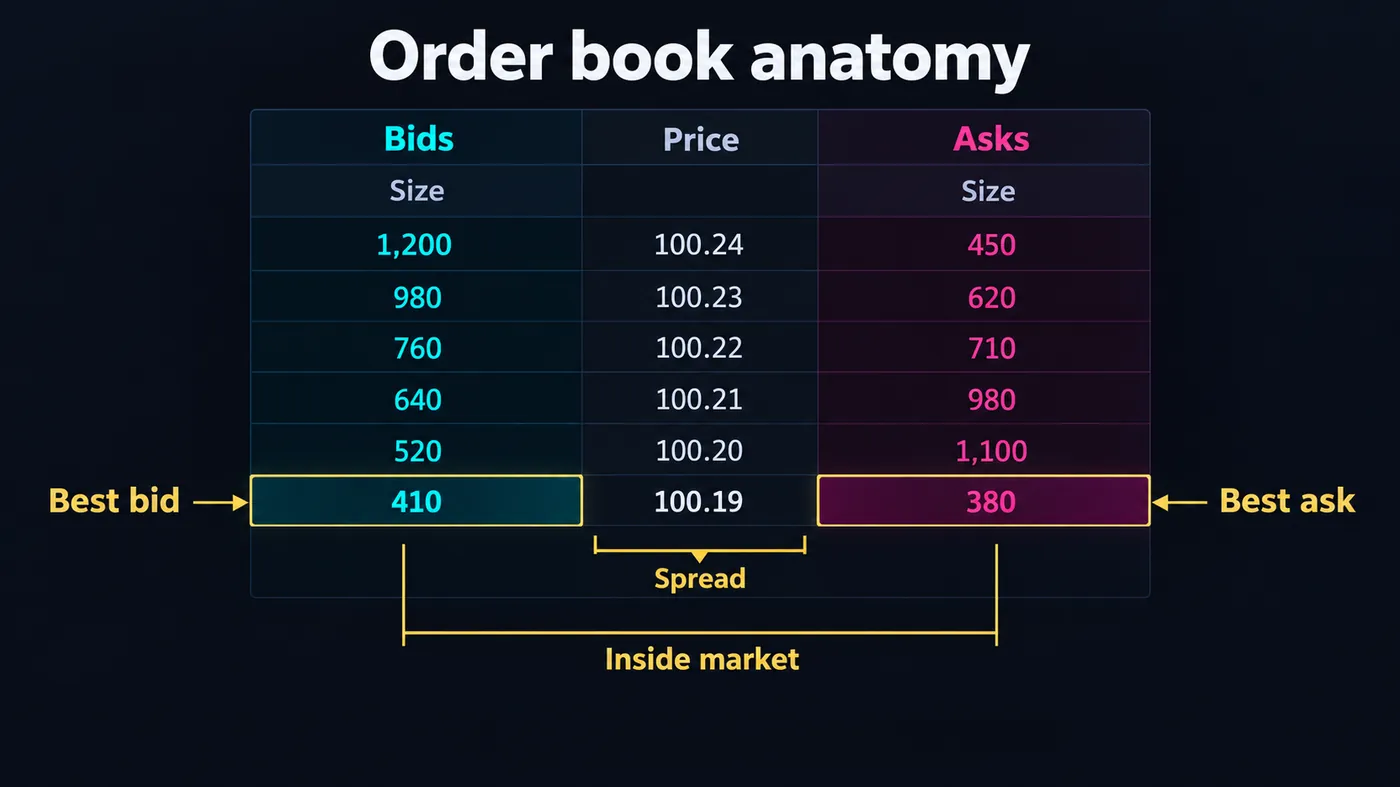
| Element | What it is | How to read it |
|---|---|---|
| Best bid / best ask | Highest resting buy, lowest resting sell | The inside market. The spread between them is the cost of immediacy |
| Size at level | Contracts or shares resting at that price | Big numbers are intent, not action; watch whether they get traded into or pulled |
| Depth | How many levels are shown, and the cumulative size | Thin depth = small orders move price; thick depth = a level can absorb |
| Market maker / ECN ID (equities) | Which participant posted the quote | Mostly noise now; the same firm can post on several IDs |
| Time and sales | Each executed trade: time, price, size, side | The truth. A print at the ask is a buyer lifting; at the bid, a seller hitting |
| Traded-at-level column (futures DOMs) | Volume executed at each price this session | Compare to displayed size: far more traded than shown = hidden liquidity |
The colours on most platforms follow one convention: bids green or blue, asks red, prints coloured by which side was aggressive. Learn the convention of your platform before you trust a reading; a few reverse it.
The five things to read
1. The spread. One tick on ES and NQ, one cent on liquid US stocks, sometimes several ticks on crypto altcoins and thin small caps. A widening spread means liquidity is leaving — usually right before a data release, at the close, or in a fast market. Trade smaller or not at all when the spread is more than double its normal width.
2. Imbalance. Total bid size over the top few levels against total ask size. Heavily stacked bids with thin offers means the next move up meets little resistance, so a small buyer can lift several levels. It also means someone may be advertising demand they do not have. Imbalance only becomes information when the tape confirms it: prints at the bid against a stack that does not shrink is absorption; a stack that vanishes when price approaches is a spoof.
3. Pulling and stacking. Watch whether the size at a level grows as price approaches (stacking — someone is defending) or evaporates (pulling — someone was never going to fill). Pulled bids as price falls into them are the most common intraday trap in equities: the book looks like support until it is needed.
4. Prints against the level. Time and sales beside the book. When 600 trade at the bid and the bid still shows 60, hidden size is refilling it — an iceberg. When 600 trade at the bid and the bid drops to 2, the level is done. The relationship between what traded and what is displayed is the single most useful thing on the screen.
5. Speed. The rate of prints. A tape that goes from ten prints a minute to two hundred is a market that has found a reason; the direction of those prints (mostly at the ask, mostly at the bid) tells you which side arrived. Speed without direction is a data release; speed with direction is a move.

Automate your trades. Let Quantum Algo trade for you.
Every signal executed on your own account — on your account, with the plan you define.
Imbalance, stacking and the spoof
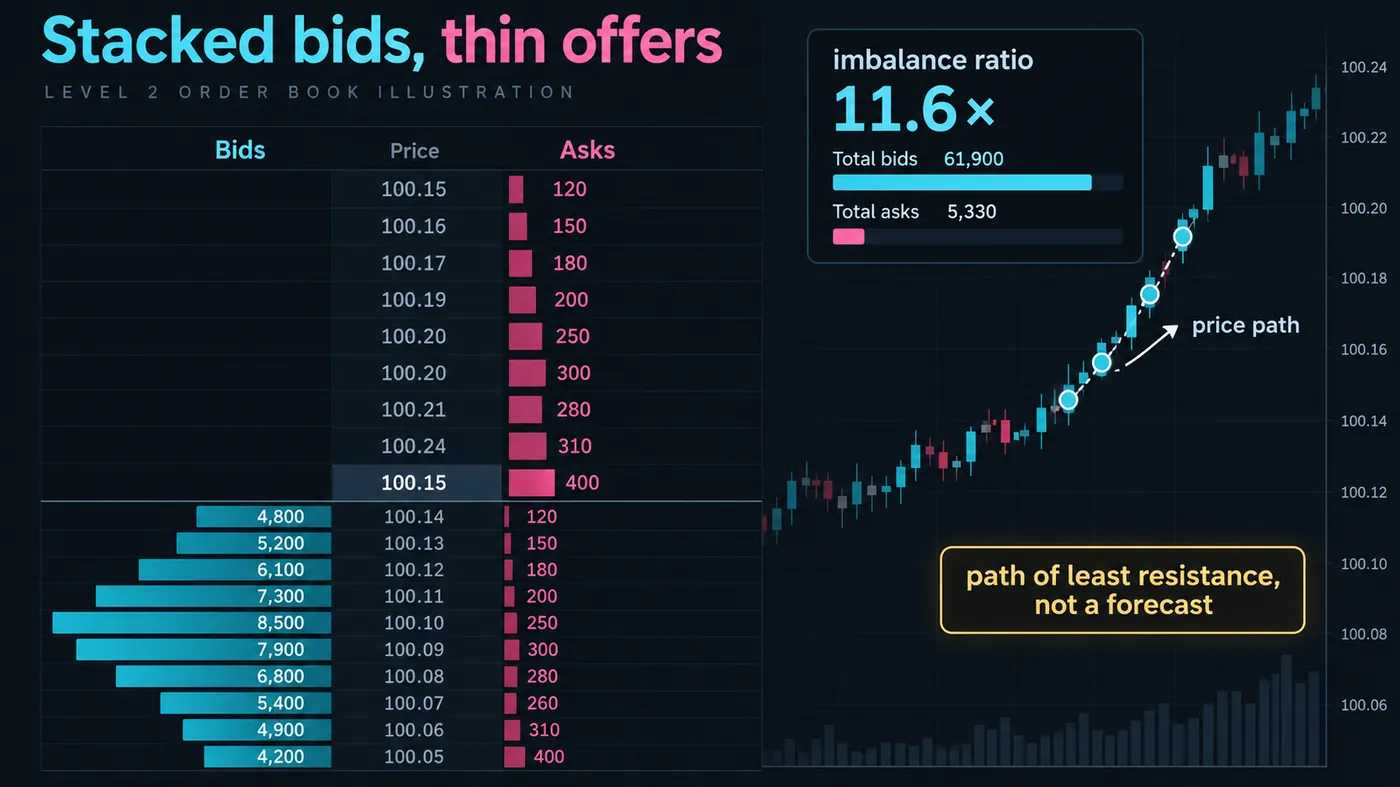
The screen above is the situation beginners are taught to buy: bids stacked five deep, offers thin, price already ticking up. It works about as often as it fails, and the difference is whether the stack has been traded into. Large displayed size that nobody has hit is exactly what a spoofer posts to move price a tick or two before cancelling — it is illegal on regulated futures and equity venues and has drawn nine-figure fines, and it still happens on crypto exchanges every hour. Large displayed size that is being hit, with prints at that price and the size holding, is a real buyer. The tool below scores both.
The honest use of imbalance is short-horizon and directional: when the book is one-sided and the tape agrees, the next few ticks are more likely to go with the imbalance than against it. That is enough to time an entry you already had a reason for — a order block retest, a sweep that has just failed — a tick or two better. It is not enough to be the reason.
Order book imbalance tool
Put in the summed bid and ask depth over the top five levels, the prints on each side over the last minute and the spread. The tool returns the imbalance, which side is aggressive, and the reading that combination usually deserves.
Level 2 and the tape together
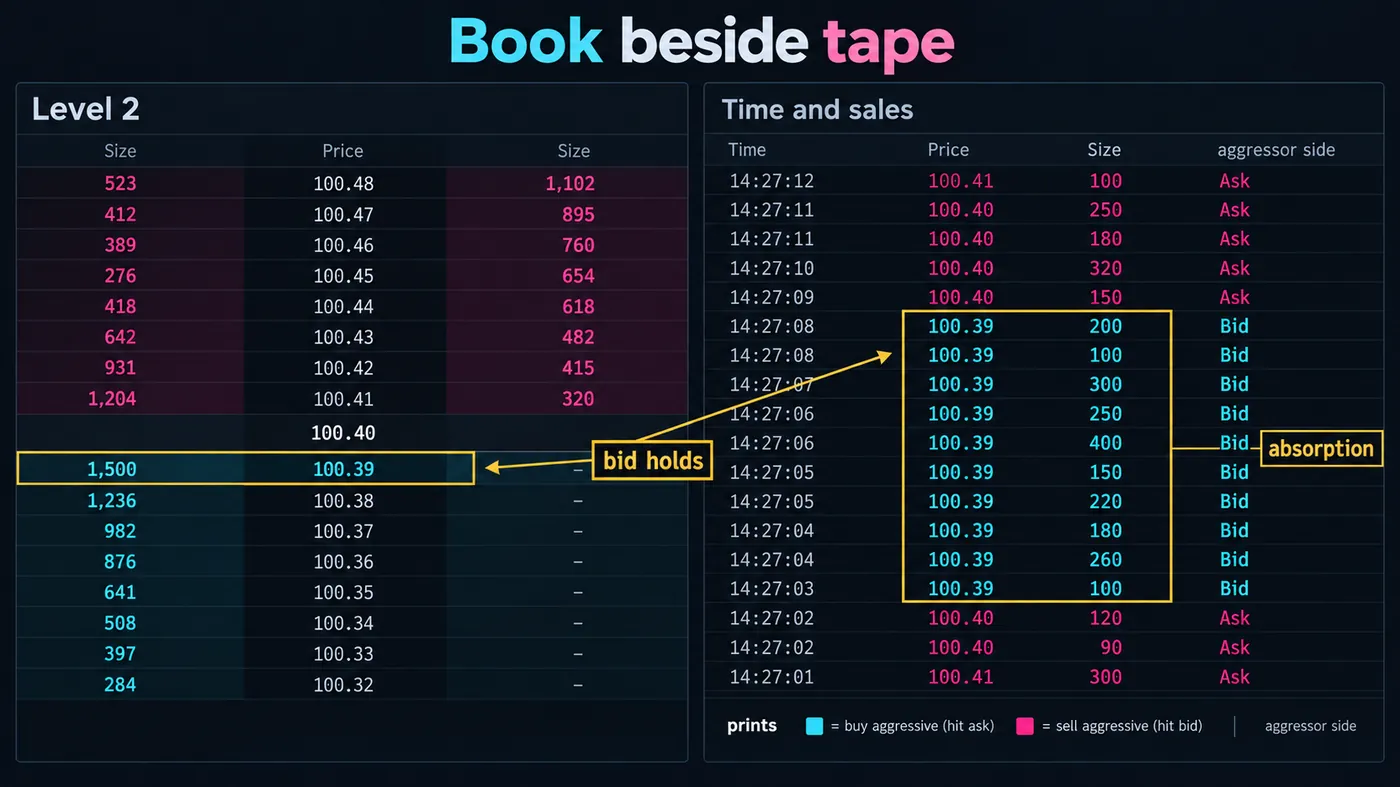
The screen that matters is the two side by side. On the left, the book: size at each price. On the right, the tape: what traded. The four combinations cover most of what you will see.
| Book | Tape | Reading | What to do |
|---|---|---|---|
| Bids stacked | Prints at the bid, bid holds | Absorption — a real buyer is defending | Lean long against the level, stop one or two ticks under |
| Bids stacked | Prints at the bid, bid pulls | The stack was decoration | Stand aside; price usually falls through |
| Bids stacked | Prints at the ask | Buyers already lifting; the stack is behind them | Chase only with a reason from the chart; the move may be a tick or two |
| Book balanced | Tape fast and one-sided | A participant has arrived | Follow the aggressor for the next few ticks; do not fade speed |
| Offers stacked | Prints at the ask, offer holds | Absorption on the offer | Lean short, stop above the level |
| Thin both sides | Sparse prints | No liquidity — lunch, pre-news, off-hours | Do nothing; the next order of size will gap the book |
A working rule: never act on the book alone. Every reading above needs the tape column to be one thing or the other. A screen with depth and no time-and-sales is half a screen.
Reference data
| Item | Value |
|---|---|
| Level 1 | Best bid, best ask, last trade — the inside market |
| Level 2 | Resting limit orders at multiple price levels on each side, with size (also market depth, DOM) |
| Level 3 | Full order-by-order data with queue position; exchange members and data vendors only |
| What it shows | Displayed resting orders — intent |
| What it does not show | Hidden/iceberg size, stop orders, orders on other venues, anything beyond the next few minutes |
| Confirmation source | Time and sales: actual executions with price, size and aggressor side |
| Core readings | Spread, imbalance, stacking vs pulling, prints vs displayed size, speed |
| Where it works | Centralised, liquid, single-venue markets: CME futures (ES, NQ, CL, ZN), large-cap equities in regular hours, BTC and ETH on a major exchange |
| Where it is weak | Fragmented equities pre-market, thin small caps, altcoins with wash volume, any market during a data release |
| Platforms | Sierra Chart, Jigsaw, ATAS, Quantower, Bookmap, NinjaTrader SuperDOM; broker Level 2 on Thinkorswim, IBKR TWS, Webull; TradingView DOM via a connected broker |
Worked example: ES, reading the book into an order block
ES on a Wednesday morning, 10:40 ET. A 15-minute bullish order block sits from 5,838.50 to 5,840.25 and price is falling into it after the 10:00 macro ran the highs. On the DOM, the bid at 5,840.00 shows 85 and at 5,839.75 shows 140 — nothing unusual. At 10:41:30 price touches 5,840.00 and the tape shows 210 contracts hit that bid in fifteen seconds. The bid still shows 85. At 10:42:05 another 340 hit it; the bid shows 92. Three hundred and fifty contracts through a level that displayed 85 and it has grown.
Meanwhile the offers above are thin: 5,840.25 shows 30, 5,840.50 shows 45. Summed depth over the top five levels is 1,240 on the bid and 410 on the ask — the numbers pre-loaded in the tool, which reads it as absorption with sellers aggressive. That is the entry: long at 5,840.25 lifting the thin offer, stop at 5,839.25, four ticks under the absorbing bid. Target the 10:20 swing high at 5,846.50, twenty-five ticks, 6R on paper; realistically the first partial at 5,843.00 where the next stack sat.
The move: 5,843.00 by 10:47, 5,846.25 by 10:58, one tick short of the target before the 10:50 macro ran the low of the morning and stopped everyone who was late. Thirteen ticks banked on the first partial, twenty-three on the runner trailed under the 10:50 low. The book did not find the trade — the order block did. The book said the block was being defended, and said it four ticks before the chart could.
Where reading Level 2 fails
Fragmented markets. US equities trade on sixteen exchanges and dozens of dark pools; the Level 2 your broker shows is one venue's book or a consolidated feed that lags. The size you see at $184.50 on NYSE is not the size at $184.50 in the market. For stocks, the tape matters far more than the book.
Spoofing and layering. Size that appears and vanishes. The defence is the rule above: size that has not been traded into is not information. On crypto exchanges, where enforcement is thin, assume every large resting order is a spoof until prints say otherwise.
Hidden orders. Icebergs and fully hidden orders (which some venues allow) mean the real liquidity at a level can be ten times what is displayed. Read the traded-at-level column, not the displayed size.
Speed. Around a data release the book turns over faster than a human can read. Screenshots of Level 2 at 08:30:02 tell you nothing. Wait for the second minute.
Confirmation bias. A trader who wants to be long sees stacked bids everywhere. Write the rule down before the session: what has to be true in the book and on the tape for you to act. Then only act when it is.
Mistakes traders make with Level 2
- Buying a stack that has not been hit. Displayed size is a claim. Prints are proof.
- Reading the book without time and sales. Half the screen, half the information.
- Using it to decide direction for the day. The book's horizon is minutes. Direction comes from structure.
- Trusting equity Level 2 as if it were a futures DOM. Fragmentation means the visible book is a fraction of the real one.
- Fading speed. A fast one-sided tape is a participant with size; you do not know when they are finished.
- Watching every tick. Level 2 is for the entry and the exit, not for the four hours in between. Most traders who stare at it all day are worse for it.
Level 2 and the free indicators
No Pine script can see the order book, and TradingView only shows a DOM through a connected broker. What the library offers is the chart-side echo of what the book shows: the Pressure Oscillator flags bars with heavy volume and little range — absorption seen from the candle — and Order Blocks with Volume ranks the levels most likely to have a defender. For the book itself you need a futures platform or Bookmap. The premium engine, Zeno, prints signals with a stop and targets; the book is how I time the entry on those signals by a tick or two, and nothing more.
The book shows what people say they will do; the tape shows what they did. Read the spread, the imbalance, whether size stacks or pulls, how much has traded against each level, and how fast the prints come — and act only when the tape agrees with the book. Use it to time entries at levels the chart gave you, on liquid centralised markets, and ignore it around news and on fragmented or thin ones.
◆ Interactive check
Do you know what the book is telling you?
Questions traders ask about Level 2
Level 2 market data shows the order book: the resting limit orders at each price above and below the current price, with the size at each level. Level 1 shows only the best bid, best ask and last trade. Futures traders usually call the same display the DOM or market depth.
Read five things: the spread, the imbalance between bid and ask depth, whether size stacks or pulls as price approaches it, how much has traded at a level compared with what it displays, and the speed of the tape. Then confirm each with time and sales, because the book shows intent and only the tape shows what traded.
For timing entries and exits on liquid, centralised markets — CME futures, large-cap equities in regular hours, BTC and ETH on a major exchange — yes. For choosing direction, no; its horizon is minutes. Most day traders use it to get a tick or two better on an entry the chart already gave them.
Level 2 is the book of orders that have not yet executed. Time and sales is the record of orders that did execute, with price, size and which side was aggressive. The book says what people intend; the tape says what happened. Read them together.
The difference between total bid depth and total ask depth over the top few levels, usually expressed as a ratio or a percentage. A bid-heavy book means the next move up meets less resting resistance. It becomes tradable only when the tape confirms it — prints into the stack that hold it, rather than a stack nobody has tested.
Posting large orders with no intention to fill them, to push price a tick or two before cancelling. It is illegal on regulated exchanges and prosecuted, and common on crypto exchanges. The defence is simple: size that has not been traded into is not information.
Less well than for futures, because US equities trade across sixteen exchanges and many dark pools, so the book your broker shows is one venue or a lagging consolidation. For stocks, weight time and sales far more heavily than displayed depth.
Only through a connected broker that supplies depth; TradingView itself does not carry order-book data, and Pine Script cannot read it. For a full DOM use a futures platform such as Sierra Chart, Jigsaw, ATAS or Quantower, or a heatmap tool like Bookmap.
Full order-by-order data including queue position and order IDs, available to exchange members and data vendors. It is what academic order-flow research and HFT firms work from; retail platforms reconstruct a subset of it as the DOM.
No Pine script can read the book. The Pressure Oscillator shows absorption from the candle side — heavy volume with little range — and Order Blocks with Volume ranks the levels most likely to have a defender. Zeno, the premium engine, prints signals with stops and targets; the book is how you time them, not what generates them.
References & Related Guides
Read next
- Order Flow Trading
- Iceberg Orders
- Footprint Chart Trading
- Cumulative Volume Delta (CVD)
- Bookmap Review
- Order Types Explained
- What Is Slippage in Trading?
- Order Blocks: Complete Guide
- Institutional Order Flow — Academy
- Absorption — glossary
- Pressure Oscillator (free indicator)
- Zeno — the premium engine