Tick Index: How to Read the NYSE TICK for Intraday Timing
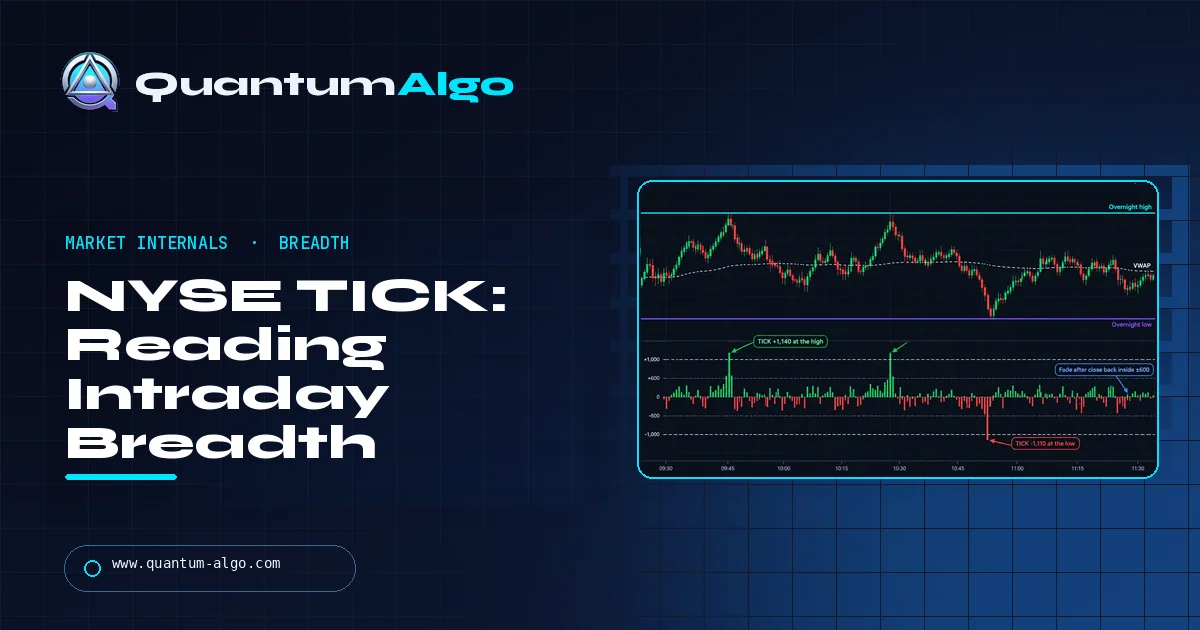
The tick index (NYSE TICK) is the number of NYSE stocks whose last trade was an uptick minus the number whose last trade was a downtick, updated every few seconds during market hours. Readings inside about ±400 are noise, while readings beyond ±1,000 show broad program buying or selling that intraday ES and SPY traders use for timing.
At 9:34 the TICK prints +1,020 and half the chat rooms yell "sell the extreme." Twenty minutes later ES is 15 points higher, because it was a trend day and the extreme was confirmation, not exhaustion. That gap between what the TICK says and what traders hear is what this guide fixes. Quantum Algo walks through how the number is built, which TradingView symbol is which, what normal and extreme readings really look like, how to build cumulative TICK, and the two playbooks that depend on reading the day type first.
Indicators that prove themselves in public.
One engine, four precision tools — the Gold (XAU) Scalper, the institutional Gravity Zone, the Zeno momentum Oscillator, and Zeno Stocks for equities.
What does the TICK index actually count?
Every NYSE-listed stock has a last trade and a trade before that. If the last print was higher than the one before it, the stock is on an uptick. If it was lower, it is on a downtick. The NYSE TICK takes a snapshot of the whole exchange, counts the stocks sitting on an uptick, counts the stocks sitting on a downtick, and subtracts one from the other. Stocks whose last trade was unchanged are ignored.
TICK = (NYSE stocks whose last trade was an uptick) − (NYSE stocks whose last trade was a downtick)A quick example. Say that at 10:14:05 ET, 1,800 NYSE issues last traded higher than their previous print, 1,100 last traded lower and 300 were unchanged. The TICK reads +700. Five seconds later a block of sell programs hits the S&P 500 names, 900 stocks flip to downticks, and the reading swings to about −1,100. Nothing about the size of those trades shows up. A one-lot uptick in a small cap counts exactly the same as a 50,000-share uptick in JPMorgan.
That is the whole personality of the indicator in two lines:
- It is a vote count, not a volume measure. Each stock gets one vote, so the TICK tells you how broad the buying or selling is right now, not how heavy.
- It is instantaneous. It describes the last trade in each name, so it reacts within seconds to basket orders, index arbitrage and program trading that hits hundreds of stocks at once. That is why futures traders watch it: a sudden +1,000 usually means someone is lifting a large slice of the index simultaneously.
Charting platforms turn that stream of snapshots into ordinary candles. On a 1-minute TICK chart, the open is the first reading of the minute, the high is the most positive reading, the low is the most negative reading and the close is the last one. Keep that in mind, because a 1-minute bar with a high of +1,050 and a close of +200 tells a very different story from a bar that closes at +1,050. Most of the threshold rules you read online refer to the highs and lows of those bars, while cumulative TICK uses the closes.
The TICK also only exists while NYSE is open, 9:30 a.m. to 4:00 p.m. Eastern. There is no premarket or overnight TICK, which matters if you trade ES or NQ around the clock. For the broader family of breadth tools that the TICK belongs to, our advance-decline line guide covers the slower, end-of-day cousin.
TICK, TICKQ, TICKI and the composite versions
"The TICK" almost always means the NYSE TICK, but there are several siblings, and they do not produce the same numbers. Before you copy a threshold from a forum post, check which one the author was looking at. Here are the versions you can pull up on TradingView today, all listed under the USI prefix (US statistical indices). We checked each symbol page directly.
| TradingView symbol | What TradingView calls it | Universe | Practical range |
|---|---|---|---|
USI:TICK | NYSE TICK | NYSE-listed stocks | Mostly within ±1,000, extremes beyond |
USI:TICK.NY | NYSE TICK indicator | NYSE stocks (separate feed calculation) | Similar to TICK, values not identical |
USI:TICK.US | US stocks TICK indicator | Composite of US-listed stocks | Larger swings because more stocks vote |
USI:TICKQ | Nasdaq combined TICK | Nasdaq-listed stocks | Wider and noisier than NYSE TICK |
USI:TICKI | Dow Jones Industrial TICK | The 30 Dow stocks | Cannot exceed ±30 |
The TICKI row is a handy reminder that the range of any TICK is capped by how many stocks are in the basket. With 30 Dow components, +30 means every single one is on an uptick at the same moment, which only happens when a program buys the whole basket. A +22 TICKI is therefore a much bigger deal than a +700 NYSE TICK.
Which one should you use? For ES and SPY, the NYSE TICK has the longest history of published thresholds and the most traders watching it, so its extremes tend to be self-reinforcing reference points. If you trade NQ or QQQ, put TICKQ beside it. Tech-led sessions often show Nasdaq breadth running ahead of or against NYSE breadth, and that split is itself information, similar to the intermarket comparisons in our SMT divergence guide.
Other platforms use different tickers for the same data: $TICK on thinkorswim and Sierra Chart, ^TICK on NinjaTrader with Kinetick, $TICK.NT on some TradeStation setups, according to NexusFi's platform notes. If you use thinkorswim, our thinkorswim review covers where its market internals live.
What is a normal TICK reading, and what counts as extreme?
Every guide quotes ±1,000 as "extreme." That number is roughly right, but the more useful question is how often readings actually land there, and the answer depends on the period you measure. Here is what the published sources say, side by side:
| Source | Noise / neutral | Strong | Extreme |
|---|---|---|---|
| Christopher Terry, Active Trader (April 2002) | Around ±100 in strong-trend pullbacks | ±500 (overbought / oversold) | ±1,000 |
| Tim Racette, See It Market (2016) | Inside ±400, ignore | — | ±1,000 "very strong"; typical span ±1,500 |
| NexusFi summary of a 2011 member study | Average 1-min high +250 / low −250 | About two-thirds of readings inside ±700 | About 95% inside ±1,040 |
| McClellan Financial (Tom McClellan) | — | — | Beyond ±1,000 intraday |
So, as a working zone map for the NYSE TICK on 1-minute bars:
- Inside ±400: background noise. Do not react.
- ±600 to ±1,000: a real push. Worth noting which side keeps printing these.
- Beyond ±1,000: a broad, simultaneous wave of buying or selling, usually program-driven. Rare enough to matter, common enough that you will see several on an active day.
- Beyond ±1,300 to ±1,500: climactic. These cluster around the open, big data releases and the close.
Two refinements make this map far more useful than a fixed rule.
The distribution moves with volatility. In a quiet, low-volatility month you may go a whole session without a +1,000. In a high-volatility stretch you might see ten. NexusFi's write-up suggests building your own distribution from 20 to 60 recent sessions and calling the top and bottom few percent "extreme." That beats any number copied from a 2002 magazine.
There is a positive bias. Tom McClellan notes that raw TICK data spends more time above zero than below it, and that this is a feature to adjust for, not an error. In practice that means a −600 can be a slightly stronger statement than a +600 on the same day. Look at the median of the last few sessions rather than assuming zero is neutral.
Time of day matters too. Readings are widest in the first 30 minutes and the last 20 minutes, when opening auctions, index rebalances and market-on-close orders hit hundreds of names at once. A +1,200 at 9:34 is ordinary. A +1,200 at 1:15 p.m., in the dead middle of lunch, deserves attention.
Cumulative TICK: the running total that shows who controlled the session
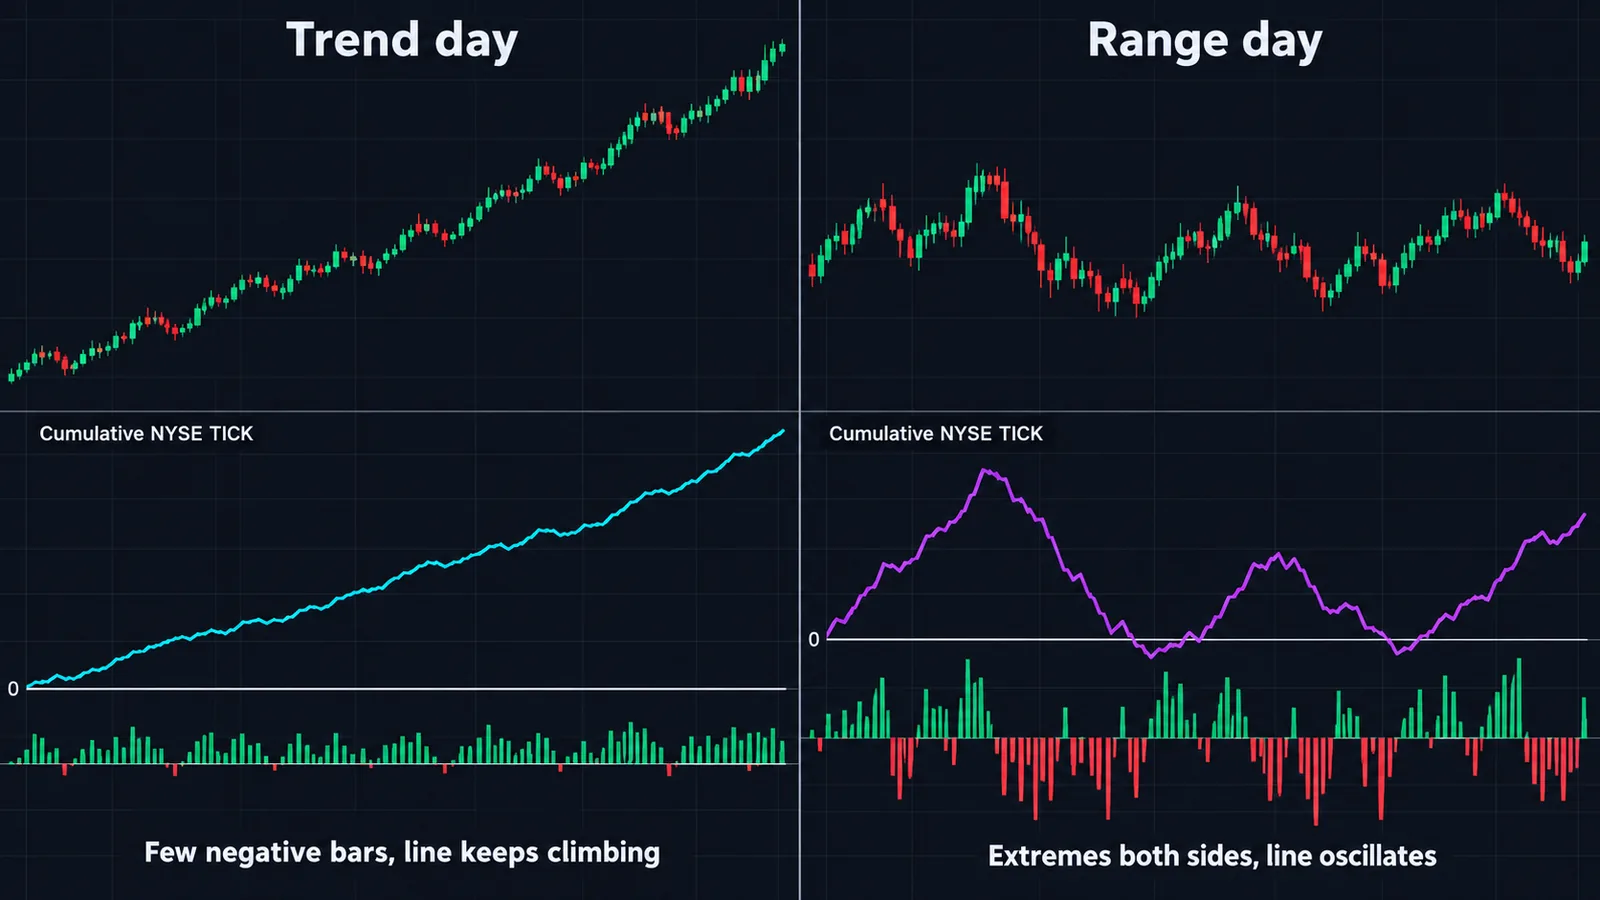
Single TICK readings flicker. Cumulative TICK adds up the closing value of each bar since the open, so it smooths the flicker into a line that rises when upticks dominate bar after bar and falls when downticks do. The math is a plain running sum, reset to zero at 9:30 each day:
CumTICK(t) = CumTICK(t−1) + TICK close(t), starting at 0 on the first bar of the sessionHere is a worked example using fifteen 1-minute closes from a choppy open (values are illustrative, the arithmetic is exact):
| Bar | TICK close | Cumulative | What you would see |
|---|---|---|---|
| 9:31 | +220 | +220 | Mild opening bid |
| 9:32 | +410 | +630 | |
| 9:33 | +650 | +1,280 | |
| 9:34 | +1,020 | +2,300 | Upside extreme |
| 9:35 | +780 | +3,080 | |
| 9:36 | +300 | +3,380 | Cumulative peaks |
| 9:37 | −150 | +3,230 | First negative close |
| 9:38 | −420 | +2,810 | |
| 9:39 | −880 | +1,930 | |
| 9:40 | −1,110 | +820 | Downside extreme |
| 9:41 | −640 | +180 | |
| 9:42 | −200 | −20 | Cumulative crosses zero |
| 9:43 | +90 | +70 | |
| 9:44 | +350 | +420 | |
| 9:45 | +520 | +940 | Back to a modest positive |
Fifteen minutes in, the cumulative line is +940, about an average of +63 per bar, and 9 of 15 closes were positive. It has already printed one extreme on each side. That pattern, extremes on both sides and a cumulative line that rolls over and comes back, is the fingerprint of a two-way session. Fades of extremes tend to work on days like this.
Compare a trend-up open where ten closes read +310, +450, +820, +1,050, +600, +380, +520, +910, +240, +660. The cumulative line climbs to +5,940 without a single negative bar. Nobody should be fading +1,000 readings on that tape. You would be selling into a market where every dip in TICK stops above zero.
Three details that most write-ups skip:
- The sampling interval changes the scale. Summing 1-minute closes gives a number roughly five times bigger than summing 5-minute closes over the same morning. Compare slopes and shapes, not absolute levels, and never mix intervals.
- Reset daily. A cumulative TICK carried across days mostly measures that positive bias McClellan describes, and it drifts upward forever.
- Slope beats level. A cumulative line at +8,000 that has been flat for an hour says the morning buyers are done. A line at −1,500 that has been rising for 40 minutes says sellers have lost control, even though the level is still negative.
If you already use cumulative volume delta on the futures themselves, think of cumulative TICK as the same idea applied across the cash stocks instead of one contract's order book.
How do traders use TICK to time ES and SPY entries?
TICK is a timing tool. It rarely tells you what to trade, but it is good at telling you when the stock market underneath the index is stretched. The two classic playbooks depend on what kind of day it is, which is why reading cumulative TICK first matters.
Playbook 1: fade extremes on a two-way day
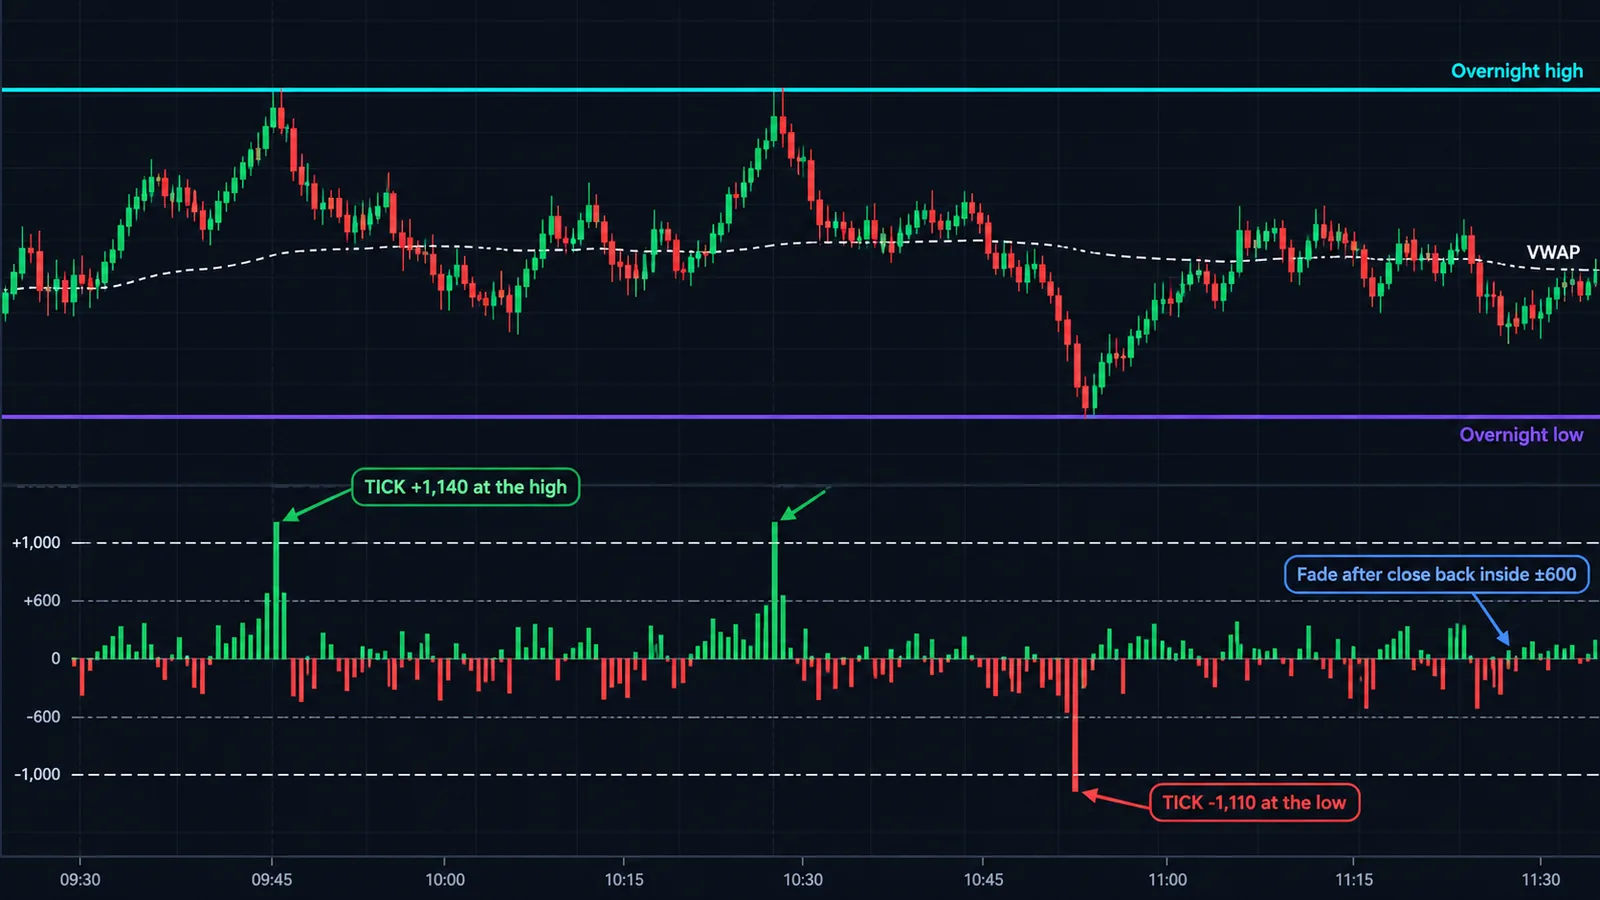
Conditions: cumulative TICK flat or oscillating, readings printing extremes on both sides, ES rotating inside the prior day's range or around VWAP.
- Mark the levels that matter before the open: overnight high and low, prior day high and low, VWAP.
- Wait for price to reach one of those levels at the same time as a TICK extreme in the same direction (for example, ES tagging the overnight high while TICK prints +1,000 or more).
- Enter against the move only after the TICK bar closes back inside ±600. The extreme is the program finishing, not the turn itself.
- Stop beyond the level, target VWAP or the middle of the range.
Worked numbers, hypothetical: ES rallies into an overnight high at 5,812.25 while TICK prints a +1,140 high, then the next 1-minute TICK bar closes at +380. You sell 5,812.00 with a stop at 5,816.25 (4.25 points, or $212.50 per contract at $50 a point) and a target at VWAP, 5,804.25 (7.75 points, $387.50). That is a 1.8 to 1 reward-to-risk trade, and the TICK reading did the job of telling you the buy program had run its course at a level where sellers were likely waiting. For more on why those levels attract the fade, see our liquidity sweep guide.
Playbook 2: buy the shallow TICK pullback on a trend day
Conditions: cumulative TICK rising steadily, most closes above zero, few or no readings below −600, ES holding above VWAP.
- Ignore +1,000 readings as sell signals. On trend days they are confirmation.
- Wait for TICK to pull back toward zero or slightly below (roughly 0 to −400) while ES holds above VWAP or a rising short moving average.
- Enter long when TICK turns back up from that dip. Terry's 2002 article made the same observation: in strong uptrends, countertrend pullbacks often keep the TICK hovering near −100 to +100 rather than reaching real negative extremes.
- A TICK reading below −800 on a day you had pegged as trend-up is your warning that the regime may be changing.
Mirror both playbooks for down days. The main skill is classification, and you can get a decent read on it within the first 45 to 60 minutes from three things: the cumulative TICK slope, the share of closes above zero, and whether price is holding one side of VWAP. Our list of the best indicators for the S&P 500 pairs well with this if you want a trend filter on top.
TICK divergences: what they mean and when they lie
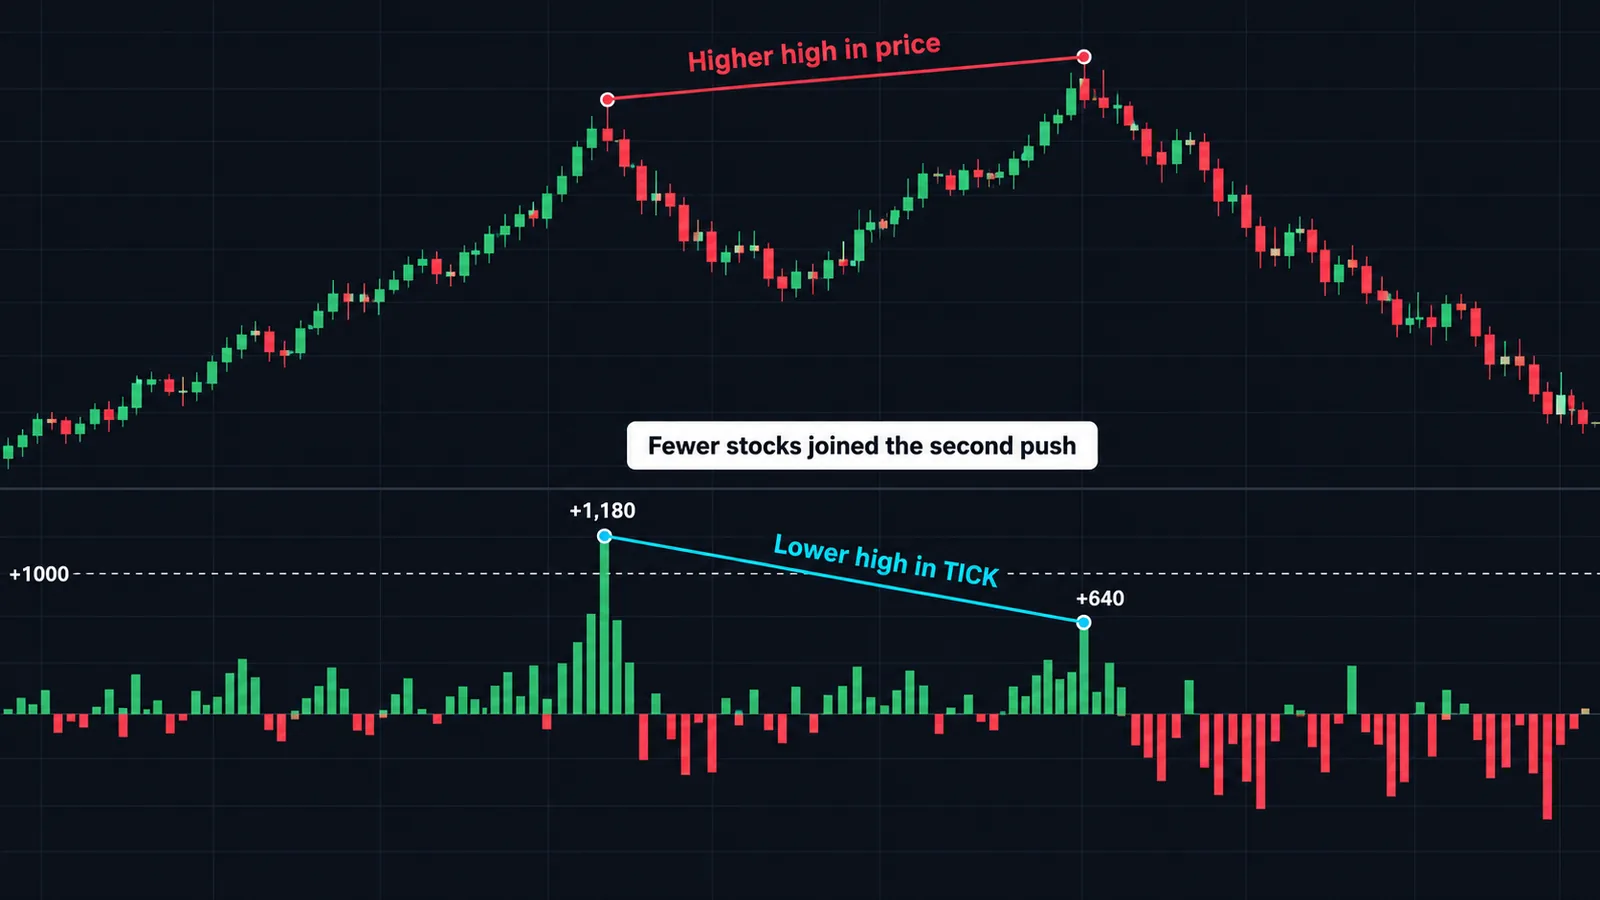
Terry credits Laurence Connors and Linda Bradford Raschke's Street Smarts with popularizing the TICK divergence, and it is still the most quoted setup. The idea: ES makes a new intraday high, but the TICK high that goes with it is clearly lower than the TICK high that came with the previous price high. Fewer stocks joined the second push, so the rally is running on a narrower base.
Example: at 10:05 ES tags 5,790.50 with a TICK high of +1,180. At 10:48 ES pushes to 5,793.75, a new high, but the best TICK print on that push is +640. That is a bearish divergence of 540 TICK points against a 3.25-point higher high.
How to make the setup more reliable:
- Require a meaningful gap in TICK. A +1,050 versus a +980 is noise. Look for the second peak to be at least a few hundred points lower.
- Demand a level. Divergences at a prior day high, overnight high or VWAP band are worth trading. Divergences in the middle of nowhere are not.
- Check cumulative TICK. If the cumulative line is still climbing steeply, the divergence is probably just the trend pausing.
- Use the right TICK for the instrument. A divergence on NYSE TICK while NQ makes new highs may only mean tech is leading. Check TICKQ before shorting Nasdaq on it.
When they lie: on strong trend days, TICK peaks naturally fade as the day goes on because the early-morning programs are done, yet price keeps grinding higher. Shorting every lower TICK high on those afternoons is how breadth traders give back a week of profits. The same divergence logic applied to futures order flow appears in our delta divergence guide, and the two together are stronger than either alone.
TICK vs the advance-decline line, ADD and VOLD
TICK is one of several breadth gauges built from the same NYSE stock list. They answer different questions, so it helps to see them next to each other.
| Gauge | What it compares | Speed | Best question it answers |
|---|---|---|---|
TICK (USI:TICK) | Stocks on an uptick vs downtick, right now | Seconds | Is a broad program hitting the market this minute? |
ADD (USI:ADD) | Stocks up on the day vs down on the day | Minutes to hours | How many stocks are participating in today's move? |
VOLD (USI:VOLD) | Volume in advancing vs declining stocks | Minutes to hours | Where is the share volume going? |
| Advance-decline line | Running total of daily net advances | Days to months | Is the broad market confirming the index trend? |
| McClellan Oscillator | EMAs of daily net advances | Days to weeks | Is breadth momentum overbought or washed out? |
The key difference between TICK and ADD trips people up. A stock that is up 2% on the day but just printed a downtick counts as an advance in ADD and a downtick in TICK. So ADD can sit at +1,500 all afternoon while TICK swings ±800 every few minutes. ADD tells you the day's character; TICK tells you the next five minutes.
A sensible stack for index futures: daily breadth from the advance-decline line and the McClellan Oscillator for context, ADD and VOLD for today's character, TICK for the entry. Some traders add the put/call ratio as a sentiment overlay. If you trade crypto, there is no exchange-wide TICK, but the logic carries over to the crypto market breadth indicators we covered separately.
How to set up TICK on TradingView
TradingView treats the TICK like any other symbol, so setup takes two minutes. If you are new to the platform, our TradingView platform guide covers layouts and multi-chart grids.
- Open a dedicated layout. Keep your main chart untouched and create a two-pane layout: ES1! or SPY on the left, the TICK on the right.
- Type the symbol. In the right-hand chart, search
USI:TICKfor the NYSE TICK. AddUSI:TICKQin a third pane if you trade Nasdaq. - Use a 1-minute timeframe and switch the TICK chart to bars or candles so you can see each minute's high and low, not just the close.
- Draw horizontal lines at +1,000, +600, 0, −600 and −1,000. Adjust them after a few weeks of watching your own distribution.
- Sync the crosshair and interval across panes so a TICK spike lines up with the matching price bar.
- Check the data status label on the TICK chart. Statistical indices can arrive on a different data arrangement from the futures feed, and a delayed TICK is worse than none.
To plot cumulative TICK in a pane under SPY or ES, a short Pine Script v6 indicator is enough:
//@version=6
indicator("Cumulative NYSE TICK")
t = request.security("USI:TICK", timeframe.period, close, gaps = barmerge.gaps_on)
var float cum = 0.0
if timeframe.change("D")
cum := 0.0
if not na(t)
cum += t
plot(cum, "Cumulative TICK")
hline(0)
The gaps_on setting matters on an ES chart. ES trades nearly around the clock while the TICK only exists during NYSE hours, and without it the script would keep re-adding the last 4:00 p.m. value through the overnight session. On ES the daily reset follows the futures session (6:00 p.m. ET), which still works because no TICK values arrive between the cash close and 9:30.
Alerts: you can set a TradingView alert directly on USI:TICK crossing +1,000 or −1,000. Fire it once per bar close, not on every tick, or you will get a dozen pings in the first minute of the session.
When the TICK misleads you: the common mistakes
TICK is honest about what it measures, but traders routinely ask it questions it cannot answer. The failure modes worth knowing:
- Fading extremes on a trend day. The most expensive mistake by far. If cumulative TICK is climbing steadily and readings rarely dip below zero, a +1,100 is a confirmation, not a top.
- Reading the open and close like midday. Opening auctions, index rebalances and market-on-close orders push hundreds of stocks at once. Extremes in the first few minutes and the final 15 minutes are routine.
- Trading TICK through news. CPI, payrolls and FOMC minutes create several minutes of whipsaw where TICK swings from −1,200 to +1,000 and back. Wait for the dust to settle.
- Mixing feeds.
USI:TICK,USI:TICK.NYandUSI:TICK.USare different calculations, and broker feeds differ again. A level calibrated on one does not carry to another. - Ignoring market structure changes. Tom McClellan points out that with high-speed trading spread across many venues, it is hard even to say whether a stock is "on an uptick" at a given instant. TICK still works as a breadth snapshot, but the thresholds published decades ago came from a different market.
- Treating every stock as equal when the index is not. The S&P 500 is cap-weighted. A handful of mega-caps can carry ES higher while most NYSE names tick down, so a weak TICK does not always mean ES has to fall.
- Using it outside cash hours. There is no TICK before 9:30 or after 4:00 ET. Overnight ES and NQ moves need other tools, such as futures order flow.
- Treating it as a standalone signal. A TICK extreme in the middle of a range, away from any level, is just a busy minute.
There is also no rigorous public study we could find that measures the edge of TICK fades or divergences on current market data. The practitioner sources are consistent, but they are practitioner sources. Test any rule on your own instrument and session before trusting it with size.
Tick Index and Quantum Algo
TICK works best as a context layer on top of a signal that already defines entry, stop and target. That is how we would combine it with Quantum Algo tools.
- As a filter for index signals. Zeno Stocks covers NAS100 and SPX500 and gives buy and sell signals with a stop and targets built in. Before taking a Zeno long during the cash session, check the cumulative TICK slope. Rising or flat is fine. Falling hard with repeated −1,000 prints says the broad market is leaning against you, and passing on that one trade is a reasonable rule to test.
- For timing inside a signal. If a signal fires while TICK is printing an extreme in the same direction, waiting one or two bars for TICK to settle often gives a better fill on the same idea.
- With free tools. Our free open-source Anchored VWAP Engine and Sessionscope mark the levels and session windows where TICK extremes are most worth acting on.
You can check how Zeno signals have played out on the public track record, and the free QuantumAlgo Academy covers the price-action levels referenced throughout this guide. TICK will not tell you which way to trade on its own. Used as a filter and a timer, it keeps you out of a lot of bad fades.
◆ Interactive check
How well do you know the NYSE TICK?
Questions traders ask about the NYSE TICK
There is no good or bad reading, only context. Readings inside about ±400 are noise, ±600 to ±1,000 show a real push, and beyond ±1,000 is a broad program wave. Whether that is bullish or a fade depends on whether the day is trending or rotating.
It means at least 1,000 more NYSE stocks last traded on an uptick than on a downtick at that moment, usually because a basket or program order is buying many stocks at once. On a range day it often marks a short-term high; on a trend day it confirms the trend.
Use USI:TICK for the NYSE TICK. TradingView also lists USI:TICK.NY, USI:TICK.US (a US composite), USI:TICKQ (Nasdaq combined) and USI:TICKI (Dow 30). They are different calculations, so calibrate thresholds on the one you actually watch.
TICK counts NYSE-listed stocks, TICKQ counts Nasdaq-listed stocks. TICKQ tends to be wider and noisier and is more relevant for NQ and QQQ, while the NYSE TICK has the longest history of published thresholds for ES and SPY.
No. The TICK is only calculated while the NYSE regular session is open, 9:30 a.m. to 4:00 p.m. Eastern. Overnight futures moves need other tools such as order flow or volume profile.
Cumulative TICK is a running sum of each bar's TICK close since the session open. A steadily rising line points to a trend-up day, a falling line to a trend-down day, and a flat oscillating line to a two-way day where fading extremes tends to work.
TICK compares each stock's last trade with its previous trade, so it changes every few seconds. The advance-decline line uses each stock's change from the prior close and is usually tracked daily, so it describes the broad trend over days and months rather than the next few minutes. See our advance-decline line guide.
Partly. NYSE TICK still reflects the broad US market, but NQ is driven by a narrow group of large tech stocks. Watch TICKQ alongside it, and treat a split between the two as a sign that the move is sector-led.
Most intraday traders watch 1-minute TICK bars, using the bar highs and lows for extremes and the closes for cumulative TICK. Longer bars hide the spikes that make the TICK useful, although a 5-minute view helps judge the session's overall tilt.
It is a coincident indicator that updates very quickly, so it can show a broad program hitting stocks a moment before the index future fully reflects it. It does not forecast direction on its own, which is why it works best as a timing filter at levels you already planned to trade.
References & Related Guides
Read next
- What Is the Advance-Decline Line and How Do You Use It?
- VWAP
- Put/Call Ratio
- Cumulative Volume Delta
- What Is the Best Indicator for S&P 500 (SPX500)?
- Order Flow Trading
- SMT Divergence
- thinkorswim Review
- Liquidity Sweep Trading
- Delta Divergence
- Free TradingView indicators
- Zeno — the premium engine
Primary sources
- TradingView — NYSE TICK (USI:TICK) symbol page
- TradingView — Nasdaq Combined TICK (USI:TICKQ) symbol page
- TradingView — Dow Jones Industrial TICK (USI:TICKI) symbol page
- McClellan Financial — TICK: Not Just a Bloodsucking Insect
- Active Trader (Christopher Terry) — Intraday Trading with the TICK
- See It Market — How To Fade The NYSE Tick When Trading E-Mini S&P 500
- NexusFi Academy — NYSE TICK Index for Futures Trading