Trendline Architect [Quantum Algo]
Automatic trendlines that have to earn their place: validated before they are drawn, promoted only after the market touches them three times, graded when they break, watched for the retest, and paired into channels — with one-letter B and R signals and no spaghetti.
The short answer
Trendline Architect is a free, open-source TradingView indicator that does what most automatic trendline tools skip: it validates every line before drawing it, makes each line earn its status through real touches, grades every breakout by quality, and automates the break-and-retest sequence trendline traders normally track by hand. Lines are born as dotted candidates, promoted to solid confirmed trendlines only after the market validates them with a third touch, graded on breakout, kept on a retest watch after they break, and paired into parallel channels automatically — with a deliberately quiet chart: one-letter B and R signals whose full context lives in the hover tooltip. The problem it solves is trendline spaghetti: it rejects invalid lines at birth, refuses duplicates, caps lines per side, silences breaks of unproven lines by default, and filters weak breakouts by grade.
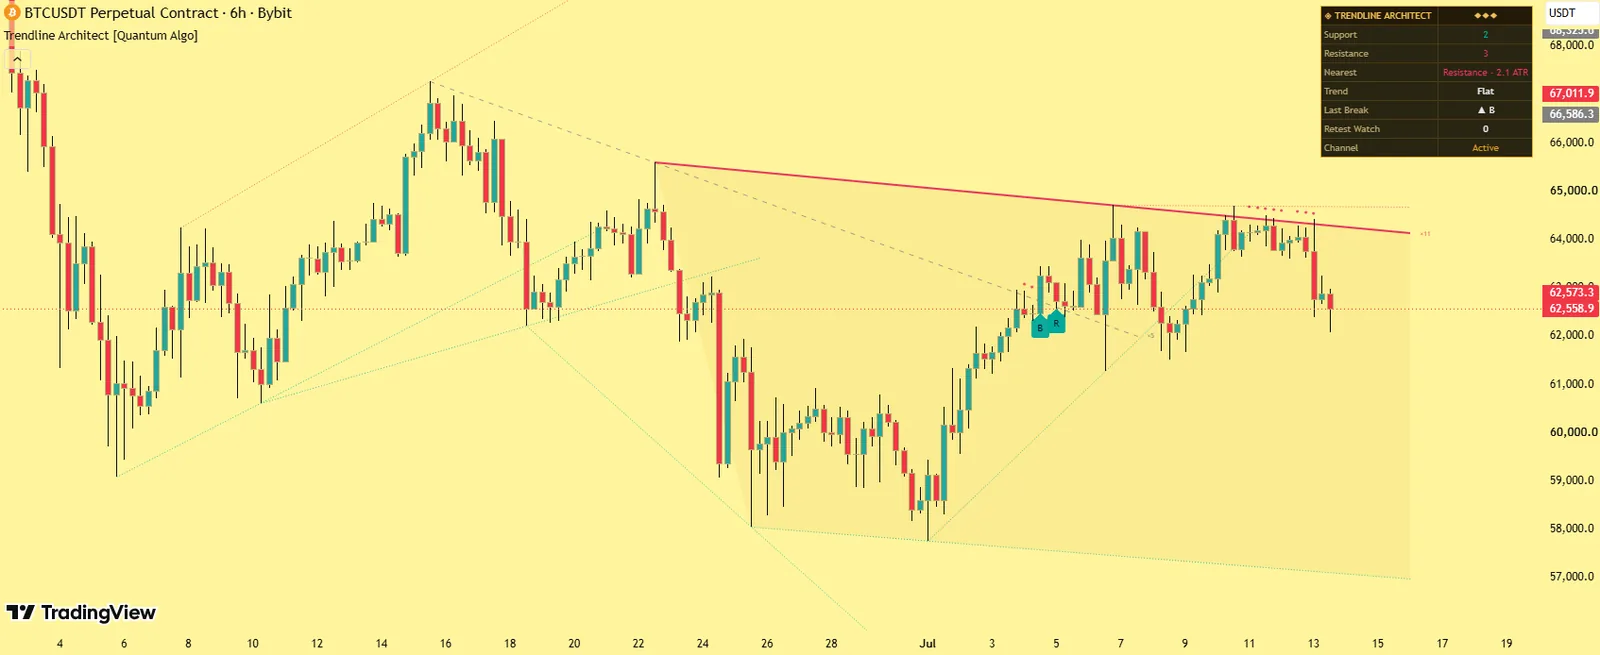
Candidate (dotted), confirmed (solid ×N) and watch (grey) lines, graded B breakouts, R retests, channel fills and a dashboard.
Geometric validity at birth plus a touch-earned lifecycle — only lines the market respects survive.
No — confirmed pivots; touches, breaks and retests on closed bars.
What a trendline break and retest is
A trendline connects successive swing points and acts as dynamic support or resistance while price respects it. A breakout is a decisive close through the line. The retest is what disciplined traders wait for next: price returning to the broken line from the other side and rejecting — old support acting as new resistance, or old resistance reclaimed as support. That return-and-reject is one of the most traded patterns in classical charting, and this engine detects the entire sequence automatically: validated line, graded break, watch window, confirmed retest. Our trendline guide covers drawing them by hand; this page is the tool.
What it draws
Candidate lines
Dotted, untagged, anchored on confirmed pivots and geometrically validated.
Confirmed trendlines
Solid, thicker, fully coloured, with a live ×N touch tag once the confirming touch arrives; validated touches marked with dots.
Watch lines
Grey dashed lines where a trendline broke, kept for the retest window.
B signals
Graded breakouts (A, B, C); grade A in the accent colour.
R signals
Confirmed retests of broken lines: the polarity flip, automated.
Channel fills
When an active support and resistance line run parallel.
The dashboard
Active support and resistance counts, the nearest line with its ATR distance, a trend read from confirmed slopes, the last break grade, the retest watch count, and channel status.
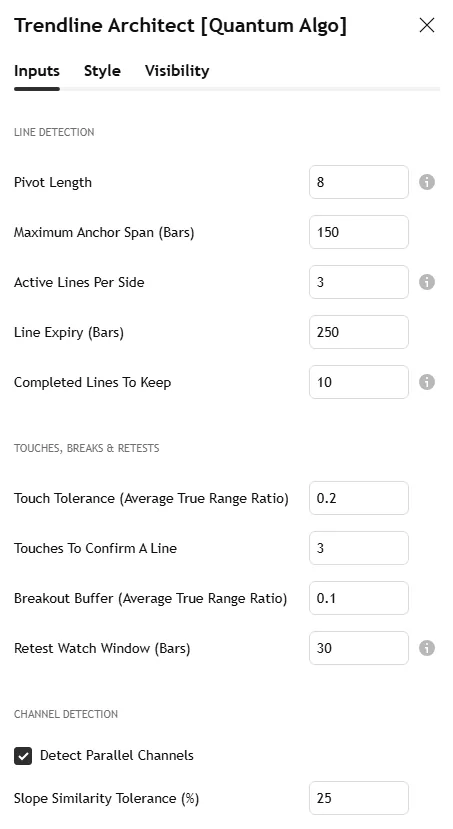
The Bitcoin 6-hour screenshot on this page shows candidate, confirmed and watch lines with a graded breakout; the settings screenshot shows the Inputs tab.
Why it is different
Geometric validity at birth.
A candidate is rejected before it is drawn if any candle close violated the segment between its two anchor pivots.
Touch-earned lifecycle.
Each validated touch — a wick into tolerance with a close that respects the line — is counted; only at the configured count is the line promoted. The chart itself shows which lines the market obeys.
Anti-spaghetti engineering.
Duplicates with similar slope and position are refused, each side is capped with the weakest evicted first, and stale lines expire by age.
Breakout quality grading.
Volume z-score, penetration depth in ATR units and breakout-candle body ratio combine into A, B or C.
A retest engine.
Broken lines become watch lines; a return with a rejecting close prints R.
Silence by default.
Breaks of unconfirmed lines retire silently and breakouts below the minimum grade stay off the chart and out of the alerts — both filters ship enabled.
Automatic channels.
Parallel opposite-side lines within a slope tolerance are filled and reported.
How it works
Line construction. Each new confirmed pivot is paired with the previous same-side pivot; the segment is checked for historical violations, duplicates rejected, side capacity enforced.
Touch validation. A touch counts only when the wick enters the tolerance band and the close still respects the line; touches accumulate on the tag, and the confirming touch promotes the line.
Breakouts. A close through the line beyond the buffer triggers the break; confirmed lines produce graded signals; the broken line converts to a grey watch line.
Retests. Within the watch window, a return with a rejecting close prints R — an upward reclaim of broken resistance, or a downward rejection at broken support. Watch lines with no retest expire.
Channels. Active opposite-side lines are compared by slope; the closest parallel pair is filled.
Non-repainting. Pivots require confirmation; touches, promotions, breaks and retests are evaluated on closed bars.
Settings
| Group | Input | What it does | Where to start |
|---|---|---|---|
| Detection | Pivot length | Anchor significance | 10 intraday, 15–20 on 4H+ |
| Maximum anchor span | How far apart anchors may be | 200 bars | |
| Active lines per side | The cap | 3 | |
| Line expiry, completed lines to keep | Ageing and history | 300 bars; 6 | |
| Touches, breaks, retests | Touch tolerance | Band around the line | 0.25 ATR |
| Touches to confirm | Promotion threshold | 3 | |
| Breakout buffer | Close beyond the line by | 0.15 ATR | |
| Retest watch window | Bars a broken line stays watched | 40 | |
| Signals | Breakout and retest toggles, confirmed-lines-only filter, minimum grade | The noise filters | on / on / on / B |
| Channels | Detection toggle, slope tolerance | Parallel pairs | on; 12% |
| Visuals | Colours, extension length, touch dots | Appearance | — |
| Dashboard | Position, four text sizes, title band, background, frame, grid, three text colours | Themeable | — |
Alerts
Six named conditions: Trendline Confirmed, Bullish Trendline Breakout, Bearish Trendline Breakout (honouring the grade filter), Bullish Retest Confirmed, Bearish Retest Confirmed, and Parallel Channel Detected.
How to use it
Trust the visual hierarchy. Dotted is a candidate, solid with ×N is market-validated, grey dashed is broken and on watch.
Treat B as regime information. A grade-A breakout with volume and penetration carries far more weight than a minimum-grade one; the grade is one hover away.
Trade R. The broken line has flipped roles and price has confirmed the flip — stop on the far side of the retested line, as the stop-loss page describes.
Read the Nearest row to know how far price is from the closest active line before it gets there.
Raise the pivot length for larger structures; disable the two filters if you want the raw feed.
Three ways to trade it
The retest entry.
A grade-A bearish breakout of a confirmed support line, then R on the return to the underside — short with the stop above the line, target the next Institutional Key Level.
The channel edge.
With a channel detected, fade the edges toward the middle while the Choppiness Index reads range; trade the breakout when it grades A.
The confirmation stack.
An R signal at the same price as an order block from Order Blocks with Volume and a swept level from Liquidity Sweeps — three independent reasons at one level.
Recommended settings by market
Crypto perpetuals, 1H–6H:
Pivot 15, lines per side 3, minimum grade B.
Forex and gold, 15m–1H:
Pivot 10, touch tolerance 0.3 ATR (spread noise), minimum grade B.
Indices and stocks, 15m–daily:
Pivot 10–20; volume grading is at its best here.
How it compares
Against typical auto-trendline scripts: those draw every pivot pair and alert on every violation; this validates at birth, requires earned touches, grades breaks, watches for retests and caps everything. Against Institutional Key Levels: horizontal levels versus sloped lines — the two together cover the whole structure map. Against Zeno: Zeno's entries come from order flow; a confirmed retest that coincides with a Zeno signal is the highest-quality version of both.
Limitations
Trendlines are geometry, not guarantees: valid lines break and graded breakouts fail. Pivot confirmation delays anchor recognition by design. Volume grading is less meaningful on symbols with unreliable volume. Channel detection reports the closest parallel pair, not every possible channel.
Credits
Trendline analysis, breakout trading and the break-and-retest pattern are classical charting techniques in the public domain. The geometric validity engine, touch-earned lifecycle, breakout grading model, retest watch engine, channel detection, noise-filtering architecture and all code are original work by Quantum Algo, published open source.
Step-by-step: adding it to your TradingView chart
Open the script page on TradingView (link above) and click Add to favorites, then Use on chart — or on any chart open Indicators, search "Trendline Architect Quantum Algo" and add it. Free on every TradingView plan.
Open the indicator's settings and set the inputs for your market and timeframe from the table above; the defaults are tuned for crypto on intraday and 4-hour charts.
In the Style tab, match the colours to your chart theme; the dashboard position and text size are in Inputs.
To set alerts, right-click the chart → Add alert, choose the indicator as the condition and pick the event; set "Once per bar close" so alerts match the closed-bar logic.
Save the layout, and add the other free Quantum Algo tools to it — they are designed to sit together.
To read or reuse the code, click Source code on the script page; republishing is subject to TradingView's house rules.
Inside the code, for developers
Pine Script, open source. Worth reading if you want to modify it: every detection and signal gated on barstate.isconfirmed; state held in capped arrays of drawing objects with explicit create, update and retire functions; statistics kept in first-in-first-out arrays with shrinkage and a Wilson bound computed inline; named alertcondition calls so webhooks receive a consistent payload. The Academy's Pine Script tutorials and the TradingView backtesting guide cover strategy conversion.
Using it with the other free indicators
The free tools layer on one chart: the Smart Money Concepts Engine for bias and the Confluence Score; Order Blocks with Volume, Fair Value Gaps + Inversion and Institutional Key Levels for the zone; Liquidity Sweeps, Sessionscope and Liquidation Magnet for the liquidity and the trigger; OTE + Silver Bullet for the time-qualified entry; the Institutional Volume Profile and Pressure Oscillator for whether volume agrees; and the trend and volatility family — the Adaptive Trend Sentinel, SuperTrend Engine, Golden Cross Engine, Anchored VWAP Engine, Trendline Architect, Keltner Rings and Volatility Storm Tracker — for regime, direction and the room a move has. The free-indicators hub lists every tool; the SMC guide is the method behind the layering.
Common mistakes with this indicator
- Trusting the developing bar — every event waits for the close.
- Trading every marker — the tool gives regime and context; the entry needs a structure level and a stop beyond it.
- Default lengths on the wrong timeframe — adjust the inputs, as the settings table shows.
- Reading the statistics as promises — they describe this chart's history, shrunk toward neutral on purpose.
- Stacking ten random scripts — the free tools layer because they were built to.
Want the signal, not just the structure?
Zeno reads Smart Money structure across timeframes and prints the entry, stop, TP1 and TP2 on your chart — with a public record of 160 posted trades, 120 wins and 40 losses at the stated levels. QuantumBot executes it on Bybit, Binance, OKX, Bitget and Kraken.

Glossary for this indicator
Frequently asked questions
Does Trendline Architect repaint?
No. Anchors are confirmed pivots and every touch, break and retest is evaluated at bar close; pivot confirmation introduces intentional lag equal to the pivot length.
Why do I see so few lines?
By design: geometric validation, duplicate rejection, side caps and expiry leave only lines with genuine market respect. Raise the per-side cap or lower the confirmation count for a busier chart.
What do B and R mean?
B is a graded breakout and R a confirmed retest of the broken line; hover either for direction, grade, volume and penetration.
Why did a breakout print no signal?
Either the line was unconfirmed while the confirmed-only filter is on, or the break graded below your minimum. The line still changed state; only the signal was filtered.
What makes a grade-A breakout?
Elevated volume, deep penetration beyond the line in ATR terms, and a strong-bodied breakout candle — all three together.
How does it relate to Zeno?
Zeno prints signals from order flow with stop and targets; Trendline Architect gives the sloped structure those signals form against, and the R retest often lands on the same bar.
How is this different from drawing trendlines myself?
It applies the rules a disciplined chartist uses — anchor on confirmed pivots, reject lines price already violated, count real touches, wait for the retest — automatically and without the spaghetti, on every timeframe at once.
Why did a line disappear?
It expired by age, was evicted as the weakest on a full side, or broke and its retest window closed without a retest.
What counts as a touch?
A wick into the tolerance band around the line with a close that still respects it. Three touches (by default) promote a candidate to a confirmed line.
Can I get an alert on a trendline break?
Yes — Bullish and Bearish Trendline Breakout (honouring the grade filter), plus Retest Confirmed both ways, Trendline Confirmed and Parallel Channel Detected.
Does it draw channels?
Automatically: when an active support and resistance line run parallel within the slope tolerance, the channel is filled and reported.
How does it relate to Zeno?
Zeno prints signals from order flow with stop and targets; a confirmed R retest on the same bar as a Zeno entry is the highest-quality version of both.
The trend and volatility family
Regime, direction and room — the tools built to sit under the Smart Money layer.
Add Trendline Architect to your chart
One click on TradingView, free on every plan, code you can read. Nothing repaints.