Liquidation Magnet [Quantum Algo]
Estimated liquidation pools from swing structure and leverage tiers, merged into decaying volume-weighted clusters, drawn as heat ladders with a gold beam to the strongest one — and a dashboard that measures how often the purges reverse. Honest about being an estimate.
The short answer
Liquidation Magnet is a free, open-source TradingView indicator that estimates where over-leveraged long and short positions are likely to be liquidated, builds decaying volume-weighted clusters at those levels, and renders them as heat ladders on the chart. A gold magnet beam locks onto the strongest nearby pool, purge flashes mark the moment price sweeps through a cluster, and a statistics panel tracks how often those sweeps actually reverse on the exact symbol and timeframe you trade. One thing stated up front, as the script itself states it: every level is an estimate derived from price structure and the fixed mathematics of leverage — TradingView indicators cannot read exchange liquidation feeds or order books, and any tool claiming otherwise is guessing with extra steps. This one guesses transparently, then measures itself.
Estimated liquidation pools from swing anchors and leverage tiers (10×, 25×, 50×, 100×), merged into weighted clusters that decay and die.
Heat ladders, a gold beam to the strongest pool, purge flashes, and reversal statistics after purges — on your chart.
Estimates from structure, not exchange data; the dashboard reports its own hit rate.
What a liquidation magnet is
When traders open leveraged positions near a swing high or low, their liquidation prices sit at fixed, mathematically determined distances from their entries. A crowd of 25× longs opened near a swing low is liquidated roughly 4% below it; a crowd of 50× shorts near a swing high roughly 2% above it. Those liquidation prices are where forced market orders wait. Forced orders are fuel; markets are drawn toward fuel — sweep the pool, fill the orders, and very often reverse once the fuel is spent. That pull is the magnet. Our liquidation and leverage guides cover the mechanics; this indicator maps the pockets, weighs them and watches them get consumed.
What it draws
Heat ladders
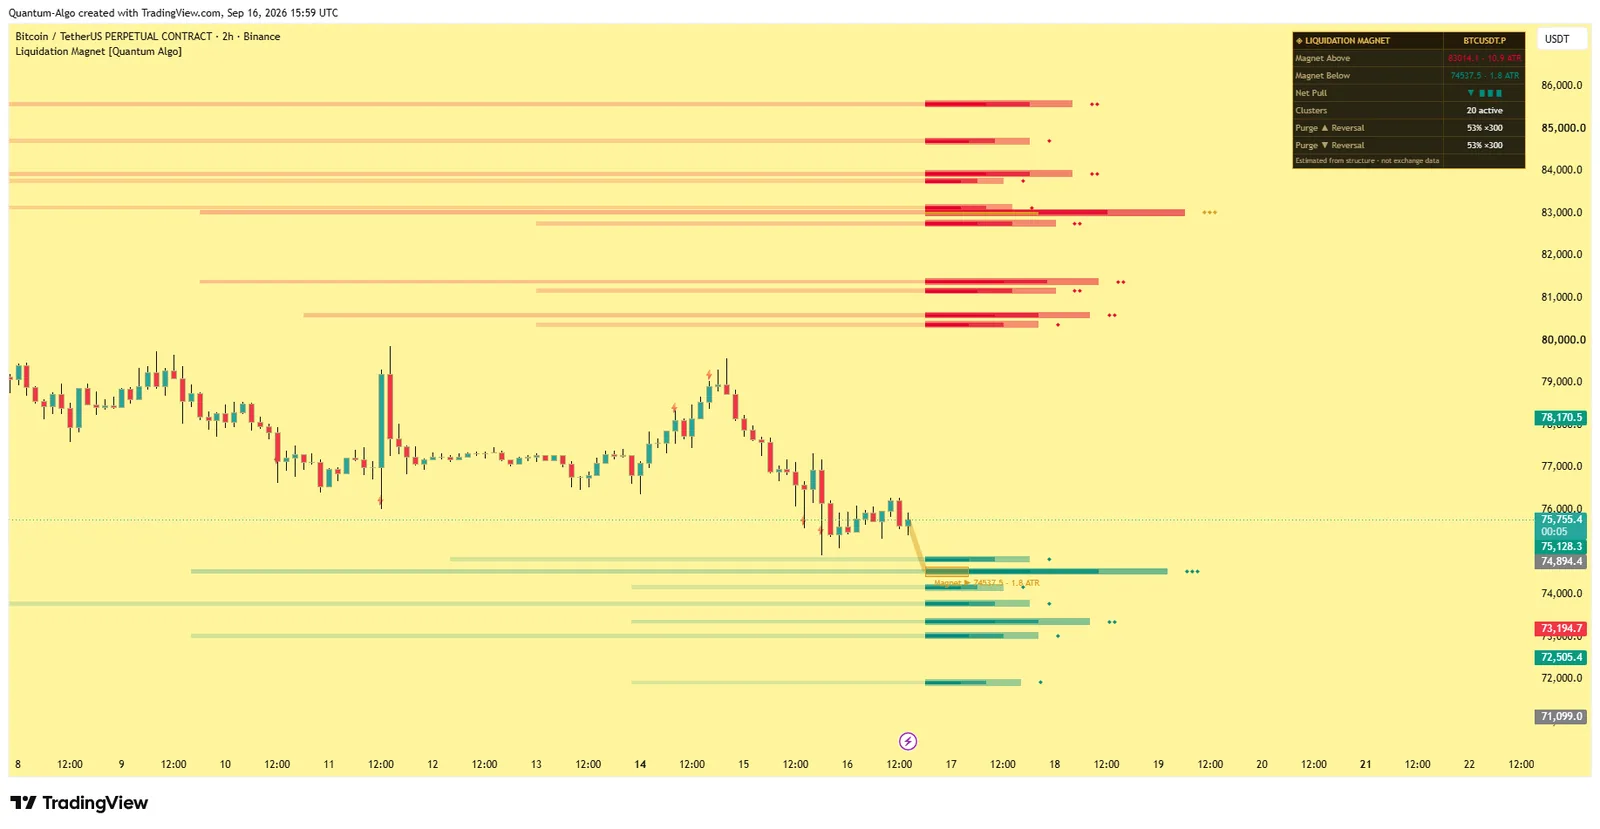
Each cluster draws a trailing heat band across the chart plus a three-layer intensity ladder at the right edge; length and brightness scale with mass; the strongest pool burns gold.
The magnet beam
A gold beam from live price to the strongest pool within reach (mass discounted by distance): where is the nearest large pocket of fuel, in one glance.
Purge flashes
Printed the moment price sweeps through a cluster and consumes it.
The statistics dashboard
Ten-bar reversal rates after upward and downward purges, with sample counts, a Net Pull bias row, and Wilson lower bounds in tooltips.
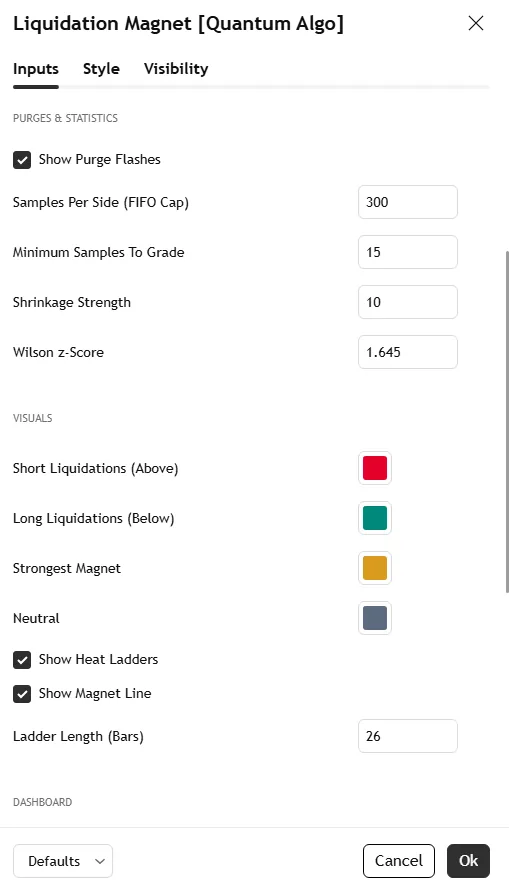
The Bitcoin 2-hour screenshot on this page shows the ladders above and below price with the gold beam; the settings screenshot shows the Inputs tab.
How it works
Swing anchors. Confirmed pivot highs and lows define where crowds of entries concentrate.
Tier projection. Each anchor projects liquidation estimates at the distances implied by common leverage tiers — about 1%, 2%, 4% and 10% from entry (100×, 50×, 25×, 10×), each toggleable.
Mass. Each projection carries mass scaled by the volume z-score at the anchor — swings formed on climactic volume imply larger crowds.
Clustering. Projections landing near an existing cluster merge into it, shifting its weighted centre and adding mass; scattered guesses become weighted zones.
Decay and death. Mass decays every bar; weak clusters are pruned; swept clusters are consumed immediately. The map is current, never a museum of stale lines.
Purge statistics. After each sweep, the ten-bar outcome is recorded in first-in-first-out sample sets, and reversal rates are displayed with sample counts — shrunk toward 50% at small samples so early numbers cannot overstate the edge.
Everything is computed on confirmed bars; clusters and purges do not repaint.
Why it is different from other liquidation tools
A cluster model, not static lines
Estimates merge into weighted zones instead of a picket fence of levels.
A living decay engine
Positions close, stops move, the crowd rotates; the clusters fade and die accordingly.
Purge detection with self-auditing statistics
The tool grades its own thesis, in public, on your chart.
The magnet beam
The single strongest pool in reach, highlighted.
Radical transparency
Every tooltip, the dashboard footer and the description say the levels are structural estimates, not exchange data. In a genre built on implication, that is the feature.
Settings
| Group | Input | What it does | Where to start (BTC/ETH perps, 15m–4H) |
|---|---|---|---|
| Structure | Swing Anchor Length | Pivot size defining anchoring swings | 10 on 15m; 15 on 1H–4H |
| Leverage tiers | 10× / 25× / 50× / 100× toggles | Which projections to build | 25× and 50× on; add 10× on 4H, 100× on 15m |
| Map | Maximum Clusters, Merge Tolerance, Mass Decay | Density and lifespan of the map | 12 / 0.4% / default decay |
| Visuals | Purge flashes, heat ladders, magnet beam, ladder length | What to draw | all on |
| Statistics | Sample cap, minimum samples to grade, shrinkage strength, Wilson z-score | How the reversal rates are computed | 50 / 8 / default / 1.28 |
| Style | Colours, dashboard | Appearance | — |
Alerts
Three named conditions: Approaching Magnet (price within half an ATR of an estimated pool), Upward Purge (an estimated short-liquidation pool was swept), Downward Purge (an estimated long-liquidation pool was swept).
How to use it
Directional context.
A heavy pool overhead with light fuel below suggests the path of least resistance is up — toward the fuel; the Net Pull row quantifies the bias.
Sweep-and-reversal trading.
The classic use: wait for price to purge a strong pool, check the dashboard's historical reversal rate for that direction on your symbol, and treat the purge as a candidate exhaustion point for your own entry method — a change of character from the Smart Money Concepts Engine or a sweep confirmation from the Liquidity Sweeps tool.
Target selection.
Strong pools are natural take-profit magnets; many traders exit into the fuel rather than after it is spent.
Risk placement.
Do not rest stops just beyond a hot ladder — that is exactly where the market has an incentive to reach. The stop-loss page covers the alternative.
Three ways to trade it
Purge and reclaim. Price sweeps a gold ladder below, the purge flash prints, the dashboard's downward-purge reversal rate is high on this chart, and the next candle reclaims the swept level — entry on the reclaim, stop beyond the purge low, target the pool on the other side.
Magnet as target. In a long from a demand block, the strongest pool overhead is TP2; take TP1 at structure and let the magnet pull the remainder.
Net Pull bias. When Net Pull points one way for hours and structure agrees, trade continuation toward the fuel; when they disagree, wait.
Recommended settings by market
BTC and ETH perpetuals, 15m–4H
The design target: 25× and 50× tiers, swing length 10–15, merge tolerance 0.4%.
Large altcoin perpetuals, 1H–4H:
Add the 10× tier (wider pools), raise merge tolerance to 0.6–0.8% for the larger ranges.
Index and gold futures:
The structural logic works, but the leverage-tier assumptions are crypto-native — treat the pools as swing-liquidity estimates, not liquidation estimates.
How it compares
Against liquidation heatmap platforms (Coinglass-class): those aggregate exchange data at a cost, off the chart; this estimates from structure, on the chart, free, and audits itself. Against the Liquidity Sweeps indicator: that maps swing-level liquidity and classifies the sweep candle; this maps leverage-implied liquidation pools with mass and decay — the same sweep read at a different layer, and the two agree on the important days. Against Zeno: Zeno's crypto signals fire on sweeps of the same pools; this free tool shows the pools and the purge statistics behind them.
Limitations
All levels are estimates; actual liquidation prices vary with margin mode, maintenance margin, fees and funding. The statistics describe historical behaviour on the current chart only. On illiquid symbols or very low timeframes, swing anchors are noisier and clusters less meaningful.
Credits
The liquidation-level mapping concept was popularised by crypto derivatives analytics platforms; pivot structure detection is classical technique; the Wilson score interval is by Edwin B. Wilson (1927). The cluster model, volume-weighted mass and decay engine, purge state machine, self-auditing statistics and all code are original work by Quantum Algo, published open source.
Step-by-step: adding it to your TradingView chart
Open the script page on TradingView (link above) and click Add to favorites, then Use on chart — or on any chart open Indicators, search "Liquidation Magnet Quantum Algo" and add it. Free on every TradingView plan.
Open the indicator's settings and set the inputs for your market and timeframe from the table above; the defaults are tuned for crypto and gold.
In the Style tab, match the colours to your chart theme; the dashboard position and text size are in Inputs.
To set alerts, right-click the chart → Add alert, choose the indicator as the condition and pick the event; set "Once per bar close" so alerts match the closed-bar logic.
Save the layout, and add the other free Quantum Algo tools to it — they are designed to sit together.
To read or reuse the code, click Source code on the script page; republishing is subject to TradingView's house rules.
Inside the code, for developers
Pine Script, open source. Worth reading if you want to modify it: pivot confirmation with ta.pivothigh / ta.pivotlow and a symmetric lookback (the source of the deliberate lag); state held in capped arrays of drawing objects with explicit create/update/retire functions; every detection and signal gated on barstate.isconfirmed; named alertcondition calls so webhooks receive a consistent payload. The Academy's Pine Script tutorials and the TradingView backtesting guide cover strategy conversion.
Using it with the other free indicators
The free tools layer on one chart: the Smart Money Concepts Engine for bias and the Confluence Score; Order Blocks with Volume, Fair Value Gaps + Inversion and Institutional Key Levels for the zone; Liquidity Sweeps, Sessionscope and Liquidation Magnet for the liquidity and the trigger; OTE + Silver Bullet for the time-qualified entry; the Institutional Volume Profile and Pressure Oscillator for whether volume agrees. The free-indicators hub lists every tool; the SMC guide is the method behind the layering.
Common mistakes with this indicator
- Trusting the developing bar — every event waits for the close.
- Trading every marker — the tool gives context and location; the entry needs structure confirmation and a stop beyond the level.
- Default lengths on the wrong timeframe — adjust the pivot inputs, as the settings table shows.
- Ignoring volume quality — indicative on CFD tick volume, real on exchanges and futures.
- Stacking ten random scripts — the free tools layer because they were built to.
Want the signal, not just the structure?
Zeno reads the same Smart Money structure across timeframes and prints the entry, stop, TP1 and TP2 on your chart — with a public record of 160 posted trades, 120 wins and 40 losses at the stated levels. QuantumBot executes it on Bybit, Binance, OKX, Bitget and Kraken.

Glossary for this indicator
Frequently asked questions
Is this real liquidation data from exchanges?
No — and the indicator says so everywhere. TradingView scripts cannot access exchange liquidation feeds or order books; every level is an estimate from price structure and the fixed maths of leverage, and the tool measures its own hit rate on your chart to compensate.
Why do the estimated levels line up with real reversals?
Because liquidation maths is public and mechanical: everyone's 50× liquidation sits roughly 2% from entry, so crowded swings reliably produce crowded liquidation pockets without any private data.
Does Liquidation Magnet repaint?
No. Clusters form on confirmed pivots, purges are detected on confirmed bars, and consumed clusters stay consumed.
Which markets and timeframes?
Designed for crypto perpetual futures on 15m–4H. The structural logic works elsewhere, but the leverage-tier assumptions are crypto-native.
What do the reversal statistics mean?
After each purge, whether price moved back against the sweep over the next ten bars. Rates are shrunk toward 50% at low sample counts so early numbers cannot overstate the edge; they describe this chart's history only.
How does it relate to Zeno and QuantumBot?
Zeno's crypto signals start with sweeps of exactly these pools; QuantumBot executes them on Bybit, Binance, OKX, Bitget and Kraken. This free tool is the map of the fuel those signals are built around.
Is this the same as a liquidation heatmap from a data platform?
No. Those aggregate exchange data off the chart, usually for a fee; this estimates pools from structure and leverage tiers on the chart, free, and reports its own hit rate. The two often agree because liquidation maths is mechanical.
Which leverage tiers should I enable?
25× and 50× on BTC and ETH 15m–4H; add 10× on 4H for the wider pools and 100× on 15m for the near ones. Each is toggleable.
What is the magnet beam?
A gold line from live price to the strongest pool within reach, with mass discounted by distance — the one-glance answer to where the nearest large pocket of fuel is.
What does a purge flash mean?
Price swept through an estimated pool and consumed it. The dashboard then records whether price reversed over the next ten bars.
Does it work on gold or indices?
The structural logic works, but the leverage-tier assumptions are crypto-native; on futures treat the pools as swing-liquidity estimates rather than liquidation estimates.
How does it relate to Zeno and QuantumBot?
Zeno's crypto signals start with sweeps of exactly these pools, and QuantumBot executes them on Bybit, Binance, OKX, Bitget and Kraken with exchange-side stops; this free tool is the map of the fuel.
The other free Smart Money indicators
Built to layer on one chart: the engine for bias and the score, the dedicated tools for each element.
Add Liquidation Magnet to your chart
One click on TradingView, free on every plan, code you can read. Nothing repaints.