Volatility Storm Tracker [Quantum Algo]
Volatility as weather: professional range-based estimators, a cone that ranks today against this symbol's own history, a pressure gauge that charges while compression builds, lifecycle boxes on the chart, and an expected-move cone projected forward — with every Storm Watch settling publicly into Delivered or Fizzled.
The short answer
The Volatility Storm Tracker is a free, open-source TradingView indicator that treats volatility the way meteorologists treat weather — as a system with structure, pressure and a lifecycle. It measures realised volatility with professional range-based estimators (Yang-Zhang as the engine, Parkinson and Garman-Klass alongside), locates current volatility inside its own historical cone as a percentile, charges a Storm Pressure gauge while compression builds, boxes each phase of the storm lifecycle on the chart — BUILDING, STORM, AFTERMATH — and projects the statistical expected-move cone forward from live price like a hurricane track. Its one predictive claim is narrow and measurable: after deep, sustained compression, expansion follows. Direction is never predicted — expansion is — and every Storm Watch marker settles publicly into Delivered or Fizzled, so the chart always shows the tool's honest record on your symbol.
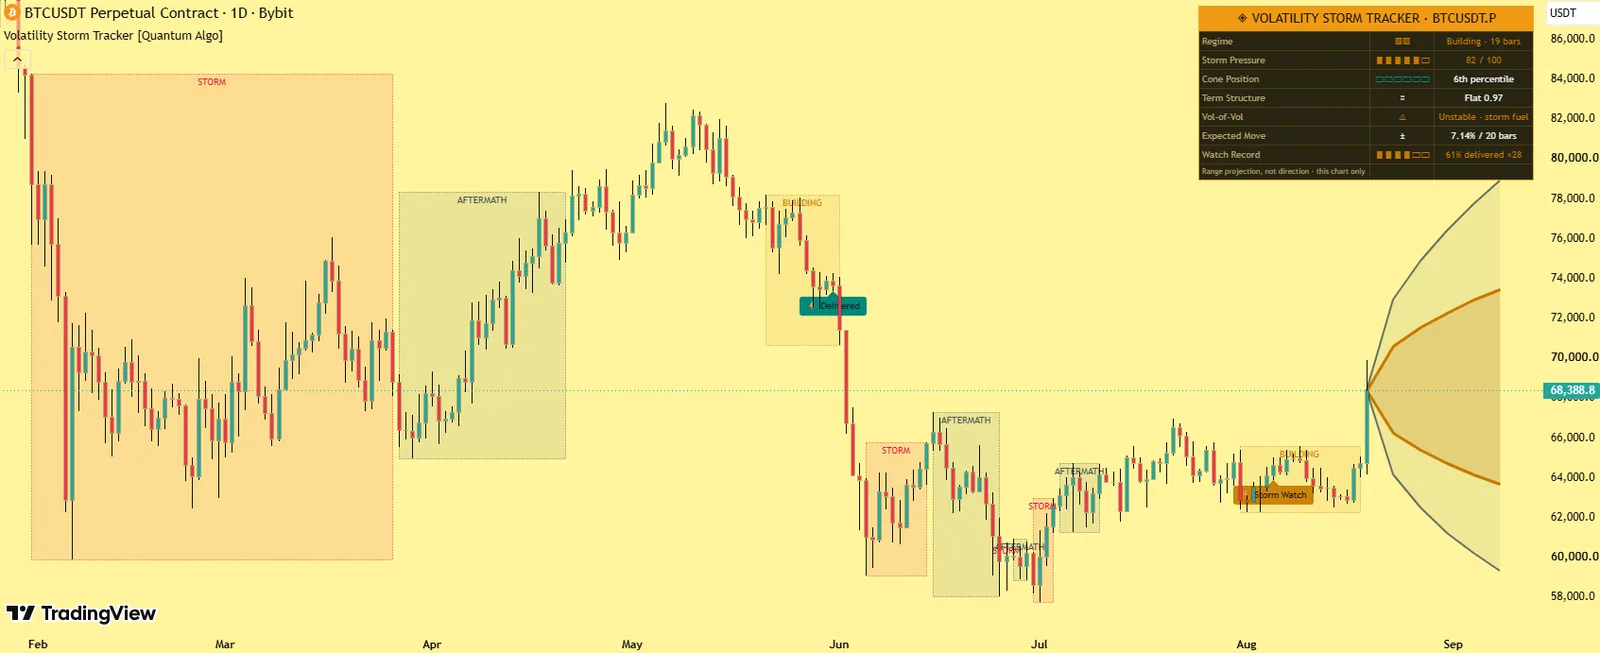
BUILDING / STORM / AFTERMATH boxes, Storm Watch markers, the forward expected-move cone, and a dashboard with cone percentile, term structure, pressure and the Watch Record.
After deep, sustained compression, expansion follows. Direction is never predicted.
No — watches, storms and transitions on confirmed bars; the cone is a live projection to the right of price.
Realised volatility and why estimators matter
Realised volatility measures how much price actually moves. The naive approach uses closing prices only and throws away most of the information in every bar. Range-based estimators use the full open, high, low and close: Parkinson (1980) exploits the high-low range, Garman-Klass (1980) adds the open-close body, Rogers-Satchell (1991) handles drift, and Yang-Zhang (2000) combines overnight gaps, intraday movement and drift into the most efficient practical estimator — the standard on volatility desks. This tool computes the suite and uses Yang-Zhang as its engine, which means the same reading quality from far fewer bars — and adaptive thresholds that stay responsive.
The volatility cone and term structure
A number like "volatility is 2.4%" means nothing in isolation. The volatility cone (Burghardt and Lane, 1990) ranks current volatility as a percentile inside its own recent history: the 8th percentile is deep compression for this market, the 92nd a live storm. Term structure compares short-horizon volatility with long-horizon: below it is contango (calm); above it is backwardation — recent movement violent relative to the baseline, the stress signature options desks watch. The dashboard reads Contango, Flat or Backwardation with the live ratio.
What it draws
Lifecycle boxes
Around each phase's price action — BUILDING in amber, STORM in red, AFTERMATH in slate — calm periods left clean.
Storm Watch markers
That settle into Delivered or Fizzled.
The expected-move cone
One- and two-standard-deviation ranges projected forward from live price with square-root-of-time curvature; a range projection, never a direction.
The dashboard
The estimator reading, cone percentile, term structure, volatility-of-volatility, Storm Pressure, the Expected Move over your horizon, and the Watch Record with sample count.
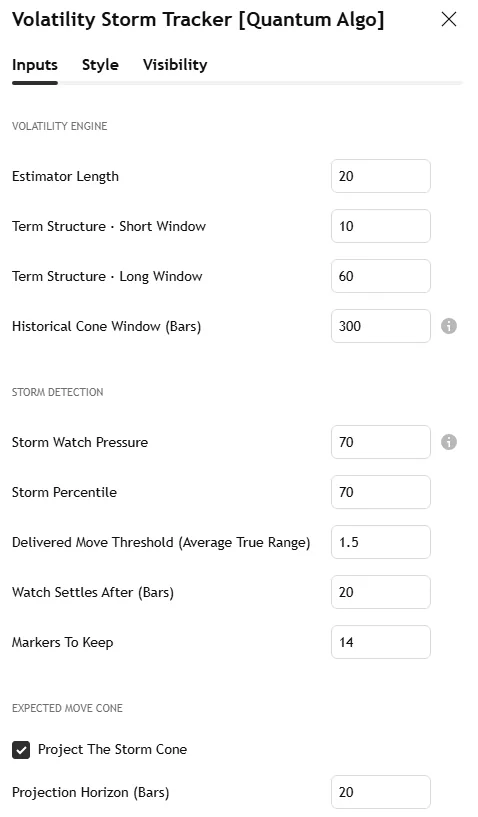
The Bitcoin daily screenshot on this page shows a STORM box with the forward cone and the dashboard; the settings screenshot shows the Inputs tab.
Why it is different
A professional estimator suite on the chart
Mathematics standard on volatility desks and almost never implemented on the platform.
Storm Pressure.
A charged gauge from three measurable ingredients: how deep volatility sits in its cone, how long the compression has lasted, and how unstable volatility itself has become. Pressure rises while the chart still looks quiet.
The lifecycle, boxed and labelled.
Scrolling back reads as a storm history — volatility clustering made visible.
The expected-move cone
A hurricane-track cone for price.
Settling markers and a public record.
Every Watch resolves after a fixed window; the Watch Record reports the delivery rate with sample count, shrunk toward neutral at small samples, with a Wilson bound.
How it works
Each bar, the estimator suite computes realised volatility from the full range, gaps included.
Current volatility is ranked inside its historical cone; term structure and volatility-of-volatility are updated.
Storm Pressure charges during deep, persistent, unstable compression and prints a Storm Watch when it crosses the watch threshold.
A Storm confirms when volatility enters the top of its own cone; the regime machine transitions Calm → Building → Storm → Aftermath and boxes each phase.
After the settle window, each Watch is recoloured by outcome and feeds the statistics.
Detection on confirmed bars; settled markers never change; the forward cone is a live projection drawn to the right of price.
Settings
| Group | Input | What it does | Where to start |
|---|---|---|---|
| Volatility Engine | Estimator length | Yang-Zhang window | 20 |
| Term-structure windows | Short and long horizons | 10 / 40 | |
| Historical cone window | For the percentile | 250 | |
| Storm Detection | Watch pressure threshold | When a Storm Watch prints | 70 |
| Storm percentile | Top of the cone | 85 | |
| Delivered-move threshold | ATR multiple that counts as delivered | 2.0 | |
| Settle window, markers kept | Outcome timing; history | 20 bars; 20 | |
| Expected Move Cone | Projection toggle, horizon | The forward cone | on; 20 bars |
| Statistics | Sample cap, minimum samples, shrinkage strength, Wilson z | The Watch Record | 40 / 8 / default / 1.28 |
| Visuals | Colours, regime boxes, dashboard | Appearance | — |
Alerts
Four named conditions: Storm Watch (pressure crossed the watch threshold), Storm Confirmed (volatility entered the top of its cone), Calm Restored (the cycle completed), and Term Structure Inverted (short-horizon exceeded long-horizon).
How to use it
Breakout preparation. A charged Pressure gauge inside a BUILDING box is where breakout strategies earn their keep; the Watch Record says how reliably expansion has followed on this symbol.
Position sizing. The Expected Move row turns current volatility into a concrete ±percentage over your horizon — a rational basis for stop distance and size, the arithmetic the position-sizing guide describes.
Options context. Cone position and term structure say whether movement is cheap or expensive relative to this market's own history.
Regime filtering. Many strategies work in exactly one regime; the boxes show which regime any trade lived in — and which one you are in now.
Works from 15-minute to weekly on any market; everything is self-relative.
Three ways to trade it
The charged-compression breakout.
BUILDING box, pressure above the watch threshold, Keltner Rings in Squeeze: trade the first structure break in either direction, size from the Expected Move, stop back inside the coil.
The storm fade, not the storm chase.
Inside a STORM box, volatility at the top of its cone and term structure inverted, the expected move has already been paid; reversion setups from the Keltner R family or a σ rejection from the Anchored VWAP Engine have the regime on their side.
The size adjustment.
Before any Zeno or structure entry, read the Expected Move; a stop inside the one-sigma cone is inside the noise — widen it or wait.
Recommended settings by market
Crypto, 4H–daily:
Defaults; storms cluster around funding and macro events and the record matures fast.
Indices and stocks, daily:
Cone window 250 (a year); term structure 10/40; earnings show as STORM boxes.
Forex and gold, 1H–4H:
Estimator length 20; the London-open BUILDING → STORM transition is the daily pattern.
How it compares
Against ATR alone: ATR is one number with no context; this ranks it in its own cone, adds term structure, pressure, the lifecycle and a record. Against the Choppiness Index: CHOP reads range versus trend; the Storm Tracker reads compression versus expansion — related but different questions, and the pair is the regime layer for a structure trader. Against Keltner Rings: the rings show the squeeze; the tracker measures how charged it is and when it released. Against Zeno: Zeno prints the entry; the tracker sets the expected move the stop and targets should respect.
Limitations
Expansion timing is probabilistic: pressure can stay charged longer than expected, and some Watches fizzle — the record row exists to quantify that on your chart. The expected-move cone assumes today's volatility persists over the horizon. Statistics describe the current chart's history only.
Credits
Range-based volatility estimators by Parkinson (1980), Garman and Klass (1980), Rogers and Satchell (1991), and Yang and Zhang (2000); volatility cones after Burghardt and Lane (1990); volatility clustering documented by Mandelbrot (1963) and formalised by Engle (1982); the Wilson score interval by Edwin B. Wilson (1927). The storm pressure model, regime state machine, settling audit, per-symbol statistics and all code are original work by Quantum Algo, published open source.
Step-by-step: adding it to your TradingView chart
Open the script page on TradingView (link above) and click Add to favorites, then Use on chart — or on any chart open Indicators, search "Volatility Storm Tracker Quantum Algo" and add it. Free on every TradingView plan.
Open the indicator's settings and set the inputs for your market and timeframe from the table above; the defaults are tuned for crypto on intraday and 4-hour charts.
In the Style tab, match the colours to your chart theme; the dashboard position and text size are in Inputs.
To set alerts, right-click the chart → Add alert, choose the indicator as the condition and pick the event; set "Once per bar close" so alerts match the closed-bar logic.
Save the layout, and add the other free Quantum Algo tools to it — they are designed to sit together.
To read or reuse the code, click Source code on the script page; republishing is subject to TradingView's house rules.
Inside the code, for developers
Pine Script, open source. Worth reading if you want to modify it: every detection and signal gated on barstate.isconfirmed; state held in capped arrays of drawing objects with explicit create, update and retire functions; statistics kept in first-in-first-out arrays with shrinkage and a Wilson bound computed inline; named alertcondition calls so webhooks receive a consistent payload. The Academy's Pine Script tutorials and the TradingView backtesting guide cover strategy conversion.
Using it with the other free indicators
The free tools layer on one chart: the Smart Money Concepts Engine for bias and the Confluence Score; Order Blocks with Volume, Fair Value Gaps + Inversion and Institutional Key Levels for the zone; Liquidity Sweeps, Sessionscope and Liquidation Magnet for the liquidity and the trigger; OTE + Silver Bullet for the time-qualified entry; the Institutional Volume Profile and Pressure Oscillator for whether volume agrees; and the trend and volatility family — the Adaptive Trend Sentinel, SuperTrend Engine, Golden Cross Engine, Anchored VWAP Engine, Trendline Architect, Keltner Rings and Volatility Storm Tracker — for regime, direction and the room a move has. The free-indicators hub lists every tool; the SMC guide is the method behind the layering.
Common mistakes with this indicator
- Trusting the developing bar — every event waits for the close.
- Trading every marker — the tool gives regime and context; the entry needs a structure level and a stop beyond it.
- Default lengths on the wrong timeframe — adjust the inputs, as the settings table shows.
- Reading the statistics as promises — they describe this chart's history, shrunk toward neutral on purpose.
- Stacking ten random scripts — the free tools layer because they were built to.
Want the signal, not just the structure?
Zeno reads Smart Money structure across timeframes and prints the entry, stop, TP1 and TP2 on your chart — with a public record of 160 posted trades, 120 wins and 40 losses at the stated levels. QuantumBot executes it on Bybit, Binance, OKX, Bitget and Kraken.

Glossary for this indicator
Frequently asked questions
Does it predict direction?
No — and that is the point. Direction after compression is uncertain; expansion is not. The tool makes only the claim volatility mathematics supports and measures it on your chart.
Does the Volatility Storm Tracker repaint?
No. Watches, storms and regime transitions are detected on confirmed bars and settled markers are permanent. The forward cone updates live because it is a projection from current conditions, drawn to the right of price.
What does "Delivered" mean?
Price moved at least the configured threshold (in ATR units, either direction) within the settle window after the Watch. "Fizzled" means it did not. Both stay on the chart.
Why Yang-Zhang instead of a standard deviation of closes?
Close-to-close volatility ignores gaps and intrabar range, making it slow and noisy; Yang-Zhang uses the full bar plus the overnight gap and is dramatically more efficient.
Which markets does it suit?
All — crypto, stocks, indices, forex, commodities. Every threshold is defined relative to the symbol's own history, so it recalibrates wherever you load it.
How does it relate to Zeno?
Zeno prints entries with stop and targets; the tracker tells you the expected move around them and whether the regime is compression or expansion. Many subscribers run it on the 4-hour under Zeno as a sizing and regime read.
Does the Volatility Storm Tracker predict breakouts?
It predicts expansion after deep compression — not direction, not timing to the bar — and measures its own record on your chart with the settled Watch markers.
What is the expected move?
The one- and two-standard-deviation range projected from current realised volatility over your horizon, with square-root-of-time scaling — a rational basis for stop distance and size.
What is Storm Pressure?
A gauge charged by three ingredients: how deep volatility sits in its cone, how long the compression has lasted, and how unstable volatility itself has become. It rises while the chart still looks quiet.
Why range-based estimators?
Close-to-close volatility ignores gaps and intrabar range; Yang-Zhang uses the full bar plus the overnight gap and gives the same reading quality from far fewer bars.
Can I use it for options?
The cone position and term structure describe whether movement is cheap or expensive relative to the symbol's own history — the context an options trader needs; it is not an implied-volatility feed.
How does it relate to Zeno?
Zeno prints entries with stop and targets; the tracker sets the expected move those should respect and says whether the regime is compression or expansion.
The trend and volatility family
Regime, direction and room — the tools built to sit under the Smart Money layer.
Add Volatility Storm Tracker to your chart
One click on TradingView, free on every plan, code you can read. Nothing repaints.