Golden Cross Engine [Quantum Algo]
The moving-average crossover as a measurable object: a countdown to the next cross at current slopes, a grade on every cross, honest per-symbol statistics at three horizons, and markers that settle into their real outcome — so the chart shows which crosses worked here and which failed.
The short answer
The Golden Cross Engine is a free, open-source TradingView indicator that turns the moving-average crossover from a headline into a measurable, projectable, auditable object: it counts down to the next cross before it happens by projecting both averages' slopes, grades every cross A, B or C by volume, slope steepness and price confirmation, measures what golden and death crosses have actually done on the current symbol with honest statistics at five, twenty and sixty bars, and lets every cross marker settle into its real outcome twenty bars later so the chart itself shows which crosses worked and which failed. The dashboard adds the fast-over-slow state on five timeframes at once.
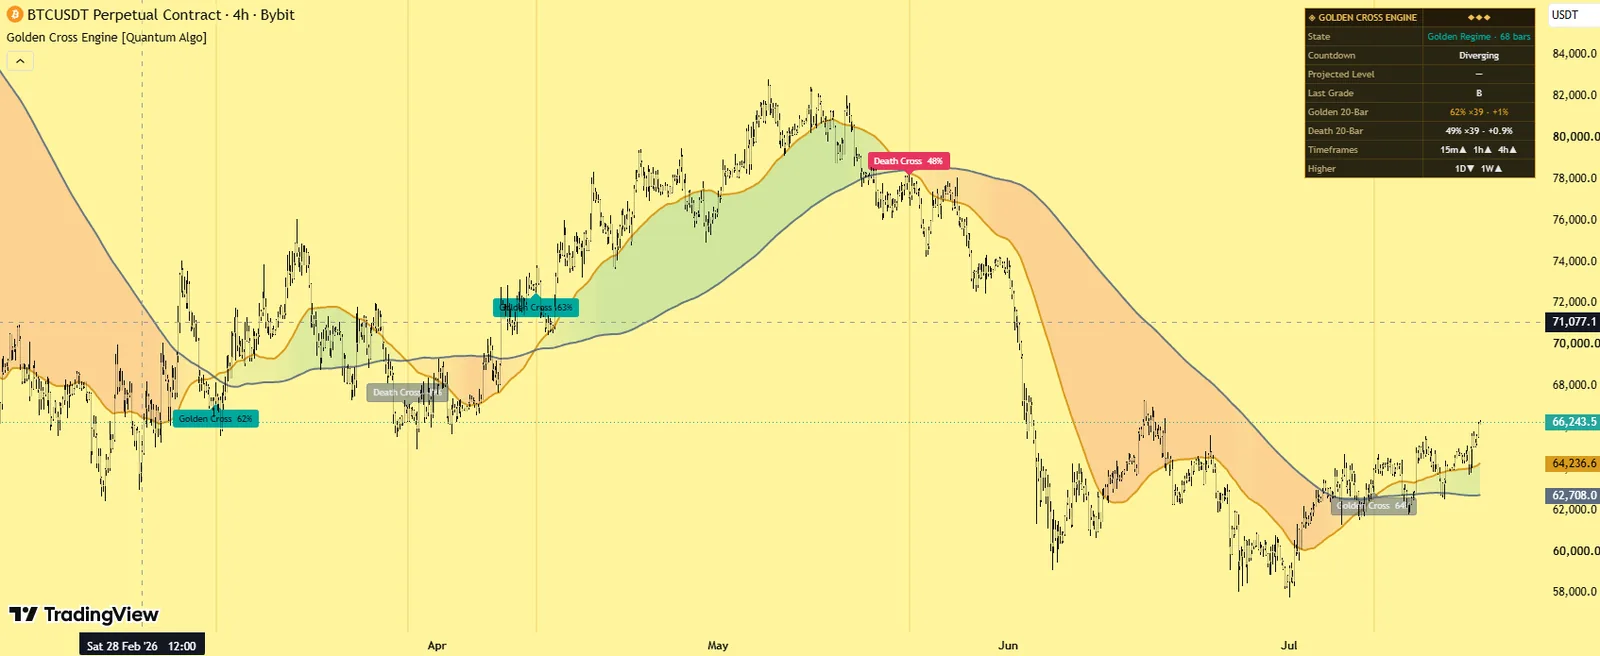
The two averages with a regime fill, a projected countdown to the next cross, settled cross markers, and a five-timeframe state row.
The convergence countdown — the most-watched lagging signal in trading, visible in advance.
Crosses, grades and statistics on closed bars; the countdown is a labelled live projection.
What the golden cross and death cross are
A golden cross occurs when a faster moving average — traditionally the 50-period — closes above a slower one — traditionally the 200 — signalling that intermediate momentum has overtaken the long-term trend, historically read as the start of a bullish regime. A death cross is the mirror: the fast average crossing below the slow. Because both averages move slowly the cross itself is a lagging event — which is exactly why this engine adds a convergence countdown that shows the cross forming before it prints. Our golden cross guide covers the history and the evidence; this page is the tool.
What it draws
The two averages
Simple or exponential at configurable lengths, 50 and 200 by default — with a living regime fill between them that intensifies as the gap widens and pales as a cross approaches.
The convergence countdown
When the averages are approaching within the horizon, both projected paths, the meeting diamond with the bar count ("Golden Cross ≈ 9 bars"), and the projected price level.
Cross markers
In neutral gold that settle twenty bars later into the bullish or bearish colour if the cross delivered, faded grey if it failed.
A one-bar flash
On the cross bar.
The dashboard
Countdown or Diverging, the last cross grade, the statistics rows, and the fast-over-slow state on the 15-minute, 1-hour, 4-hour, daily and weekly timeframes.
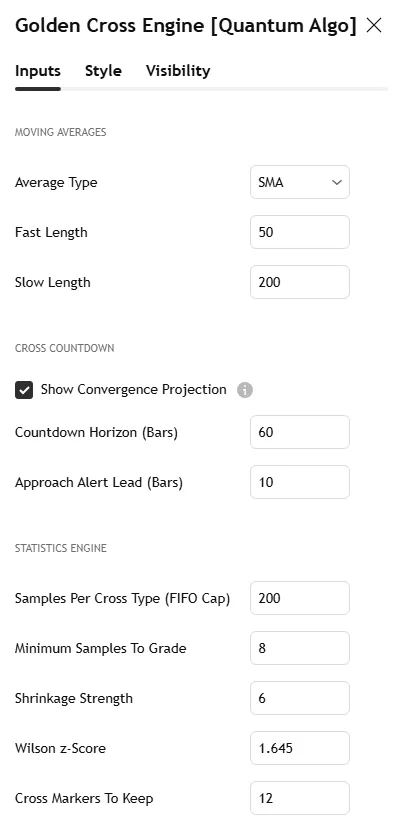
The Bitcoin 4-hour screenshot on this page shows the averages, the regime fill, a settled cross and the countdown; the settings screenshot shows the Inputs tab.
Why it is different
The convergence countdown.
The engine measures the current slope of both averages, projects their geometry forward and marks where and when they would meet — a projection at current slopes, labelled as such, never a forecast — with an approach alert when the countdown enters your lead window.
Markers that settle.
Every cross prints neutral, then resolves twenty bars later by its real outcome. The chart becomes its own audit trail.
Per-symbol statistics.
Shrinkage-adjusted win rates with Wilson bounds at five, twenty and sixty bars, with sample counts and average moves — the answer to "does the golden cross actually work here", with data instead of folklore.
Cross grading.
Elevated volume, slope steepness and price-side confirmation combine into an A, B or C grade.
Multi-timeframe state.
Full-stack regime alignment in two compact rows.
How it works
Averages. Selectable SMA or EMA at configurable lengths.
Countdown. Each average's recent slope is computed and the convergence geometry solved; approaching within the horizon draws the projection, separating reads Diverging.
Statistics. Each confirmed cross records what price did 5, 20 and 60 bars later in the cross's direction into capped databases; win rates are pulled toward 50% by pseudo-samples with Wilson lower bounds; markers read "collecting history" until the minimum is met.
Outcome settlement. Each marker stores its cross price and recolours by the realised twenty-bar outcome.
Grading. Volume z-score, normalised slope and price-side confirmation.
Non-repainting. Crosses, grades and statistics on closed bars; the countdown updates on the live bar by design — it is a live projection and labelled as one.
Settings
| Group | Input | What it does | Where to start |
|---|---|---|---|
| Averages | Type; fast and slow lengths | The crossover pair | SMA; 50 / 200 |
| Countdown | Projection toggle, horizon, approach alert lead | The convergence layer | on; 60 bars; 10 bars |
| Statistics | Sample cap, minimum samples to grade, shrinkage strength, Wilson z, markers to keep | The per-symbol record | 40 / 6 / default / 1.28 / 20 |
| Visuals | Colours, gradient fill toggle, cross-bar flash toggle | Appearance | on / on |
| Dashboard | Position, four text sizes, title band, background, frame, grid, three text colours | Themeable | — |
Alerts
Five named conditions: Golden Cross, Death Cross (confirmed at bar close), Golden Cross Approaching, Death Cross Approaching (the countdown entered the alert lead window), and Grade A Cross.
How to use it
The natural home is the daily chart of major symbols — indices, large-cap stocks, crypto — where the 50/200 cross is the famous event; intraday charts work identically with more crosses and deeper samples.
Watch the countdown as a regime alarm. A shrinking bar count with a steepening fast average means the regime change is forming in front of you.
Read the settled history before trusting a fresh cross. Grey markers mean crossovers chop on this symbol; coloured ones mean they trend.
Use the grade as confluence. An A-grade cross with volume, steep slope and price confirmation is a different event from a flat drift-through.
Check the timeframe rows. A golden cross on your chart while the daily and weekly already sit bullish is alignment; against them, a counter-trend event.
Three ways to trade it
The regime confirmation.
A golden cross on the daily with the weekly already bullish confirms the swing bias; take structure entries from the Smart Money Concepts Engine in that direction until the death-cross countdown starts.
The countdown position.
Rather than buying the cross bar (late by construction), use the approach alert as the cue to look for a sweep-and-reclaim on the 4-hour — the entry lands days before the headline.
The failed cross fade.
A cross that grades C and whose statistics on this symbol are poor is a candidate for the opposite trade at the next structure level; the grey markers on the chart are the evidence.
Recommended settings by market
Indices and large caps, daily:
SMA 50/200, horizon 60, lead 10 — the classic.
Crypto, 4H–daily:
EMA 50/200 responds faster to crypto's cycles; lead 15.
Intraday, 15m–1H:
20/100 or 21/89 for a usable number of crosses and richer statistics; expect more grey markers.
How it compares
Against a plain two-MA crossover: same event, plus the countdown, the grade, the statistics, the settled outcomes and the multi-timeframe rows. Against the Adaptive Trend Sentinel and SuperTrend Engine: those flip on volatility-scaled boundaries and react faster; the Golden Cross Engine is the slow, famous, widely watched regime event — best as the outer filter. Against Zeno: Zeno's entries come from structure; the cross state is the macro regime those entries sit inside.
Limitations
Moving-average crossovers are lagging by construction, and the countdown inherits the assumption of stable slopes. Cross samples are naturally small on higher timeframes. Volume grading is less meaningful on symbols with unreliable volume. Multi-timeframe rows describe state, not signals.
Credits
The golden cross and death cross are classical moving-average crossover concepts in the public domain; the Wilson score interval is by Edwin B. Wilson (1927). The convergence countdown and projection geometry, the outcome-settling markers, the per-symbol statistical grading, the living regime fill and all code are original work by Quantum Algo, published open source.
Step-by-step: adding it to your TradingView chart
Open the script page on TradingView (link above) and click Add to favorites, then Use on chart — or on any chart open Indicators, search "Golden Cross Engine Quantum Algo" and add it. Free on every TradingView plan.
Open the indicator's settings and set the inputs for your market and timeframe from the table above; the defaults are tuned for crypto on intraday and 4-hour charts.
In the Style tab, match the colours to your chart theme; the dashboard position and text size are in Inputs.
To set alerts, right-click the chart → Add alert, choose the indicator as the condition and pick the event; set "Once per bar close" so alerts match the closed-bar logic.
Save the layout, and add the other free Quantum Algo tools to it — they are designed to sit together.
To read or reuse the code, click Source code on the script page; republishing is subject to TradingView's house rules.
Inside the code, for developers
Pine Script, open source. Worth reading if you want to modify it: every detection and signal gated on barstate.isconfirmed; state held in capped arrays of drawing objects with explicit create, update and retire functions; statistics kept in first-in-first-out arrays with shrinkage and a Wilson bound computed inline; named alertcondition calls so webhooks receive a consistent payload. The Academy's Pine Script tutorials and the TradingView backtesting guide cover strategy conversion.
Using it with the other free indicators
The free tools layer on one chart: the Smart Money Concepts Engine for bias and the Confluence Score; Order Blocks with Volume, Fair Value Gaps + Inversion and Institutional Key Levels for the zone; Liquidity Sweeps, Sessionscope and Liquidation Magnet for the liquidity and the trigger; OTE + Silver Bullet for the time-qualified entry; the Institutional Volume Profile and Pressure Oscillator for whether volume agrees; and the trend and volatility family — the Adaptive Trend Sentinel, SuperTrend Engine, Golden Cross Engine, Anchored VWAP Engine, Trendline Architect, Keltner Rings and Volatility Storm Tracker — for regime, direction and the room a move has. The free-indicators hub lists every tool; the SMC guide is the method behind the layering.
Common mistakes with this indicator
- Trusting the developing bar — every event waits for the close.
- Trading every marker — the tool gives regime and context; the entry needs a structure level and a stop beyond it.
- Default lengths on the wrong timeframe — adjust the inputs, as the settings table shows.
- Reading the statistics as promises — they describe this chart's history, shrunk toward neutral on purpose.
- Stacking ten random scripts — the free tools layer because they were built to.
Want the signal, not just the structure?
Zeno reads Smart Money structure across timeframes and prints the entry, stop, TP1 and TP2 on your chart — with a public record of 160 posted trades, 120 wins and 40 losses at the stated levels. QuantumBot executes it on Bybit, Binance, OKX, Bitget and Kraken.

Glossary for this indicator
Frequently asked questions
Does the Golden Cross Engine repaint?
No. Crosses, grades, statistics and marker settlement are evaluated on closed bars. The countdown is a live-bar projection and is explicitly presented as one.
Is the countdown a prediction?
No. It is where the averages meet if both keep their current slopes; slopes change and the countdown updates. Its value is showing the event forming, not promising the date.
Why are the sample counts small?
Because genuine crosses are rare — a daily chart may produce a handful in years. The engine shows honest small numbers with confidence bounds; lower timeframes build deeper samples.
Why did an old cross marker turn grey?
It failed: twenty bars later, price had not moved in the cross's direction. Grey markers are the audit trail working.
Which lengths should I use?
The classic 50 and 200 define the famous event. Faster pairs produce more crosses and richer statistics at the cost of more noise.
How does it relate to Zeno?
Zeno prints structure signals with entry, stop and targets; the cross state is the macro regime filter around them. Many subscribers run the engine on the daily and Zeno on the 2-hour.
Is the golden cross a reliable signal?
It depends on the symbol — which is why the engine measures it: the per-symbol statistics at 5, 20 and 60 bars answer the question with data, and the settled markers show the history on the chart.
What moving averages does it use?
SMA or EMA, 50 and 200 by default; faster pairs produce more crosses and richer statistics at the cost of more noise.
How early is the countdown?
As early as the averages start converging within the horizon (60 bars by default); the approach alert fires when the projected count first enters your lead window.
Why does the multi-timeframe row matter?
A cross on your chart while the daily and weekly already agree is alignment; against them, a counter-trend event. Two rows show the full stack at once.
Can I get a golden cross alert?
Yes — Golden Cross, Death Cross, Golden Cross Approaching, Death Cross Approaching and Grade A Cross are all named alert conditions.
How does it relate to Zeno?
Zeno prints structure entries on the 2-hour and 15-minute; the cross state on the daily is the macro regime those entries sit inside.
The trend and volatility family
Regime, direction and room — the tools built to sit under the Smart Money layer.
Add Golden Cross Engine to your chart
One click on TradingView, free on every plan, code you can read. Nothing repaints.