Adaptive Trend Sentinel [Quantum Algo]
A volatility-aware boundary that ratchets with the trend and never retreats — a rising floor in uptrends, a falling ceiling in downtrends — with one clean Long or Short label on the exact bar the regime flips. One answer on every bar: bullish or bearish, and where it changes.
The short answer
The Adaptive Trend Sentinel is a free, open-source TradingView indicator that draws an intelligent protective boundary directly on the chart — a volatility-aware trailing line whose width adjusts to current ATR, that ratchets in the trend's direction and never retreats. In an uptrend it is a rising floor that locks in progress; in a downtrend a falling ceiling. When price decisively breaches the boundary from the other side, a regime change is confirmed and a clean Long or Short label fires on that exact bar. One clear answer on every bar: bullish regime or bearish regime, and exactly where it flips. With over eleven thousand traders using it, it is the most-used script in the Quantum Algo library.
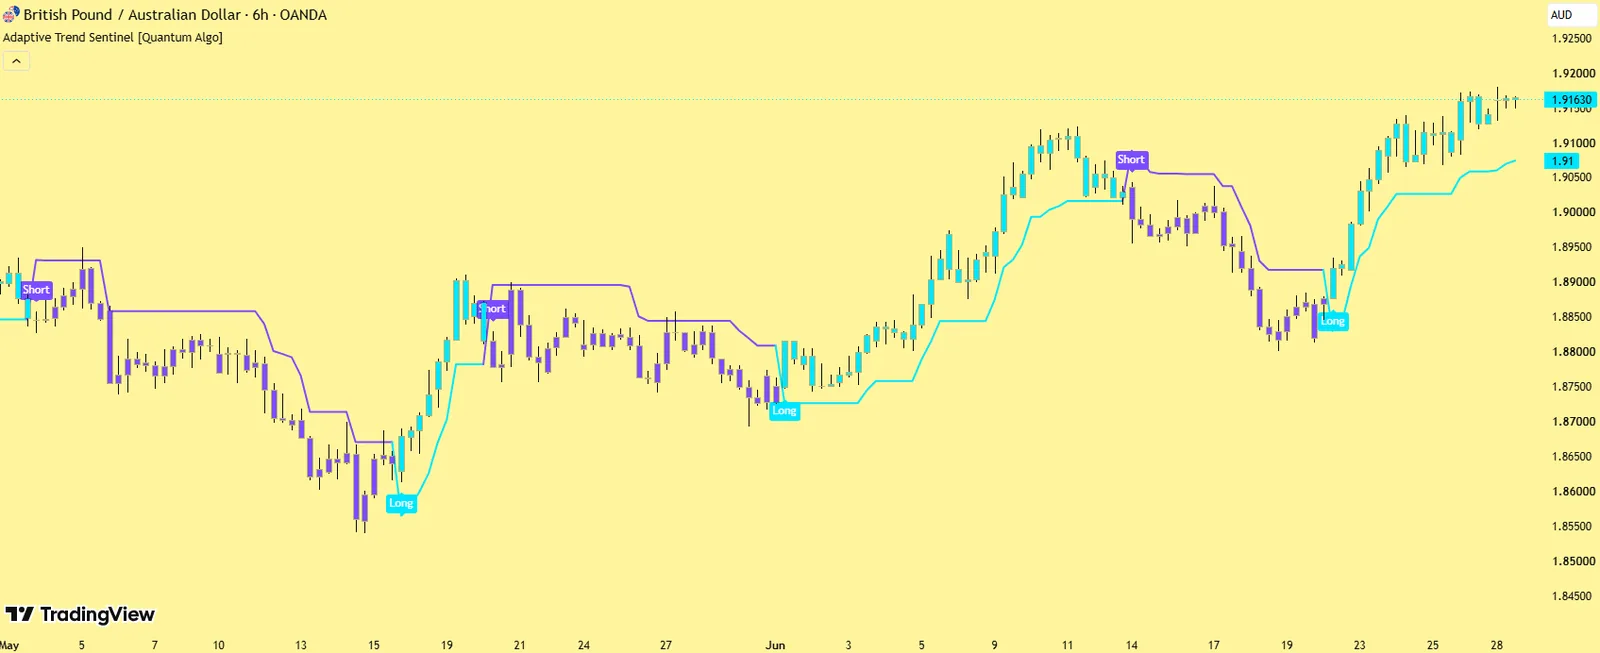
The Sentinel boundary (cyan bullish, violet bearish), regime-coloured bars, Long/Short labels at confirmed flips.
The one-way ratchet: pullbacks cannot trigger a false exit; only a real reversal breaches the locked-in boundary.
No — signals print only on the bar where price closed through the boundary.
What it draws
The Sentinel boundary
Cyan when bullish, violet when bearish; the trend direction and the protective level in one line.
Long and Short entry labels
At confirmed regime changes only.
Regime bar colouring
Cyan bars above the boundary, violet below.
An optional regime background tint.
An on-chart symbol and timeframe tag.
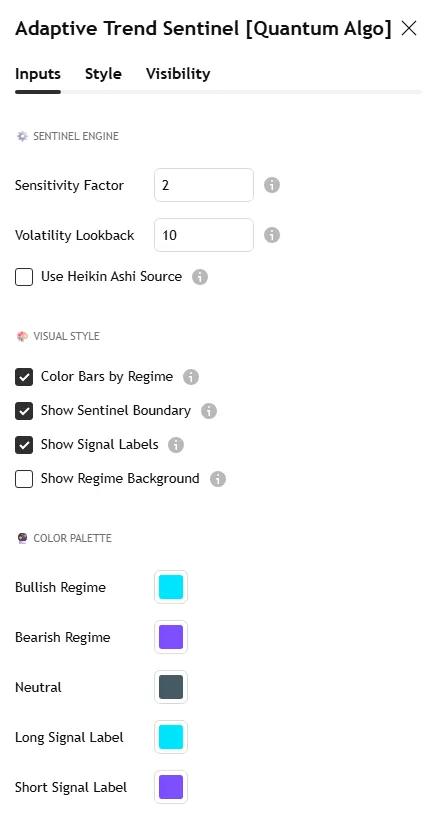
The GBP/AUD 6-hour screenshot on this page shows the boundary ratcheting through a trend with the regime flip labels; the settings screenshot shows the Inputs tab.
How it works — three stages
Volatility measurement. ATR over the Volatility Lookback establishes how wide the boundary needs to be right now; the Sensitivity Factor scales it — lower is tighter and faster, higher gives the trend more room.
Adaptive trailing boundary. In an uptrend the boundary is the maximum of its previous value or price minus the volatility distance — it can only rise. In a downtrend it is the minimum of its previous value or price plus the distance — it can only fall. When price crosses from the opposite side, the boundary resets to the new direction.
Regime detection. The regime is bullish above the boundary and bearish below; entry signals fire only on the exact bar where price crosses and confirms the change — no ambiguous bars.
The ratcheting edge
A simple trailing stop retraces when price pulls back — it follows price both ways and resets during every healthy pullback. The Sentinel never retraces: once the boundary has moved up, it stays or moves higher. A normal pullback within a trend cannot trigger a false exit; only a genuine reversal — price falling far enough to breach the locked-in boundary — generates a signal. That single design principle removes most of the whipsaws that plague standard trailing systems while keeping you protected against real reversals.
Heikin Ashi mode
An optional source mode calculates the boundary from Heikin Ashi candles, which average open, high, low and close and smooth intrabar noise — useful on 1-, 5- and 15-minute charts where standard candles produce frequent wicks that touch the boundary early. The trade-off is a small lag from the smoothing. For swing trading on 1H and above, standard mode is usually enough.
Settings
| Group | Input | What it does | Default |
|---|---|---|---|
| Sentinel Engine | Sensitivity Factor | Scales the ATR distance; lower = tighter and faster, higher = more room | 2.0 |
| Volatility Lookback | The ATR period | 10 | |
| Use Heikin Ashi Source | Smoother boundary, fewer noise signals, slight lag | off | |
| Visual Style | Color Bars by Regime | Cyan / violet candle tint | on |
| Show Sentinel Boundary | The trailing line | on | |
| Show Signal Labels | Long / Short at regime changes | on | |
| Show Regime Background | Subtle background tint | off |
Alerts
Four conditions: Quantum Algo Long Entry (confirmed bullish regime change), Quantum Algo Short Entry (confirmed bearish regime change), Bullish Regime Active (every bar above the boundary), and Bearish Regime Active (every bar below). All alerts carry ticker and timeframe for multi-chart monitoring.
How to use it
As the trend question, answered. "Is the trend still intact?" — the boundary answers on every bar.
As an entry trigger for systematic strategies. The regime-change signal is clean, binary and unambiguous — built for rule-based trading and for QuantumBot-style execution.
As a protective trailing stop. Add it to a position from any entry method; the boundary ratchets with your profit and exits only on a confirmed reversal.
As the direction filter for confluence. Sentinel for direction and timing, a momentum tool — the Institutional Pressure Oscillator or the TDI — for confirmation, and structure from the Smart Money Concepts Engine for location.
Three ways to trade it
The regime flip at structure.
A Long label that prints on a reclaim of a swept low or a return to demand is the highest-quality version — the Sentinel confirms the regime, structure gives the level, the boundary is the stop.
The ratchet ride.
Enter on the flip, size from the boundary distance, and do nothing until the opposite label; the boundary is the only exit. The discipline the tool was built for.
The multi-timeframe stack.
Sentinel bullish on the 4-hour and the 1-hour at once; take 15-minute entries in that direction only, and stand aside when the two disagree.
A worked example: one regime, start to finish
Bitcoin, 4-hour, sensitivity 2.0. Price has been in a bearish regime for nine days — violet bars, the boundary a falling ceiling that stepped down with every leg. A sweep of the range low on the 2-hour prints a bullish change of character on the Smart Money Concepts Engine; two bars later, the 4-hour candle closes above the Sentinel boundary and the Long label prints at $61,840. The boundary resets below price at $60,120 — the volatility distance — and that is the stop: risk $1,720 per coin, sized at 1% of the account. Over the next twelve days the boundary ratchets up seven times and never down; three pullbacks of $1,500–2,000 touch nothing, because the floor stays where it locked. On day thirteen a 4-hour close beneath the boundary at $68,400 prints the Short label — the exit, at +3.8R from entry. The trade had one decision at the start and one at the end; the boundary made every decision in between.
The Sentinel checklist
- The regime on the higher timeframe agrees, or the flip is on the higher timeframe itself.
- The flip lands at structure — a swept level, a demand or supply block, a ranked line.
- The stop is the boundary at the flip bar, sized to a fixed risk percentage.
- No action on pullbacks that stay inside the locked boundary.
- Exit on the confirmed opposite label, not on the raw touch and not on a feeling.
- Journal the regime length and the R-multiple; after fifty flips, compare markets and timeframes.
Recommended settings by market
Crypto perpetuals, 1H–4H
The design target: sensitivity 2.0, lookback 10, standard candles.
Forex and gold, 15m–1H:
Sensitivity 1.8–2.0; Heikin Ashi on below 15 minutes.
Index futures, 5m–15m:
Sensitivity 1.5–1.8, lookback 10, Heikin Ashi on for the open.
Daily charts:
Sensitivity 2.5–3.0, lookback 14; flips are swing-trade regime changes.
How it compares
Against a standard trailing stop: the Sentinel never retraces. Against a moving-average crossover: the boundary is volatility-proportional and adapts to the regime; a fixed-length average is tuned for one regime only. Against the SuperTrend Engine: the Sentinel is the pure ratcheting boundary with binary signals — simpler, faster to read; the engine adds the shield, statistics, grading and plans. Against Zeno: Zeno's signals are structure-based with targets; the Sentinel is the free regime layer that tells you which side to trade.
Limitations
Any ratcheting boundary lags a sharp reversal by the volatility distance, and a very tight sensitivity will whipsaw in chop. Heikin Ashi mode adds a small delay. The tool answers direction and invalidation; it does not supply targets or location — structure does.
Step-by-step: adding it to your TradingView chart
Open the script page on TradingView (link above) and click Add to favorites, then Use on chart — or on any chart open Indicators, search "Adaptive Trend Sentinel Quantum Algo" and add it. Free on every TradingView plan.
Open the indicator's settings and set the inputs for your market and timeframe from the table above; the defaults are tuned for crypto on intraday and 4-hour charts.
In the Style tab, match the colours to your chart theme; the dashboard position and text size are in Inputs.
To set alerts, right-click the chart → Add alert, choose the indicator as the condition and pick the event; set "Once per bar close" so alerts match the closed-bar logic.
Save the layout, and add the other free Quantum Algo tools to it — they are designed to sit together.
To read or reuse the code, click Source code on the script page; republishing is subject to TradingView's house rules.
Inside the code, for developers
Pine Script, open source. Worth reading if you want to modify it: every detection and signal gated on barstate.isconfirmed; state held in capped arrays of drawing objects with explicit create, update and retire functions; statistics kept in first-in-first-out arrays with shrinkage and a Wilson bound computed inline; named alertcondition calls so webhooks receive a consistent payload. The Academy's Pine Script tutorials and the TradingView backtesting guide cover strategy conversion.
Using it with the other free indicators
The free tools layer on one chart: the Smart Money Concepts Engine for bias and the Confluence Score; Order Blocks with Volume, Fair Value Gaps + Inversion and Institutional Key Levels for the zone; Liquidity Sweeps, Sessionscope and Liquidation Magnet for the liquidity and the trigger; OTE + Silver Bullet for the time-qualified entry; the Institutional Volume Profile and Pressure Oscillator for whether volume agrees; and the trend and volatility family — the Adaptive Trend Sentinel, SuperTrend Engine, Golden Cross Engine, Anchored VWAP Engine, Trendline Architect, Keltner Rings and Volatility Storm Tracker — for regime, direction and the room a move has. The free-indicators hub lists every tool; the SMC guide is the method behind the layering.
Common mistakes with this indicator
- Trusting the developing bar — every event waits for the close.
- Trading every marker — the tool gives regime and context; the entry needs a structure level and a stop beyond it.
- Default lengths on the wrong timeframe — adjust the inputs, as the settings table shows.
- Reading the statistics as promises — they describe this chart's history, shrunk toward neutral on purpose.
- Stacking ten random scripts — the free tools layer because they were built to.
Want the signal, not just the structure?
Zeno reads Smart Money structure across timeframes and prints the entry, stop, TP1 and TP2 on your chart — with a public record of 160 posted trades, 120 wins and 40 losses at the stated levels. QuantumBot executes it on Bybit, Binance, OKX, Bitget and Kraken.

Glossary for this indicator
Frequently asked questions
Does the Adaptive Trend Sentinel repaint?
No. The boundary is computed from confirmed bars and a signal prints only on the exact bar where price crossed and closed beyond it.
What is the best sensitivity factor?
2.0 is the default and suits crypto and forex on 1H–4H; go to 1.5–1.8 for fast intraday charts and 2.5–3.0 on the daily. Lower is faster and noisier; higher is smoother and later.
Why did a signal not fire on a pullback?
Because the boundary never retreats: a pullback that stays above the locked-in floor is not a regime change. That is the design.
Should I turn on Heikin Ashi?
On 1-, 5- and 15-minute charts, yes — it removes wick-driven early touches at the cost of slight lag; on 1H and above, standard candles are usually enough.
Can I use it as a stop for a Zeno trade?
Yes — add it to the chart, treat the boundary as the trailing stop, and exit on the confirmed opposite label rather than the raw touch.
How does it relate to Zeno?
Zeno prints entries with stop and targets from structure; the Sentinel is the free regime and trailing-stop layer that sits under it.
Is the Adaptive Trend Sentinel a buy/sell indicator?
It prints Long and Short labels at confirmed regime changes, so yes in the literal sense — but the label is a regime change and a stop level, not a target. Location and targets come from structure.
What makes it different from a SuperTrend?
Both ratchet with ATR. The Sentinel is the pure, simple version with binary signals and a Heikin Ashi option; the SuperTrend Engine adds the whipsaw shield, statistics and trade plans. Many traders run the Sentinel for direction and the engine for management.
Why is it the most-used Quantum Algo script?
Because it answers one question cleanly on every bar — is the trend intact, and where does it flip — and the signal is binary enough to feed a rule-based system.
Can I feed the alerts to a bot?
Yes — the four alert conditions carry ticker and timeframe, and the regime-change signal is unambiguous; QuantumBot-style execution is the natural use.
Which timeframe is best?
1H–4H on crypto is the design target; it works on any timeframe with the sensitivity adjusted as the tuner shows.
How does it relate to Zeno?
Zeno prints entries with stop and targets from structure; the Sentinel is the free regime and trailing-stop layer under them.
The trend and volatility family
Regime, direction and room — the tools built to sit under the Smart Money layer.
Add Adaptive Trend Sentinel to your chart
One click on TradingView, free on every plan, code you can read. Nothing repaints.