Iceberg Orders: How Hidden Size Shows Up on the Tape, and How to Trade It
An iceberg order is a limit order that shows only part of its size in the order book — a display quantity of 50 on a 500-lot, say — and reposts another 50 at the same price each time the visible part fills, until the hidden reserve is gone. You cannot see the reserve, but you can see its effect: far more volume trades at the level than the book ever displayed, the displayed size keeps reappearing, and price refuses to move through it. That absorption is the signal, and the trade is to lean on the iceberg with a stop just beyond it, not to fade it.
Icebergs were the first thing that made me stop trusting the order book. A level showing 60 contracts should not absorb 600, and when it does, the book has lied — or rather, it has told the truth about the tip and nothing about the rest. This page is the mechanism and the reload, native versus synthetic, the five signals on the DOM and the footprint, how an iceberg turns an order block from a drawing into a defended price, an ES morning worked tick by tick, the five ways the reading fails, and a detector that scores what you can see.
Indicators that prove themselves in public.
One engine, four precision tools — the Gold (XAU) Scalper, the institutional Gravity Zone, the Zeno momentum Oscillator, and Zeno Stocks for equities.



What is an iceberg order?
An iceberg order is a limit order that shows only part of its size in the order book. A trader who wants to buy 500 ES contracts at 4,512.25 enters the order with a display quantity of 50; the book shows 50 at the bid, the other 450 wait as a hidden reserve, and each time the visible 50 is filled the exchange posts another 50 at the same price until the reserve is gone. The visible clip is the tip; the reserve is the rest of the iceberg, and the name is exactly as literal as it sounds.
The reason for hiding size is the same reason a TWAP slices by time: a 500-lot bid sitting in the book is an announcement. Every order-flow trader sees it, prices move away from it, and the buyer never gets filled — or gets filled only when the market is going through them. An iceberg gets the same size done at the same price without the announcement, and pays for the privilege with queue position: on CME Globex each new clip goes to the back of the queue at that price, behind orders that arrived after the original.
What an iceberg does not do: it does not move price. It defends a price. The trader behind it wants to buy at 4,512.25 and is willing to wait; the market comes to them or it does not. That passivity is why icebergs read as absorption on the footprint and as a wall that refuses to break on the DOM, and why the trade is to lean on them, not to fade them.
How the reload works
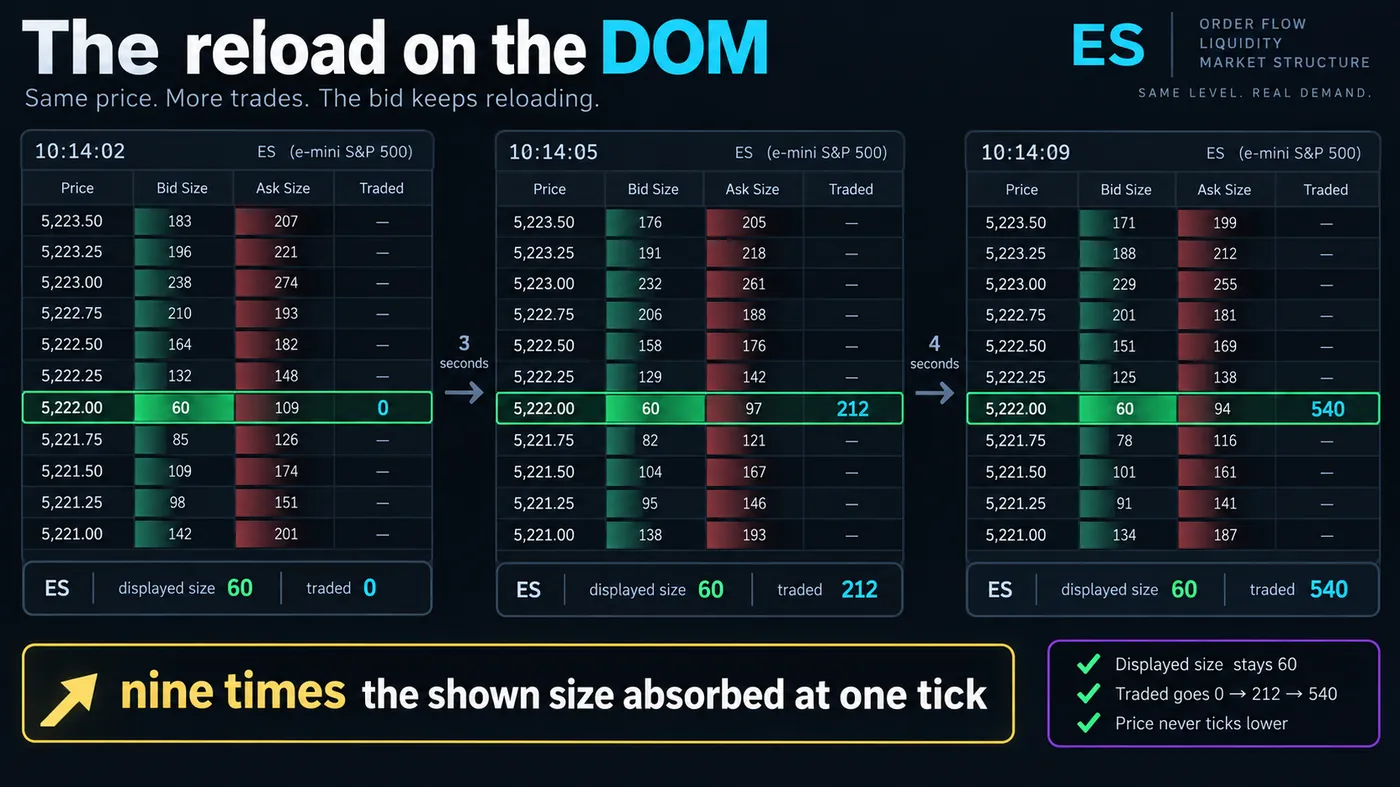
Take the diagram's numbers. The bid at 4,512.25 shows 60. Sellers hit it: 212 contracts trade at that price in three seconds. A normal 60-lot bid would have been gone after 60 and the price would have ticked down to 4,512.00. Instead the book still shows 60 and price has not moved. Nine seconds in, 540 have traded, the bid still shows 60, and 4,512.25 is still the best bid. The displayed size has reloaded eight or nine times. Nine times the shown size has been absorbed at one tick.
That is the whole detection logic, and it needs three things: the displayed size, the volume that has traded at the level, and whether price has moved through it. Volume far above displayed size plus a level that holds equals hidden liquidity. The detector further down scores exactly those three inputs.
Native versus synthetic. A native iceberg is managed by the exchange's matching engine — CME Globex, Eurex, ICE and most equity venues support them, and on Globex the order keeps one order ID across every reload, which is how academic researchers detect them after the fact from full-depth data. A synthetic iceberg is managed by the trader's software: the platform holds the reserve and re-submits a fresh limit order each time the clip fills. Synthetic icebergs are indistinguishable from ordinary orders at the exchange level and can only be inferred from the reload pattern. On the DOM they look the same; the only practical difference is that a synthetic one can be pulled instantly, and often is.
Why institutions use them
- To buy or sell size at a chosen price without telling the market the size exists. A 2,000-lot sitting visibly in the book at a support level invites everyone to front-run it and nobody to trade into it.
- To defend a level. A market maker or a fund with an existing position may want 4,512.25 to hold, and an iceberg there is the cheapest way to make it hold for as long as the reserve lasts.
- To accumulate against a stop run. Icebergs placed just below an obvious pool of sell stops absorb the stops as they trigger — the liquidity sweep is somebody's fill.
- To trade around an announcement without paying the spread. A passive iceberg collects the spread instead of paying it, at the cost of not being sure it completes.
- In crypto, to work an OTC-sized position on an exchange. Binance offers native iceberg orders on spot with a minimum display of a fraction of the total; on the perpetuals the same job is usually done synthetically by execution bots.

Automate your trades. Let Quantum Algo trade for you.
Every signal executed on your own account — on your account, with the plan you define.
How to spot an iceberg
Five signals, in the order they show up. One is a hint; three together are a reading.
| Signal | What you see | Where you see it | What it means |
|---|---|---|---|
| 1. The level refuses to move | Price sits at one tick while the tape prints against it | DOM, time and sales | Something is absorbing; could be a queue of small orders, could be one hidden one |
| 2. Traded volume exceeds displayed size | Displayed 60, traded 200, 400, 600 at the same price | DOM with a traded-volume column; Bookmap; footprint | The visible order is being refilled from somewhere — the core signal |
| 3. The displayed size reappears | The bid drops to 20, snaps back to 60, drops to 35, snaps back to 60 | DOM, replay | The reload. Native icebergs reload in the same clip size; synthetic ones may vary |
| 4. Delta diverges from price | Cumulative delta makes a new low, price does not | CVD, delta divergence tools | Aggressive sellers are being absorbed by passive buyers |
| 5. Heavy bid-side volume at one price on the footprint | A single price row with 480, then 620, then 540 on the bid side across consecutive candles | Footprint chart | The iceberg from the volume side rather than the book side |
You need a data feed that shows depth and trade volume by price — a futures platform with a DOM (Sierra Chart, Jigsaw, ATAS, Quantower), a heatmap tool like Bookmap, or a footprint chart. TradingView's standard candles and volume histogram cannot show an iceberg directly; the closest you get there is the delta divergence and the failure of a level to break on heavy volume, which is the effect without the mechanism.
Iceberg detector
Put in what the book shows, what has traded at the level, how many times the displayed size has come back, whether the level has held, and the typical aggressor volume per interval. The tool scores the evidence and says whether to lean on the level.
Icebergs and Smart Money Concepts
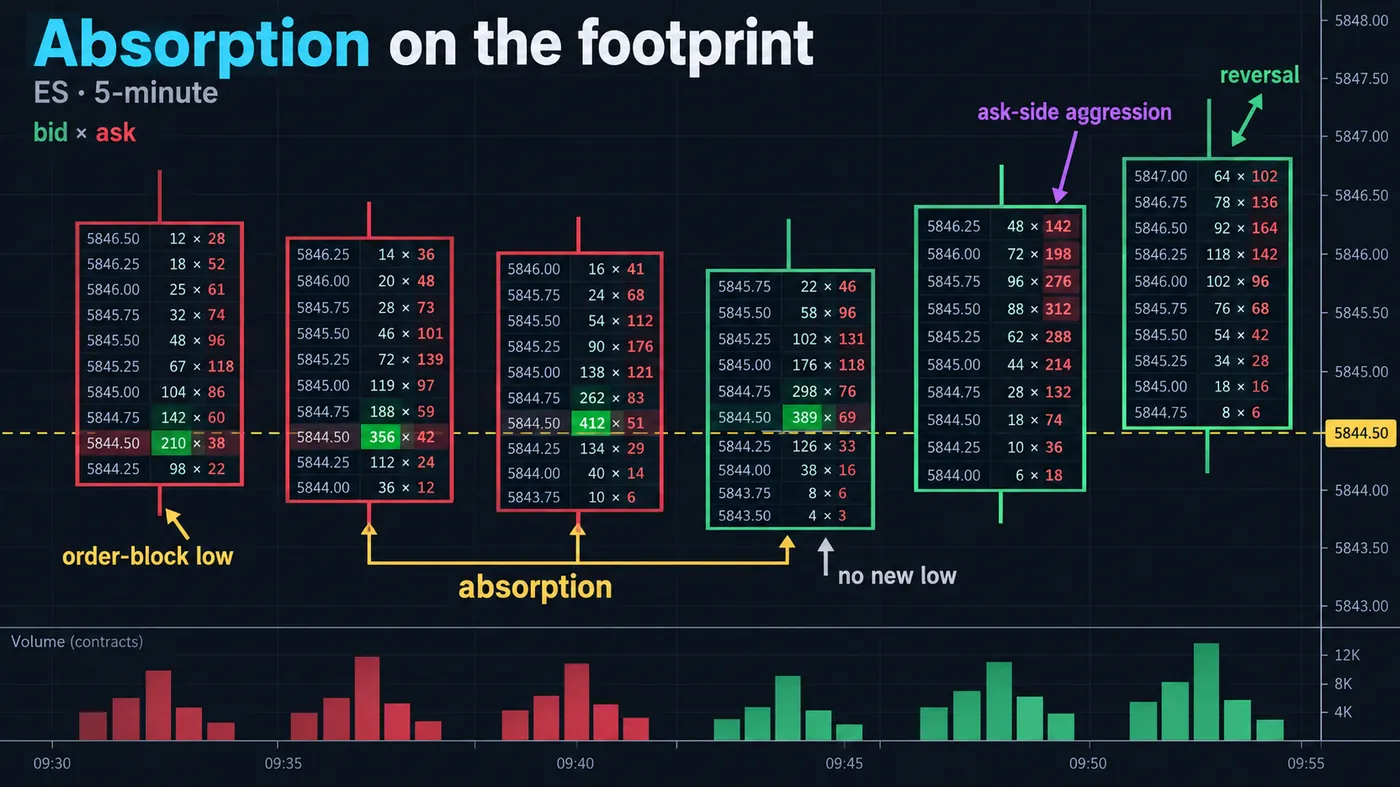
The SMC vocabulary describes the location; the iceberg is one of the mechanisms that makes the location hold. An order block is the last down-candle before an impulsive move up — a place where a large buyer was filled once and, the theory goes, will defend again. On the footprint, "defend again" often looks like the diagram: 480, 620 and 540 contracts hit the bid at 4,511 across three candles and the low never breaks, then the ask side takes over and the market lifts. That is an iceberg bid at the order block low, and it is the difference between a block that is respected and one that is run through.
The same applies to a sweep. A swing failure below a level with a fast close back above it frequently has an iceberg two or three ticks under the level, placed exactly where the stops trigger. The stops sell into it, the reserve absorbs them, and the reversal is the reserve's owner being filled. Order-flow traders see the absorption; SMC traders see the wick. It is the same event.
Where the two disagree is on what to do next. The SMC trade at an order block is a limit at the block with a stop below it; the order-flow trade is to wait until the iceberg has visibly absorbed, then buy with a stop one tick under the iceberg's price. The second entry is later and tighter, because the stop is behind a known buyer rather than behind a drawn box.
Reference data
| Item | Value |
|---|---|
| Definition | A limit order that displays only part of its total quantity; the remainder is hidden and reposted as the visible part fills |
| Parameters | Total quantity, display (peak) quantity, limit price, time in force |
| Native venues | CME Globex, Eurex, ICE, most equity exchanges; Binance spot (iceberg order type) |
| Synthetic | Managed by the trading platform or an execution bot; reposted as ordinary limit orders |
| Queue priority (Globex) | Each reloaded clip goes to the back of the queue at that price |
| Detection inputs | Displayed size, volume traded at the price, number of reloads, whether the level held |
| Rule of thumb | Traded volume more than ~3x the displayed size at a level that has not moved, or three or more reloads |
| Tools that show it | DOM with traded-volume column, Bookmap heatmap, footprint charts, cumulative delta |
| Academic reference | Christensen and Woodmansey (2013); Mazur, Dunn and Bahar, "CME Iceberg Order Detection and Prediction" (2019) |
| Trade around it | Lean on the iceberg (fade the aggressors into it) with the stop one or two ticks beyond; exit when the reload stops |
Worked example: ES, an iceberg bid at the overnight low
ES on a Thursday, 10:14 ET. The overnight low was 4,512.25 and price came down to it for the second time that morning with a 15-minute order block from 4,511.00 to 4,513.50 sitting on top of it. The DOM showed 60 at the bid, ordinary for that level. Between 10:14:20 and 10:14:32 the tape printed 212 contracts at 4,512.25; the bid still showed 60. By 10:15:05, 540 had traded there and the bid still showed 60. Price had not ticked to 4,512.00 once. The detector scores that as high confidence: nine times the displayed size, eight reloads, level held.
The 10:15 footprint candle showed 620 on the bid side at 4,511.75 — one tick lower, the iceberg had stepped down, which they sometimes do — against 35 on the ask, and the candle closed at 4,513.00 with a lower wick. Cumulative delta on the 1-minute chart had made a new low at 10:15 while price had not. Long at 4,513.25 on the 10:16 candle, stop at 4,511.25, two ticks under the iceberg's last price, eight ticks of risk. Target the 10:05 swing high at 4,518.75, twenty-two ticks, 2.75R.
Price reached 4,517.00 by 10:24 and the iceberg's reload stopped at 10:19 — the bid at 4,511.75 dropped to 12 and did not come back — which was the cue to trail the stop to 4,514.75. The 10:31 candle printed 4,518.75 and the target filled. Eleven ticks of profit for eight of risk on the runner, but the important number is the stop: two ticks under a buyer who had already absorbed 1,600 contracts, rather than twelve ticks under a box.
Where iceberg reading fails
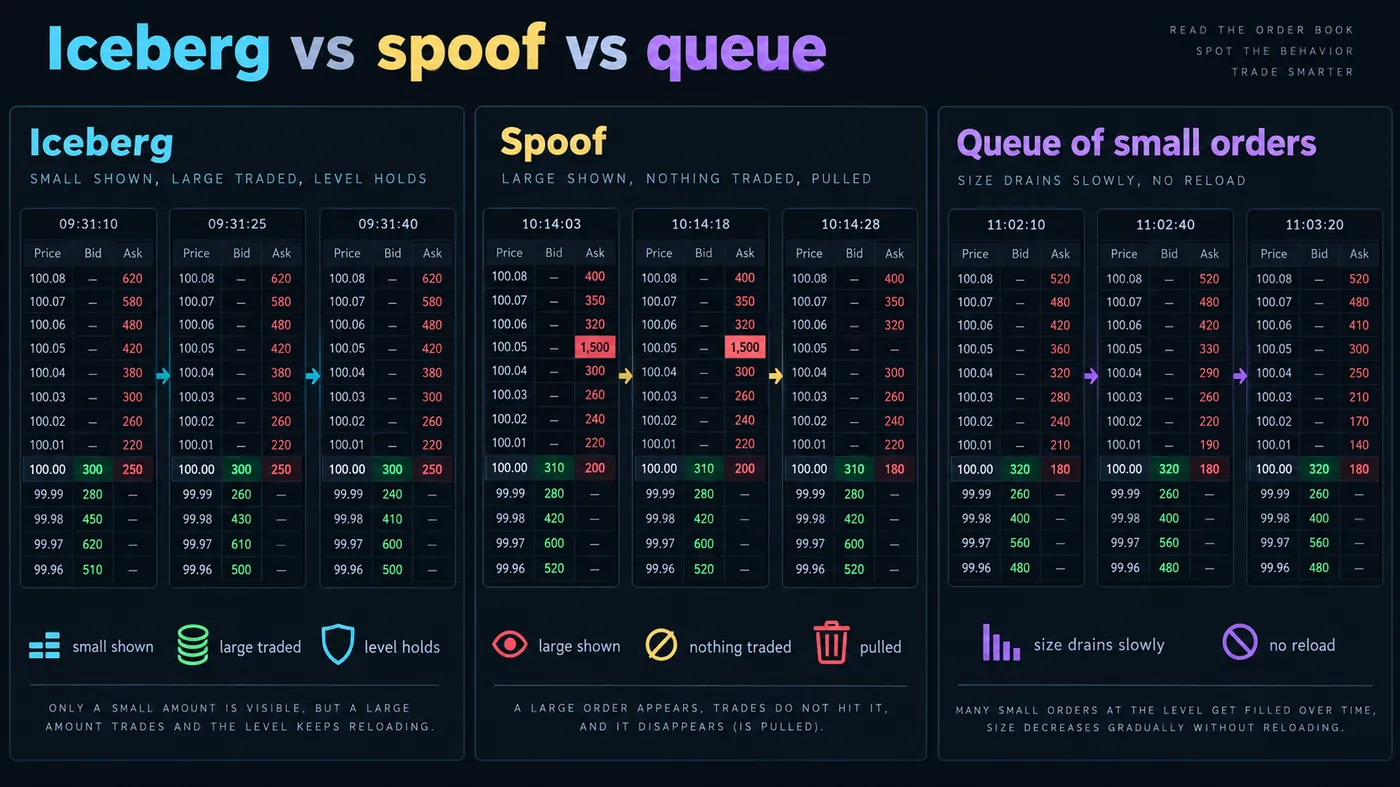
Pulled icebergs. A synthetic iceberg can be cancelled between reloads. The level that absorbed 800 contracts for two minutes goes quiet, the displayed size drops to a normal figure, and the next seller through it finds nothing. This is the most common way the trade loses, and it is why the exit rule is "when the reload stops", not a fixed target.
Spoofing. A large visible order that is pulled before it fills is the opposite of an iceberg — size shown, none intended — but it produces a similar "the level is holding" impression for a few seconds. The tell is that a spoof is never traded into; volume at the level stays low. An iceberg is defined by volume traded against it.
Queues of small orders. Twenty traders each with a 30-lot at a round number absorb 600 contracts as well as one iceberg does, and there is no reload — the displayed size simply does not fall as fast as it should. The reading is the same in practice (the level is being defended) but the defence can evaporate one trader at a time.
Thin or fast markets. In the first minute after a data release the DOM turns over too fast to count reloads, and in an illiquid contract a single 200-lot is an iceberg in effect without being one. Read icebergs in normal conditions on liquid instruments: ES, NQ, CL, ZN, the front-month Bitcoin perpetual on a major exchange.
The other side. An iceberg bid absorbing sellers does not mean the market will rise. It means the market will not fall through that price while the reserve lasts. If the reserve is 500 and the sellers have 2,000, the iceberg finishes and price goes through it. Lean on it with a stop, and leave when it stops reloading.
Mistakes traders make with icebergs
- Fading a visible wall. A large displayed order is not an iceberg; it is either real (and will move away from you) or a spoof (and will vanish). Icebergs are small displayed sizes with large traded volume.
- Buying the level before it has absorbed. The reading needs traded volume; a 60-lot bid that nobody has hit yet is just a 60-lot bid.
- Holding after the reload stops. The bid at that price is finished. The rest of the market has no obligation to it.
- Reading icebergs on a platform that cannot show them. Candles and a volume histogram show the effect (a level held on heavy volume) but not the mechanism; do not claim to see a reload you cannot see.
- Confusing absorption with accumulation. An iceberg defends a price; it does not predict a rally. Direction still comes from structure.
- Ignoring queue position when placing your own iceberg. On Globex each reload goes to the back of the queue; a smaller display quantity means more reloads and more time waiting behind others.
Icebergs and the free indicators
None of the TradingView scripts in the library can read the order book, because TradingView does not provide depth data to Pine. What they can show is the consequence: the Pressure Oscillator highlights bars where heavy volume produced almost no range, which is absorption from the candle's side, and the Order Blocks with Volume script grades blocks by the volume that formed them, so the levels most likely to have a defender are the ones it ranks highest. For the mechanism itself you need a DOM or a footprint. The premium engine, Zeno, prints buy and sell signals with a stop and targets; a buy signal that prints at a level where the footprint shows absorption is the highest-quality version of that signal I know of.
Hidden size, visible effect. An iceberg shows a small clip and reloads it at the same price until the reserve is gone, so the tell is volume traded at a level far above what the book displayed while price refuses to move. Native ones reload at the exchange, synthetic ones through the trader's software, and both look the same on the DOM. Lean on the iceberg with a stop just beyond it, use it to grade order blocks and sweeps, and exit the moment the displayed size stops coming back.
◆ Interactive check
Do you know what the book is hiding?
Questions traders ask about iceberg orders
A large limit order that only shows a small piece of itself in the order book. When that piece fills, the exchange (or the trader's software) posts the next piece at the same price, and so on until the whole order is done. The market sees 50 contracts; the trader has 500.
Watch a price level on the DOM or the footprint. If far more volume trades there than the book ever displayed, the displayed size keeps coming back, and price does not move through the level, something hidden is absorbing. Three or more reloads, or traded volume more than about three times the displayed size, is a reading.
A native iceberg is an order type the exchange manages — CME Globex, Eurex, ICE and most stock exchanges offer it — and the matching engine reposts the clips. A synthetic iceberg is managed by the trader's platform, which holds the reserve and submits fresh limit orders. They look identical on the DOM; the synthetic one can be pulled between clips.
Not directly — TradingView has no order-book data in Pine and its DOM is broker-dependent. You can see the effect: a level that holds on heavy volume, delta divergence, and bars with large volume and tiny range. To see the reload itself you need a futures DOM, Bookmap, or a footprint chart.
Yes. Binance offers a native iceberg order type on spot, and execution bots run synthetic icebergs on the perpetuals across Binance, Bybit and OKX. They show up the same way: a level on BTCUSDT that absorbs many times its displayed size without moving.
To get size done at a chosen price without announcing the size. A visible 2,000-lot invites front-running and scares off counterparties; an iceberg collects fills quietly, defends the level, and pays for it only in queue position.
An order block is where a large buyer was filled before an impulsive move; an iceberg at the block's low is what makes the block hold when price returns. On the footprint it shows as heavy bid-side volume at one price across several candles with no new low — absorption. The order-flow entry is after the absorption is visible, with the stop just under the iceberg's price.
A spoof is a large visible order that is cancelled before it fills — size shown, none intended. An iceberg is a small visible order with large hidden intent, defined by the volume that trades against it. If the level has not been traded into, it cannot be an iceberg.
You do not trade against it; you trade with it. Fade the aggressors into the level with a stop one or two ticks beyond the iceberg's price, take profit at the next structure, and exit if the displayed size stops reappearing — that means the reserve is finished or has been pulled.
No Pine script can read the order book. The Pressure Oscillator flags bars with heavy volume and little range, which is absorption from the candle's side, and Order Blocks with Volume ranks blocks by the volume that built them. For the reload itself you need a DOM or footprint. Zeno, the premium engine, prints signals with stops and targets and does not read depth data.
References & Related Guides
Read next
- Order Flow Trading
- Footprint Chart Trading
- Cumulative Volume Delta (CVD)
- Delta Divergence
- Order Blocks: Complete Guide
- Liquidity Sweep Trading
- TWAP Explained
- Bookmap Review
- Order Types Explained
- Absorption — glossary
- Pressure Oscillator (free indicator)
- Zeno — the premium engine