Absorption
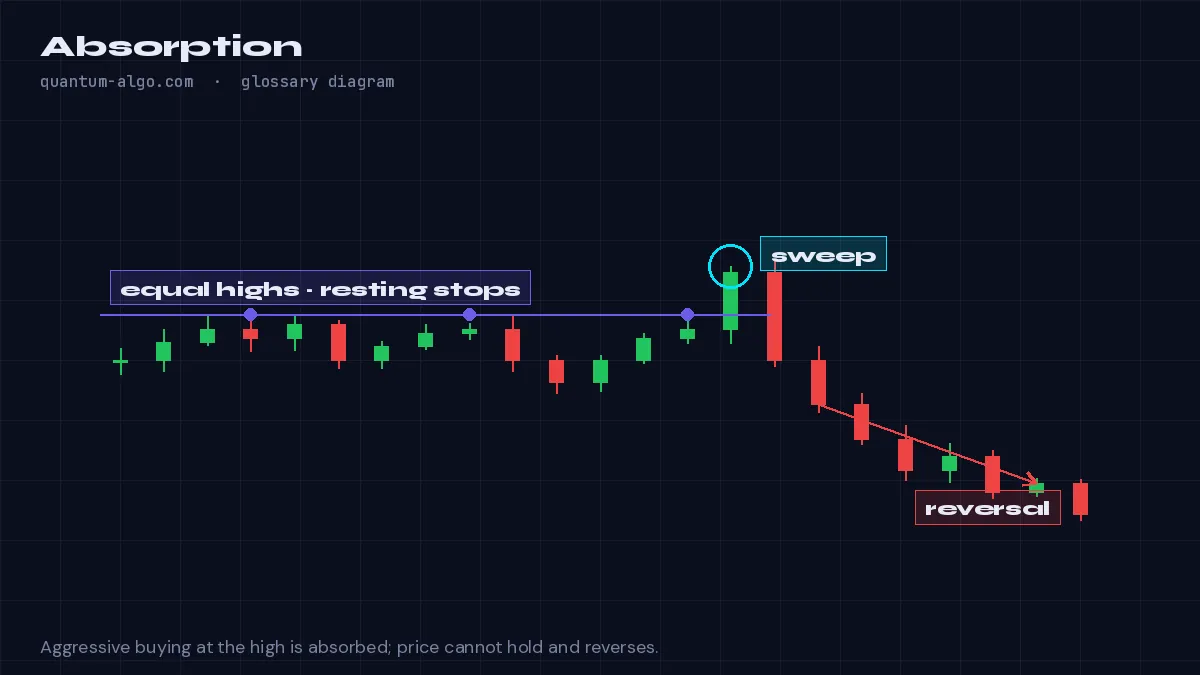
Absorption is when heavy aggressive buying or selling hits a price level and fails to move it because large passive orders are filling everything — visible as a delta spike with no price progress — and it usually precedes a reversal.
What it means
Markets move when aggressive orders exceed the passive orders resting at a price. Absorption is the opposite: aggression arrives and is swallowed. On a footprint chart it appears as very high volume at one level with price stalling; on CVD as delta racing ahead of price; on the candle chart as a long wick or a series of small-bodied bars at a level on high volume.
Absorption is the order-flow explanation for why liquidity sweeps reverse: breakout buyers above equal highs are filled by a large seller who wanted that liquidity, and once the aggression is exhausted the seller's remaining size pushes price back. Icebergs — large orders shown in small pieces — are the mechanism.
Trading it means fading the aggressive side once the stall is confirmed: a bearish reversal after buying absorption at a high, a bullish reversal after selling absorption at a low, with the stop beyond the absorption level.
How to identify it on a chart
- Locate a level where volume spikes but price stalls (footprint or volume profile).
- Confirm with CVD extending while price does not.
- Enter against the absorbed side on the first structure break; stop beyond the level.
Worked example
At the previous day's high, ES prints 4,000 contracts of market buying inside two ticks and does not move. CVD makes a new high; price does not. Ten minutes later a 5-minute close below the last higher low confirms the absorption — the short targets the session low.
See it on the chart, read it in depth
Frequently asked questions
How is absorption different from exhaustion?
Absorption is aggression met by passive size; exhaustion is aggression running out. Both stall price, but absorption shows high volume at the level and exhaustion shows falling volume.
Can I see absorption without a footprint chart?
Approximately: a volume spike with a small body or long wick at a key level, plus CVD divergence.
What is an iceberg order?
A large passive order displayed in small pieces that refill as they are filled — the usual source of absorption.
Does absorption always reverse price?
No; sometimes the passive side is overrun. Wait for the structure break before trading it.
Related terms
See Absorption on your TradingView chart
Zeno reads Smart Money structure across timeframes and prints the entry, stop and targets — with a public record of every posted trade. The free indicators draw the concepts this page defines.