Institutional Pressure Oscillator [Quantum Algo]
Directional volume pressure with a volatility-adaptive noise gate, a participation cap and log normalisation — a zero-centred read of buying versus selling conviction with a trigger line and a conviction histogram. The OBV replacement built for crypto and futures.
The short answer
The Institutional Pressure Oscillator is a free, open-source TradingView indicator that measures directional volume pressure — whether net buying or selling is dominant, how strong the conviction behind the move is, and where momentum is shifting — using a volatility-adaptive noise gate to separate institutional conviction from market noise. Unlike standard volume indicators that treat every bar equally, or on-balance volume which assigns direction from a simple up-close/down-close, it applies logarithmic normalisation and an adaptive threshold so only bars whose price move was meaningful relative to current volatility contribute, caps anomalous volume spikes, and accumulates the classified pressure over a rolling window into a zero-centred oscillator with a trigger line and a conviction histogram.
Net buying vs selling pressure over a rolling window, counting only bars that moved meaningfully for the current volatility.
Zone for bias, trigger crossovers for timing, histogram for strength, divergence for warnings.
Noise gate, participation cap, log normalisation, and a conviction histogram OBV does not have.
What it draws
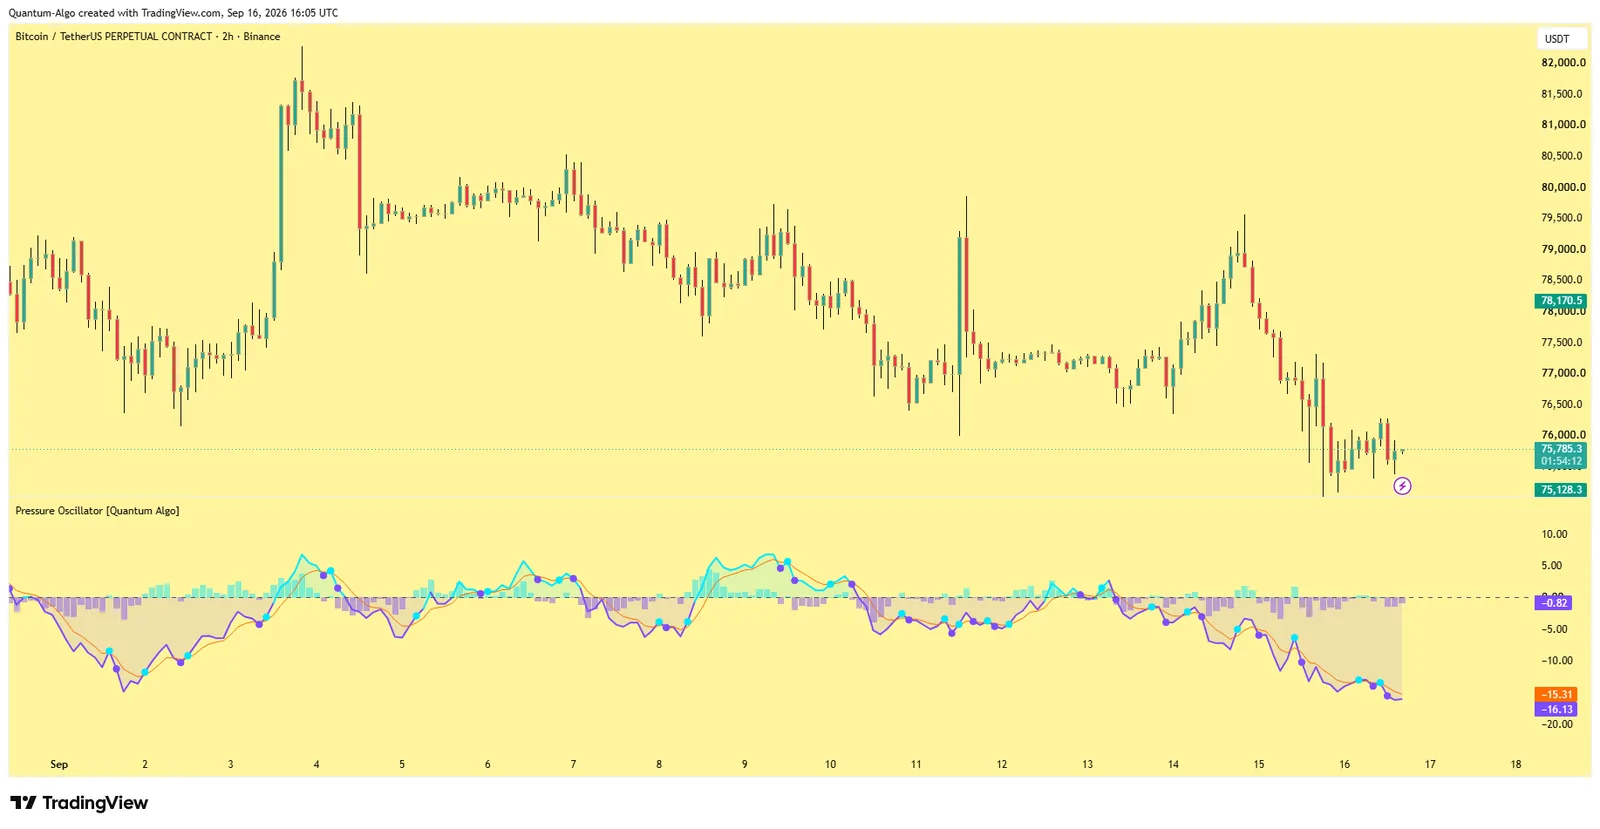
The oscillator
A zero-centred line: above zero, net buying pressure is dominant; below, net selling. Distance from zero is conviction.
The trigger line
An EMA of the oscillator; crossovers mark momentum acceleration.
The conviction histogram
The spread between the oscillator and its trigger; expanding bars mean the current pressure is gaining strength, contracting bars mean it is fading.
Pressure zones
Shading between the oscillator and zero, in distinct colours for accumulation and distribution phases.
Crossover markers
Circular markers where the oscillator crosses its trigger.
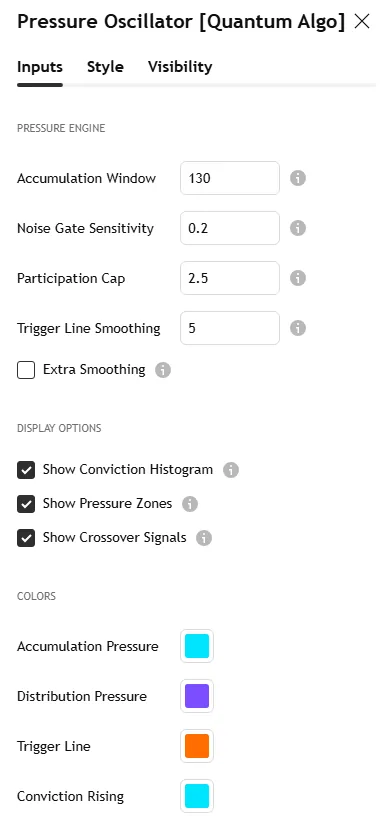
The Bitcoin 2-hour screenshot on this page shows the oscillator pane under price with the histogram and a pressure-zone flip; the settings screenshot shows the Inputs tab.
How it works — the five stages
Logarithmic price differential. Log-returns between consecutive bars instead of raw price change, so the noise gate behaves consistently on sub-penny coins and five-figure contracts alike.
Adaptive noise gate. A rolling 30-bar standard deviation of log-returns establishes the volatility regime; the Noise Gate Sensitivity parameter scales it into a threshold. Moves below the threshold are noise and get zero pressure attribution, so choppy, low-conviction bars cannot pollute the reading.
Participation normalisation. A rolling average of volume over the accumulation window is the baseline; any single bar's contribution is capped at a multiple of it (the Participation Cap), so flash crashes, wash trades and liquidation spikes cannot dominate.
Directional classification. Each bar that passes the gate contributes its capped volume as positive (price moved up through the gate) or negative (down through it); bars that fail the gate contribute nothing.
Cumulative pressure and signals. Classified pressure is summed over the window, divided by the participation baseline, optionally smoothed; the trigger EMA tracks it, and their difference is the histogram.
Why it is different from OBV and standard volume
Volume bars show participation but not direction. On-balance volume and its cousins assign direction from whether the close is above or below the previous close — noisy and unreliable on wicks and dojis. This oscillator fixes both: the logarithmic noise gate counts volume only on bars where price actually moved meaningfully for the current volatility; the participation cap neutralises the exchange-generated spikes, liquidation cascades and wash trading that make crypto volume indicators lie; the conviction histogram adds the momentum dimension flow indicators lack; and the logarithmic normalisation means one set of parameters works across instruments without retuning. Our OBV and volume guides cover the standard tools this replaces.
How to read it
| Reading | Meaning |
|---|---|
| Oscillator above zero | Net buying pressure dominant; further above, stronger conviction |
| Oscillator below zero | Net selling pressure dominant; depth reflects selling conviction |
| Bullish trigger crossover | Buying momentum accelerating |
| Bearish trigger crossover | Selling momentum accelerating |
| Histogram expanding | The current pressure is gaining strength |
| Histogram contracting | The move is losing momentum; often precedes a crossover or a zone flip |
| Divergence vs price | Price makes a higher high, the oscillator a lower high (or the reverse): participation is not confirming the move — the most reliable early warning it gives |
Settings
| Input | Default | What it does |
|---|---|---|
| Accumulation Window | 130 | Lookback for cumulative pressure; higher = smoother, trend-oriented; lower = more sensitive to recent shifts |
| Noise Gate Sensitivity | 0.2 | Volatility-scaled threshold below which moves are ignored; raise to be more selective |
| Participation Cap | 2.5 | Maximum single-bar contribution as a multiple of the rolling average |
| Trigger Line Smoothing | 5 | EMA period for the trigger; lower = faster, noisier crossovers |
| Extra Smoothing | off | An additional SMA pass for a cleaner line at the cost of lag |
| Show Conviction Histogram | on | The momentum spread bars |
| Show Pressure Zones | on | Accumulation/distribution shading |
| Show Crossover Signals | on | Circular markers at trigger crosses |
How to use it
Bias from the pressure zone. Above zero favours long setups; below zero favours shorts.
Timing from crossovers. A bullish crossover in a positive zone confirms buying acceleration; a bearish crossover in a negative zone confirms selling acceleration.
Warnings from divergence. A new price high with a lower oscillator high says the move is losing institutional backing — the cue to tighten stops or skip the breakout.
Strength from the histogram. Expanding bars confirm; contracting bars warn.
Confirm structure, do not replace it. The oscillator says whether volume supports the move; the Smart Money Concepts Engine, Order Blocks with Volume and the Fair Value Gaps tool say where the move is coming from.
Three ways to trade it
Breakout confirmation.
A break of a ranked level (Institutional Key Levels) or a value-area edge (Institutional Volume Profile) with the oscillator crossing its trigger in the same direction and the histogram expanding — the break has participation. Without it, the break is a candidate sweep.
Divergence at a zone.
Price sweeps a high into a supply block while the oscillator prints a lower high; the sweep has no conviction behind it, and the reversal has the oscillator's warning plus the block's location.
Pressure-zone flip on the higher timeframe.
On 4H or daily, the oscillator crossing zero after a long stay on the other side marks a regime change; use it as the bias filter for lower-timeframe entries.
Recommended settings by market
Crypto perpetuals, 4H and daily
The design target: defaults; institutional volume patterns are most visible here and the participation cap does its best work.
Index futures, 1H–4H:
Window 100, sensitivity 0.25; exchange volume is real.
Stocks, daily:
Defaults; watch divergence into earnings.
Forex CFDs:
Tick volume makes readings indicative; raise the sensitivity to 0.3 and treat the histogram as a momentum read rather than a participation read.
How it compares
Against OBV and accumulation/distribution: those count every bar by close direction; this gates bars by volatility-scaled move size and caps anomalies. Against the Chaikin Money Flow and MFI family: those are bounded ratios of position-in-range; this is cumulative, direction-classified, capped pressure with a momentum layer. Against the Zeno Oscillator: Zeno's oscillator is the premium momentum and reversal layer inside the Zeno suite; this free tool is the volume-pressure read that complements it.
Limitations
The oscillator depends on volume quality — exact on exchanges and futures, indicative on CFD tick volume. It measures pressure, not price; divergences can persist longer than a position can. Higher accumulation windows lag; lower ones whipsaw. No indicator is profitable on its own.
Step-by-step: adding it to your TradingView chart
Open the script page on TradingView (link above) and click Add to favorites, then Use on chart — or on any chart open Indicators, search "Institutional Pressure Oscillator Quantum Algo" and add it. Free on every TradingView plan.
Open the indicator's settings and set the inputs for your market and timeframe from the table above; the defaults are tuned for crypto and gold.
In the Style tab, match the colours to your chart theme; the dashboard position and text size are in Inputs.
To set alerts, right-click the chart → Add alert, choose the indicator as the condition and pick the event; set "Once per bar close" so alerts match the closed-bar logic.
Save the layout, and add the other free Quantum Algo tools to it — they are designed to sit together.
To read or reuse the code, click Source code on the script page; republishing is subject to TradingView's house rules.
Inside the code, for developers
Pine Script, open source. Worth reading if you want to modify it: pivot confirmation with ta.pivothigh / ta.pivotlow and a symmetric lookback (the source of the deliberate lag); state held in capped arrays of drawing objects with explicit create/update/retire functions; every detection and signal gated on barstate.isconfirmed; named alertcondition calls so webhooks receive a consistent payload. The Academy's Pine Script tutorials and the TradingView backtesting guide cover strategy conversion.
Using it with the other free indicators
The free tools layer on one chart: the Smart Money Concepts Engine for bias and the Confluence Score; Order Blocks with Volume, Fair Value Gaps + Inversion and Institutional Key Levels for the zone; Liquidity Sweeps, Sessionscope and Liquidation Magnet for the liquidity and the trigger; OTE + Silver Bullet for the time-qualified entry; the Institutional Volume Profile and Pressure Oscillator for whether volume agrees. The free-indicators hub lists every tool; the SMC guide is the method behind the layering.
Common mistakes with this indicator
- Trusting the developing bar — every event waits for the close.
- Trading every marker — the tool gives context and location; the entry needs structure confirmation and a stop beyond the level.
- Default lengths on the wrong timeframe — adjust the pivot inputs, as the settings table shows.
- Ignoring volume quality — indicative on CFD tick volume, real on exchanges and futures.
- Stacking ten random scripts — the free tools layer because they were built to.
Want the signal, not just the structure?
Zeno reads the same Smart Money structure across timeframes and prints the entry, stop, TP1 and TP2 on your chart — with a public record of 160 posted trades, 120 wins and 40 losses at the stated levels. QuantumBot executes it on Bybit, Binance, OKX, Bitget and Kraken.

Glossary for this indicator
Frequently asked questions
Does the Pressure Oscillator repaint?
No. Each bar's classification is fixed on its close; the rolling sums and the trigger EMA update as new bars arrive, which is normal oscillator behaviour, not repainting.
What is the noise gate?
A threshold, scaled from the rolling 30-bar standard deviation of log-returns, below which a bar's price move is treated as noise and receives no pressure attribution. It is what stops choppy bars from polluting the reading.
Why cap volume?
Because crypto volume in particular contains exchange-generated spikes, liquidation cascades and wash trades; the Participation Cap limits any bar to a multiple of the rolling average so one anomaly cannot dominate the oscillator.
How is it different from OBV?
OBV assigns every bar's full volume by close direction; this tool ignores bars that did not move meaningfully, caps outliers, normalises by participation and adds a trigger line and histogram.
Which timeframe is best?
4H and daily on crypto perpetuals, where institutional volume patterns are clearest; it works on any market and timeframe with real volume.
How does it relate to Zeno?
The Zeno Oscillator is the premium momentum layer; this free tool reads volume pressure and pairs with it — Zeno for timing, the pressure read for whether volume agrees.
What are the default settings?
Accumulation Window 130, Noise Gate Sensitivity 0.2, Participation Cap 2.5, Trigger Line Smoothing 5, Extra Smoothing off; histogram, pressure zones and crossover markers on.
Which timeframe is best?
4H and daily on crypto perpetuals, where institutional volume patterns are clearest and the participation cap does its best work; it runs on any market with real volume.
Is it a buy/sell signal indicator?
No. The zone gives bias, crossovers give timing, the histogram gives strength and divergence gives warnings; the location of the entry comes from structure tools.
Why does it disagree with OBV?
OBV counts every bar by close direction; this ignores bars that did not move meaningfully, caps outliers and normalises by participation — so it disagrees exactly where OBV is being fooled.
Does it work on forex?
With tick volume the readings are indicative; raise the sensitivity to 0.3 and treat the histogram as momentum rather than participation.
How does it relate to Zeno?
The Zeno Oscillator is the premium momentum and reversal layer inside the Zeno suite; this free tool reads volume pressure and pairs with it — Zeno for timing, the pressure read for whether volume agrees.
The other free Smart Money indicators
Built to layer on one chart: the engine for bias and the score, the dedicated tools for each element.
Add Institutional Pressure Oscillator to your chart
One click on TradingView, free on every plan, code you can read. Nothing repaints.