Money Flow in Trading: The Complete Guide

Money flow in trading combines price and volume to measure buying versus selling pressure: positive flow means capital is accumulating, negative means distributing. Main tools: the Money Flow Index (0–100, overbought above 80, oversold below 20), Chaikin Money Flow, On-Balance Volume and Accumulation/Distribution. Its most valuable signal is divergence, when price makes a new high but money flow does not.
What Is Money Flow in Trading?
Money flow measures the pressure of money moving into and out of an asset by combining price and volume into a single read of buying versus selling force. Where a plain price chart shows you where the market went, money flow tries to show you how much conviction was behind the move — whether real capital was accumulating (flowing in) or distributing (flowing out). It is the quantitative attempt to answer the question every trader actually cares about: is smart money buying or selling here?
The core idea is simple. A price rise on heavy volume represents strong positive money flow — buyers are committing capital. A price rise on thin volume is weak, suspicious money flow — the move lacks backing and may fail. By weighting each price move by the volume behind it, money-flow tools separate moves that matter from moves that are just noise. This makes money flow a natural companion to volume profile and VWAP — all three read the market through the lens of volume rather than price alone.
Money Flow vs Volume vs Price
To use money flow well, separate it from the two things it's built from. Price tells you the result — the agreed value right now. Volume tells you the participation — how many contracts changed hands, but not in which direction the pressure leaned. Money flow combines the two to infer direction of pressure: it assigns volume a positive or negative sign based on whether price was rising or falling (and often where it closed within its range), then sums that signed volume over time.
This is why money flow catches things price and volume miss on their own. Volume alone can't tell you whether a high-volume candle was aggressive buying or aggressive selling. Price alone can't tell you whether a move had real capital behind it. Money flow fuses them: a rising money-flow line while price rises confirms genuine accumulation; a falling money-flow line while price rises is a divergence — the rally is running on fumes, and that mismatch is one of the most valuable early warnings in technical analysis.
What are the main money flow indicators?
"Money flow" is a family of indicators, not a single tool. The ones you'll encounter most:
- Money Flow Index (MFI): often called "volume-weighted RSI." It's an oscillator bounded 0–100 that uses price and volume to flag overbought (typically >80) and oversold (typically <20) conditions. Because it includes volume, it can spot exhaustion the plain RSI-style oscillators miss.
- Chaikin Money Flow (CMF): sums money-flow volume over a lookback (commonly 20 or 21 periods) and oscillates around zero. Above zero signals net buying pressure; below zero, net selling. It emphasises where price closes within each bar's range.
- On-Balance Volume (OBV): a running cumulative total that adds the day's volume on up-closes and subtracts it on down-closes. It's the simplest money-flow concept and is read mostly for its trend and divergences rather than absolute value.
- Accumulation/Distribution (A/D): similar to OBV but weights each period's volume by where price closed in its range, giving a more granular accumulation read.
They differ in the maths, but all answer the same question — is signed, volume-weighted pressure positive or negative, and is it strengthening or weakening? Other variants exist too — such as Twiggs Money Flow, a refined take on Chaikin's formula. Learn the concept once and you can read any of them.
MFI vs CMF vs OBV vs A/D at a glance
| Indicator | Type | How to read it | Typical lookback | Built from |
|---|---|---|---|---|
| Money Flow Index (MFI) | Bounded oscillator, 0–100 | Above 80 overbought, below 20 oversold; divergence | 14 periods | Typical price times volume |
| Chaikin Money Flow (CMF) | Oscillator around zero | Above zero net buying, below zero net selling | 20 or 21 periods | Volume weighted by close within the bar's range |
| On-Balance Volume (OBV) | Cumulative running total | Trend and divergence, not absolute value | None, cumulative | Volume added on up closes, subtracted on down |
| Accumulation/Distribution (A/D) | Cumulative line | Trend and divergence, not absolute value | None, cumulative | Volume weighted by close within the bar's range |
◆All four measure signed, volume-weighted pressure; read each on its own terms.
How do you read money flow on a chart?
Money flow becomes intuitive when you see it live. The chart below shows Quantum Algo's Zeno | Tidal Force on Bitcoin, with a dedicated money-flow read in the dashboard and a flow oscillator in the lower panel. Notice the dashboard line: "Money Flow: Positive · sell armed." That single readout fuses two ideas — flow pressure is currently positive (capital leaning in), while the system has a short setup armed on the higher-level structure. The lower oscillator shades green when flow is building on the buy side and red when it's building on the sell side, so momentum shifts are visible at a glance rather than buried in a number.
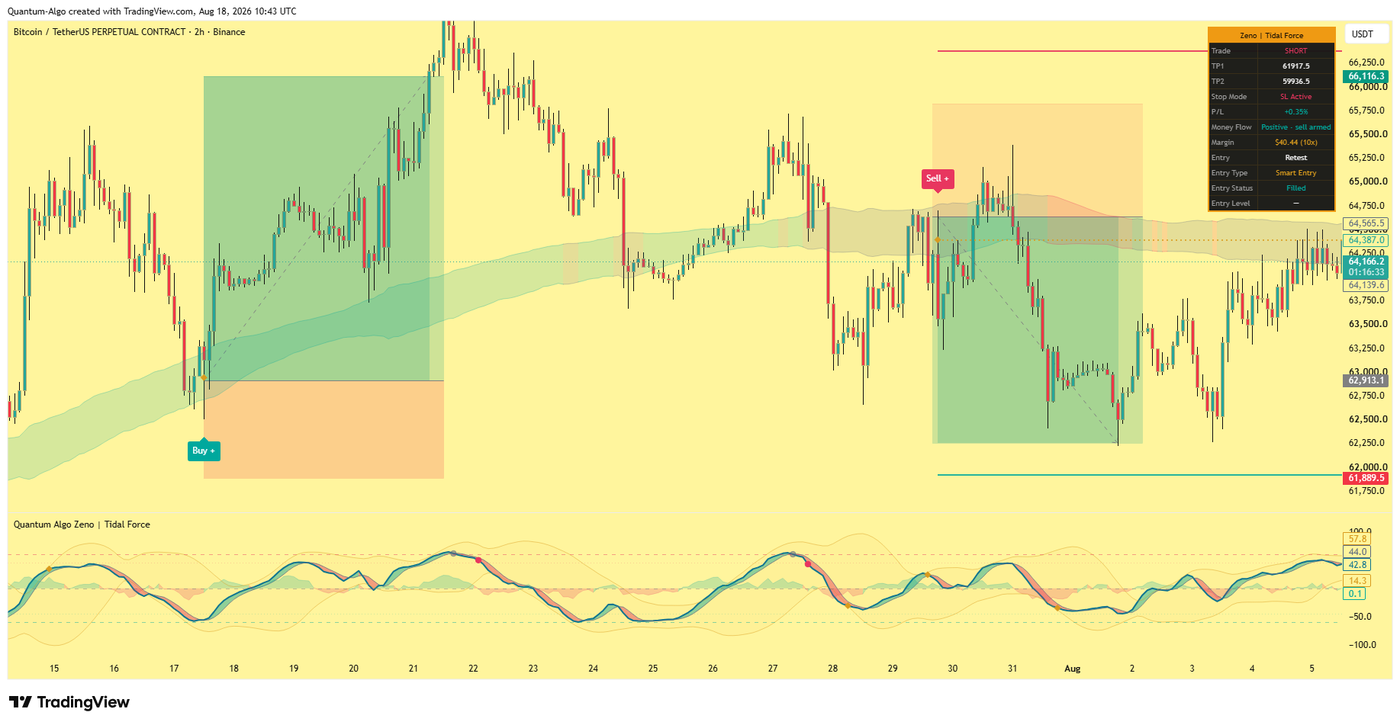
This is the practical value of a money-flow read: instead of guessing whether a move has conviction, you get a direct signed measure. When price and the flow read agree, you trade with confidence; when they diverge, you get cautious. Everything else in this guide is about turning that read into decisions.
How to Trade with Money Flow
Money flow is a confirmation-and-context tool, not a standalone entry trigger. Four high-value uses:
1. Confirm the trend. In an uptrend, you want positive and rising money flow — it says the move has real capital behind it. If price is grinding up but money flow is flat or falling, the trend is weak and vulnerable. Trade in the direction flow confirms.
2. Spot divergences (the big one). When price makes a new high but money flow makes a lower high, that's bearish divergence — buying pressure is fading even as price rises, often preceding a reversal. The reverse (price new low, flow higher low) is bullish divergence. Divergences are money flow's most powerful signal because they reveal weakness before price does.
3. Gauge overbought/oversold with conviction. Oscillator-style money flow (like MFI) flags exhaustion, but because it's volume-weighted, an overbought reading on heavy flow means something different from one on light flow. Use it to time exits and fade extremes — in context, never blindly.
4. Confirm breakouts. A breakout on strong positive money flow is far more likely to hold than one on weak flow. Flow is the tell that separates a real breakout from a liquidity grab that's about to reverse.
Why is money flow divergence the highest-value signal?
If you take one thing from this guide, make it divergence. Because money flow measures the capital behind a move rather than the move itself, it frequently weakens before price does. A market can print higher highs while the money funding those highs quietly dries up — and money-flow divergence is how you see it happening in real time, ahead of the crowd watching price alone.
Bearish divergence forms when price makes a higher high but the money-flow line makes a lower high: each new price peak is backed by less buying pressure than the last. It's a classic exhaustion signal near the top of a move. Bullish divergence is the mirror — price makes a lower low while money flow makes a higher low, showing selling pressure is drying up near a bottom. Neither is a standalone sell or buy button; both are warnings that raise the odds of a reversal and should be confirmed with structure.
The professional way to use divergence is as a filter on your existing setups. A short at resistance is far stronger when money flow is diverging bearishly beneath it. A long at support is far stronger with bullish flow divergence. Combined with a market structure shift, a money-flow divergence becomes a high-conviction reversal signal — the flow tells you the fuel is gone, and the structure shift tells you the turn has begun.

Automate your trades. Let Quantum Algo trade for you.
Every signal executed on your own account — 24/7, hands-off.
What are the most common money flow mistakes?
Trading flow as a signal by itself. Positive money flow is not a buy signal and negative flow is not a sell signal. Flow is context — it confirms or warns. Pair it with price structure and a trigger.
Ignoring the trend. Overbought money flow in a strong uptrend can stay overbought for a long time. Fading flow extremes against a powerful trend is a common way to lose. Respect direction first.
Forcing divergences. Not every wiggle is a divergence, and divergences can persist far longer than expected before price reacts. Wait for confirmation; a divergence is a reason to watch, not to fire immediately.
Using unreliable volume. Money flow is only as good as the volume feeding it. On instruments with fragmented or untrustworthy volume (some spot forex, thin altcoins), the read degrades. It's cleanest on futures and liquid crypto where volume is real.
Mixing up the indicators. MFI, CMF, OBV, and A/D behave differently — bounded vs unbounded, cumulative vs oscillating. Know which one you're reading and interpret it on its own terms rather than applying RSI rules to all of them.
Which markets and timeframes suit money flow best?
The money-flow concept is universal, but its reliability depends on the quality of the volume behind it. It shines on futures (centralised, honest volume), liquid crypto perpetuals, and large-cap equities. It's weaker on decentralised spot forex, where there's no single consolidated volume figure, and on thin instruments where a few trades distort the read. Match the tool to markets where volume means something.
Across timeframes, money flow scales but changes character. On lower timeframes it's noisier and better for timing entries and short-term divergences; on higher timeframes it's smoother and better for confirming the dominant trend and spotting major turning points. A powerful workflow is multi-timeframe: use higher-timeframe money flow to establish whether capital is broadly accumulating or distributing (your bias), then drop down to find entries where lower-timeframe flow aligns. That mirrors the top-down bias approach used across Smart Money Concepts — direction from above, timing from below — and keeps you trading with the flow of real capital rather than against it.
A Worked Example: Money Flow Divergence at a Top
Picture Bitcoin grinding into a strong uptrend. Price pushes to a new high, pulls back, then pushes to a second, higher high a few days later — on the chart, textbook bullish continuation. But look at the money-flow line beneath it. On the first high the flow oscillator peaked strongly into positive territory; on the second, higher price high, the flow line made a lower peak. Price went up; the capital behind it went down. That is bearish money-flow divergence, and it is the market quietly telling you the rally is running on less and less fuel.
Here is how a disciplined trader uses it. The divergence alone is not a short — trends can diverge for a while before they turn. So you wait. Price stalls, then breaks the most recent swing low that had been holding — a structure shift to the downside. Now you have both halves: money flow saying the fuel is gone, and structure confirming the turn has started. That combination is a high-conviction short, with risk defined above the divergent high and a target at the nearest high-volume node below where price is likely to find support.
Notice the sequence: flow gave the early warning, structure gave the trigger, and volume levels gave the target. That is money flow used correctly — not as a lone signal, but as the first domino in a confluence that lines up flow, structure, and levels into one decision.
What should you combine money flow with?
Money flow earns its keep in confluence. On its own it tells you whether capital is leaning in or out; it doesn't tell you the exact price to act or which way structure is pointing. Stack it with the tools that supply those, and each input covers the others' blind spots.
The most powerful pairings are simple. Money flow plus market structure: a structure shift confirmed by flow in the same direction is far stronger than either alone. Money flow plus volume profile: when a value-area edge rejection lines up with a flow divergence, you have a level and a reason. Money flow plus Smart Money Concepts: an order block tap in a discount that coincides with bullish flow divergence is a textbook high-probability long. And across all of them, a higher-timeframe bias keeps you trading flow signals in the direction of the dominant trend rather than against it.
The throughline is that money flow answers "how much conviction?" while structure answers "which way?" and levels answer "where?" No single tool answers all three, which is exactly why the best traders read them together — and why an integrated system that shows flow, structure, and levels in one view removes the guesswork of stitching them together manually. Whatever tools you use, anchor every flow-based decision to disciplined risk management, because conviction is a probability, never a certainty.
Reading Money Flow with Quantum Algo
Most money-flow indicators hand you a raw oscillator and leave interpretation to you. Quantum Algo's Zeno | Tidal Force integrates a money-flow read directly into a complete signal system: the dashboard states flow pressure in plain language (the "Money Flow: Positive · sell armed" readout you saw above), while the lower Tidal Force oscillator shades buy-side and sell-side flow so momentum shifts and divergences are visible at a glance. Instead of eyeballing whether a move has conviction, you get flow fused with structure, entry logic, and targets in one view.
That integration is the point. Money flow is at its best as one input in a confluence — combined with market structure, volume profile, and disciplined risk management. Reading capital flow alongside where price actually sits structurally is how you tell a move with fuel from a move about to stall — and act before price makes it obvious to everyone else. It's all backed by a verified, public track record so you can judge the approach on results, not claims.
See the toolkit → Verify the track recordFrequently Asked Questions
Money flow measures the pressure of money moving into and out of an asset by combining price and volume into a single read of buying versus selling force. Positive money flow means capital is accumulating (buying pressure); negative money flow means it's distributing (selling pressure). It answers whether a price move had real conviction behind it or was just noise, making it a key volume-based tool alongside VWAP and volume profile.
Volume tells you how many contracts or shares changed hands, but not in which direction the pressure leaned. Money flow adds direction: it signs the volume positive or negative based on whether price was rising or falling (and where it closed within its range), then sums it. So volume is participation; money flow is signed, directional participation — buying pressure versus selling pressure.
The Money Flow Index (MFI) is an oscillator bounded 0–100 that uses both price and volume — often described as a volume-weighted RSI. Readings above roughly 80 suggest overbought conditions and below roughly 20 suggest oversold. Because it incorporates volume, MFI can flag exhaustion and divergences that a price-only oscillator like RSI can miss.
Chaikin Money Flow (CMF) sums money-flow volume over a lookback period (commonly 20 or 21) and oscillates around a zero line. Readings above zero indicate net buying pressure; below zero indicates net selling pressure. It emphasises where price closes within each bar's range, so strong closes near the high add positive flow and closes near the low add negative flow.
Use it to confirm and contextualise, not as a standalone trigger. Confirm trends (positive, rising flow supports an uptrend), spot divergences (price makes a new high but flow doesn't — a reversal warning), gauge overbought/oversold with volume weighting, and confirm breakouts (strong flow makes a breakout more likely to hold). Always pair money flow with price structure and risk management.
Money flow divergence occurs when price and the money-flow line disagree. Bearish divergence is price making a higher high while flow makes a lower high — buying pressure is fading even as price rises, often before a reversal. Bullish divergence is price making a lower low while flow makes a higher low — selling pressure is drying up. Divergences are money flow's most valuable signal because they reveal weakness before price does.
Money flow is built from price and volume that have already traded, so technically it lags. However, because it measures the capital behind a move, it often weakens before price does — which is why money-flow divergences can act as an early warning of reversals. Used for divergence and confirmation, it can be more forward-looking in practice than a pure price oscillator.
They're all money-flow indicators with different maths. MFI is a bounded 0–100 oscillator (volume-weighted RSI). CMF oscillates around zero over a lookback. OBV is a simple cumulative running total that adds volume on up-closes and subtracts on down-closes. A/D is similar to OBV but weights volume by where price closed in its range. All measure signed, volume-weighted pressure — interpret each on its own terms.
It works best where volume is real and centralised — futures, liquid crypto perpetuals, and large-cap stocks. It's less reliable on decentralised spot forex, which has no single consolidated volume figure, and on thin instruments where a few trades distort the read. Since money flow is only as good as the volume feeding it, apply it where volume is trustworthy.
Not on its own. Positive money flow is not an automatic buy and negative flow is not an automatic sell — flow is context that confirms or warns. Overbought flow can persist in strong trends, and divergences can last longer than expected. The reliable approach is to combine money flow with price structure, a market-structure shift or level, and risk management, using flow to raise or lower conviction.
Quantum Algo's Zeno | Tidal Force integrates a money-flow read into a full signal system. Its dashboard states flow pressure in plain language (for example, 'Money Flow: Positive · sell armed'), and its lower Tidal Force oscillator shades buy-side and sell-side flow so momentum shifts and divergences are visible at a glance. It fuses flow with market structure, entry logic, and targets, backed by a verified public track record.
References & Related Guides
More in this topic
- ADX Indicator: Complete Trading Guide
- AlphaTrend Indicator: Complete Trading Guide
- ATR (Average True Range): Complete Trading Guide
- Awesome Oscillator: Complete Indicator Guide
- What Are the Best Volume Indicators?
- Bollinger Bands — Complete Trading Indicator Guide
- CCI Indicator: Complete Guide
- Chandelier Exit: Complete Trading Guide
- Donchian Channels: Complete Indicator Guide
- Fibonacci Bollinger Bands: Complete Trading Guide
- Fibonacci Retracement — Complete Trading Guide
- Hull Moving Average (HMA): Complete Trading Guide
- Gaussian Channel Indicator Guide
- Best Buy/Sell Indicator Guide
Core reading
- BOS & CHoCH: Complete Market Structure Guide
- Order Blocks Trading: Complete Guide
- Best TradingView Indicators — Complete Guide
- Risk Management in Trading — Complete Guide
- Candlestick Patterns Guide — Engulfing, Pinbar & More
- All Premium Guides
- Quantum Algo on TradingView
- Public Track Record
Authoritative sources
For a focused comparison, read the volume-flow context for Klinger before applying the setup.