Twiggs Money Flow: The Complete Volume Indicator Guide
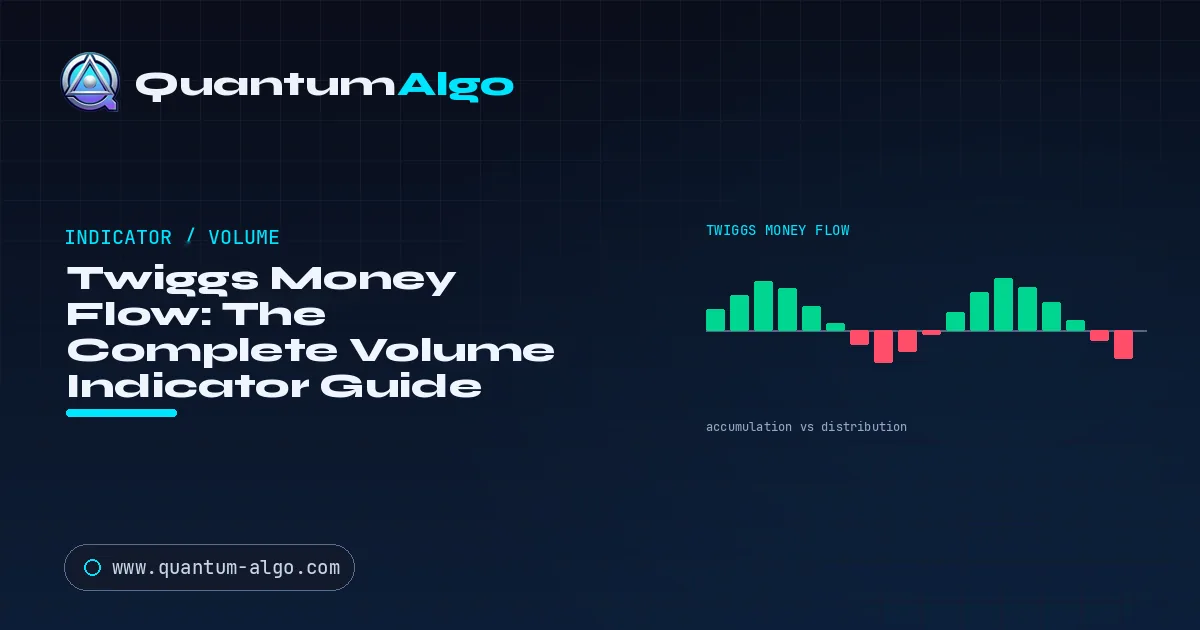
Twiggs Money Flow (TMF) is a volume indicator developed by Colin Twiggs that measures whether money is flowing into or out of an asset, weighting each bar by where it closed in its range and by volume. Above the zero line is accumulation (buying pressure), below is distribution. It improves on Chaikin Money Flow with true range and exponential smoothing.
Twiggs Money Flow (TMF) is a volume-based indicator that tries to answer one question: is money quietly flowing into an asset, or out of it? Developed by Colin Twiggs as an improvement on the older Chaikin Money Flow, it combines price and volume to gauge accumulation (buying pressure) versus distribution (selling pressure), while smoothing out the erratic swings and gap-related distortions that plague simpler money-flow tools. For traders who want to see whether a price move is backed by real participation, TMF is a cleaner lens than most.
Related: money flow.
This guide explains what Twiggs Money Flow is, how it improves on Chaikin Money Flow, how to read its signals and divergences, where it helps and where it misleads, and how to use it as confirmation rather than a standalone trigger. It is a practical breakdown of an underrated volume indicator that rewards traders who understand what it is actually measuring.

Automate your trades. Let Quantum Algo trade for you.
Every signal executed on your own account — 24/7, hands-off.
What does Twiggs Money Flow measure?
Twiggs Money Flow is an oscillator that combines price action and volume to estimate the balance of buying and selling pressure. The logic rests on a simple premise: volume reveals conviction. When price rises on strong volume and closes near the high of its range, that is a sign of genuine accumulation — buyers are in control. When price falls on strong volume and closes near the low, that is distribution — sellers dominate. TMF aggregates this bar-by-bar reading into a smoothed line that oscillates above and below a zero line, giving a running read of whether money is flowing in or out.
Above zero, buying pressure prevails and the trend has volume support; below zero, selling pressure prevails. The distance from zero indicates the strength of that pressure. Crucially, TMF weights each bar's contribution by where price closed within its range and by that bar's volume, so a strong close on heavy volume moves the line far more than a weak close on thin volume — which is exactly how you would intuitively judge conviction.
Accumulation above zero, distribution below
The line reads net pressure: green above zero is buying, red below is selling.
How does Twiggs Money Flow improve on Chaikin Money Flow?
Twiggs Money Flow was created specifically to fix known weaknesses in Chaikin Money Flow (CMF), its closest relative. Both indicators share the same goal, but CMF has two well-documented problems that Twiggs set out to solve. Understanding these fixes explains why TMF is often the more reliable of the two.
Why gaps break Chaikin but not Twiggs
CMF uses only the bar's own range; TMF uses true range, so a gap-and-close-strong reads as real accumulation.
The first problem is gaps. CMF calculates each bar's money-flow contribution using only that bar's own high-low range, so when price gaps between bars — opening far from the previous close — the true range of movement is ignored and the reading can be distorted. TMF addresses this by using a true-range-style calculation that accounts for gaps, so a bar that gaps up and closes strong is read as the accumulation it really is. The second problem is erratic smoothing: CMF uses a simple sum over a fixed window, which can cause abrupt jumps as old bars drop out. TMF uses exponential smoothing, which weights recent data more and produces a steadier, less jumpy line. Together these changes make TMF smoother and more faithful to actual money flow, especially in markets prone to gaps.
What do Twiggs Money Flow readings mean?
The indicator offers several readable signals, and as always, combining them beats trading any one in isolation.
Zero-line crosses
TMF crossing above zero signals a shift to net buying pressure; crossing below signals net selling. These crosses mark changes in who controls the money flow.
Above / below zero
Sustained readings above zero confirm a move has genuine accumulation behind it; sustained readings below confirm distribution. Use this to validate trends.
Divergence
When price makes a new high but TMF makes a lower high — a divergence concept shared with RSI — buying pressure is fading despite the price rise — a warning the move lacks support. The reverse warns of exhausted selling.
Strength of reading
How far TMF sits from zero shows how strong the pressure is. A move that pushes TMF strongly positive has more conviction than one that barely lifts it.
How does divergence reveal a weakening move?
Divergence is where Twiggs Money Flow earns its keep, because it surfaces a disagreement between price and participation that often precedes a turn. The principle is straightforward: price and money flow should normally move together. When they diverge, the price move is running on fumes.
Bearish divergence: price up, money flow down
A higher price high with a lower TMF high warns that buying conviction is fading.
In the classic bearish case shown above, price grinds to a new high but TMF makes a lower high — the rally is drawing less and less buying volume, a sign the move is losing conviction and may be near exhaustion. Bullish divergence is the mirror image: price makes a new low while TMF makes a higher low, hinting that selling pressure is drying up and a bottom may be forming. Divergences are not precise timing signals on their own, but as an early warning combined with price structure, they are among the most useful things a volume indicator can tell you.
How does Twiggs Money Flow compare with other volume indicators?
TMF is one of several volume tools, and knowing how it differs helps you pick the right one — or combine them intelligently.
| Indicator | What it shows | Key strength | Watch-out |
|---|---|---|---|
| Twiggs Money Flow | Accumulation vs distribution | Gap-resistant, smoothed | Needs reliable volume |
| Chaikin Money Flow | Accumulation vs distribution | Widely known | Gap distortion, jumpy |
| OBV | Cumulative volume flow | Simple, clear trend | No range weighting |
| Money Flow Index | Volume-weighted momentum | Overbought/oversold | Behaves like a bounded RSI |
Each answers a slightly different question. TMF and CMF focus on the balance of buying versus selling pressure, OBV tracks the running total of volume flow, and the Money Flow Index frames volume as a bounded momentum oscillator. TMF's edge over its closest peer, CMF, is its robustness to gaps and its smoother line — which is why many traders who once used CMF switched to it.
Which lookback period should you use?
The main parameter of Twiggs Money Flow is its lookback period, which controls how much history the smoothing considers. A shorter period makes TMF more responsive and quicker to flip, better for short-term trading but noisier; a longer period makes it smoother and slower, better for confirming longer trends. A common default sits in the low-twenties of bars, but as with any indicator the right value depends on your market and timeframe.
Shorter period
More responsive, flips sooner, noisier — suits lower timeframes and shorter-term trades where early reads matter.
Longer period
Smoother and steadier, slower to flip — suits higher timeframes and confirming the volume support behind longer trends.
Match the market
Use clean-volume markets for the most reliable readings, and tune the period to the trend length you actually trade.
When does Twiggs Money Flow help, and when does it mislead?
Twiggs Money Flow is a strong confirmation tool, but it has real limitations that dictate how it should be used. Its biggest dependency is reliable volume data. In markets where reported volume is fragmented or unreliable — some spot crypto and decentralised venues, for instance — the indicator's foundation is shaky, and its readings should be trusted less. On centralised markets with clean volume, such as regulated futures and equities, it is far more dependable.
It also shares the general weaknesses of oscillators: it can stay positive or negative for extended periods, so a zero-line cross is not a precise entry, and in choppy conditions it can flip back and forth. And like any indicator it looks at what has already happened — strong money flow confirms a move is supported, but it does not predict how long that support will last. Used as confirmation and divergence within a broader plan, TMF is genuinely valuable; used as a standalone trigger, it disappoints like every other single indicator.
What should you combine Twiggs Money Flow with?
Because its strength is confirming participation and flagging divergence, TMF pairs naturally with tools that provide the trade thesis it then validates. A trend or structure read gives you the directional context; TMF tells you whether volume supports that direction. A support/resistance or market-structure level gives you a location; TMF divergence at that level strengthens the case for a reaction. And a separate entry signal gives you timing that TMF confirms has real flow behind it.
TMF as a confirmation layer
Let price and structure propose the trade; let money flow confirm real participation.
The most effective workflow treats TMF as a filter and a warning system layered onto a price-based method: take signals in the direction TMF confirms, be cautious when TMF diverges from price, and lean on its zero-line context to judge whether a trend has genuine volume support. In that role — validating conviction and warning of hidden weakness — it adds a dimension that price-only analysis simply cannot see, which is exactly what a good volume indicator should do.
• Flow meets structure — Volume context tied to market structure, liquidity and order blocks
• Located conviction — See not just that money is moving, but where it structurally matters
• Accountable performance — A verified public track record behind every signal
◆ Confirm moves with real structure
Quantum Algo combines volume and flow context with Smart Money Concepts — market structure, liquidity and order blocks — so you can see not just that money is moving, but where the structure says it matters, all backed by a verified public track record.
See the indicator → Verify the track recordFrequently Asked Questions
Twiggs Money Flow (TMF) is a volume-based oscillator that measures whether money is flowing into an asset (accumulation) or out of it (distribution). Developed by Colin Twiggs as an improvement on Chaikin Money Flow, it combines price and volume — reading whether price closes near the high or low of its range on what volume — into a smoothed line that oscillates above and below a zero line. Above zero means net buying pressure; below means net selling pressure.
Twiggs Money Flow was developed by Colin Twiggs, a technical analyst, as a refinement of Marc Chaikin's Chaikin Money Flow indicator. Twiggs designed it specifically to fix two known weaknesses in the original: distortion from price gaps and erratic, jumpy readings from simple windowed summation. The result is a smoother, more gap-resistant money-flow gauge.
It reads each bar's contribution to buying or selling pressure based on where price closes within its range and how much volume traded, then aggregates these into a smoothed line around a zero line. A strong close on heavy volume moves the line far more than a weak close on thin volume. Above zero indicates net accumulation and volume support for the trend; below zero indicates net distribution. The distance from zero reflects the strength of the pressure.
Twiggs Money Flow fixes two flaws in Chaikin Money Flow. First, CMF uses only each bar's own high-low range, so price gaps distort its readings; TMF uses a true-range-style calculation that accounts for gaps. Second, CMF sums over a fixed window, which causes abrupt jumps as old bars drop out; TMF uses exponential smoothing, weighting recent data more for a steadier line. Together these make TMF smoother and more faithful to actual money flow, especially in gap-prone markets.
There are several readable signals. A cross above zero signals a shift to net buying pressure; a cross below signals net selling. Sustained readings above or below zero confirm whether a move has real accumulation or distribution behind it. Divergence — price making a new high while TMF makes a lower high, or vice versa — warns that a move is losing volume support. And how far TMF sits from zero shows the strength of the pressure. Its best use is confirmation and divergence rather than a standalone trigger.
Divergence occurs when price and Twiggs Money Flow disagree. In bearish divergence, price makes a higher high but TMF makes a lower high, meaning the rally is drawing less buying volume and may be near exhaustion. In bullish divergence, price makes a new low while TMF makes a higher low, hinting that selling pressure is drying up and a bottom may be forming. Divergences are early warnings rather than precise timing signals, and they are strongest when combined with price structure.
It can be, but with a caveat: TMF depends entirely on reliable volume data. On centralised crypto exchanges with clean, consistent volume it works reasonably well, but on fragmented or decentralised venues where reported volume is unreliable, its foundation is shaky and its readings deserve less weight. The indicator is generally most dependable on regulated markets like futures and equities where volume reporting is standardised.
The main parameter is the lookback period. A shorter period makes TMF more responsive and quicker to flip — better for short-term trading but noisier — while a longer period makes it smoother and slower, better for confirming longer trends. A common default sits in the low-twenties of bars, but the right value depends on your market and timeframe. Match a shorter period to lower timeframes and shorter trades, and a longer period to higher timeframes and longer trends.
It is not recommended as a standalone trigger. TMF can stay positive or negative for extended periods, so a zero-line cross is not a precise entry, and in choppy conditions it can flip repeatedly. Its strength is confirmation and divergence — validating whether a price move has real volume behind it and warning when it does not. Used within a broader plan alongside trend, structure, and a separate entry method, it adds a dimension price alone cannot show; used alone, it disappoints like any single indicator.
Its main limitation is its dependence on reliable volume data — in markets with fragmented or unreliable reported volume, its readings are shaky. It also shares general oscillator weaknesses: it can remain on one side of zero for long stretches, so crosses are not precise entries, and it can whipsaw in choppy conditions. And it is descriptive, not predictive — strong money flow confirms a move is supported but does not tell you how long that support will last. It is best used as confirmation and divergence, not prediction.
They answer different questions. On-Balance Volume (OBV) tracks a running cumulative total of volume flow and is valued for showing a clear trend in participation, but it does not weight bars by where price closed in its range. Twiggs Money Flow weights each bar by close location and volume and focuses on the balance of accumulation versus distribution, with gap handling and smoothing. Neither is strictly better — OBV is simpler for trend, TMF is more nuanced for pressure and divergence — and many traders use them together.
A money-flow read is most powerful when tied to where structure says it matters. Quantum Algo combines volume and flow context with Smart Money Concepts — market structure, liquidity, and order blocks — so you see not just that money is moving into or out of an asset, but whether it is happening at a level that structurally matters. This turns a raw accumulation/distribution signal into a located, actionable read, backed by a verified public track record.
References & Related Guides
More in this topic
- What Are the Best Volume Indicators?
- VWAP Trading Guide
- RSI Indicator Guide
- MACD Indicator Guide
- Bollinger Bands Guide
- Squeeze Momentum Indicator (TTM Squeeze): Complete Guide
- Best TradingView Indicators
- Non-Repaint Indicators: The Complete Guide to Reliable Signals
- Best Buy/Sell Indicator: How to Choose One That Actually Works
- Supply and Demand Trading Guide — Zones, Flips & Strategies
- Trend Trading Strategy: The Complete Guide
- Mean Reversion Trading Guide
- Center of Gravity Indicator Guide
- What Are the Best Indicators for Futures Trading?
Core reading
- What Are the Best Volume Indicators?
- Best TradingView Indicators
- Risk Management in Trading — The Complete Survival Guide
- All Premium Guides
- Public Track Record
- Quantum Algo on TradingView