Open Interest Explained: Reading Commitment, Not Just Activity
| What it is | Total open derivative contracts not yet closed |
| Not volume | OI counts open positions; volume counts trades |
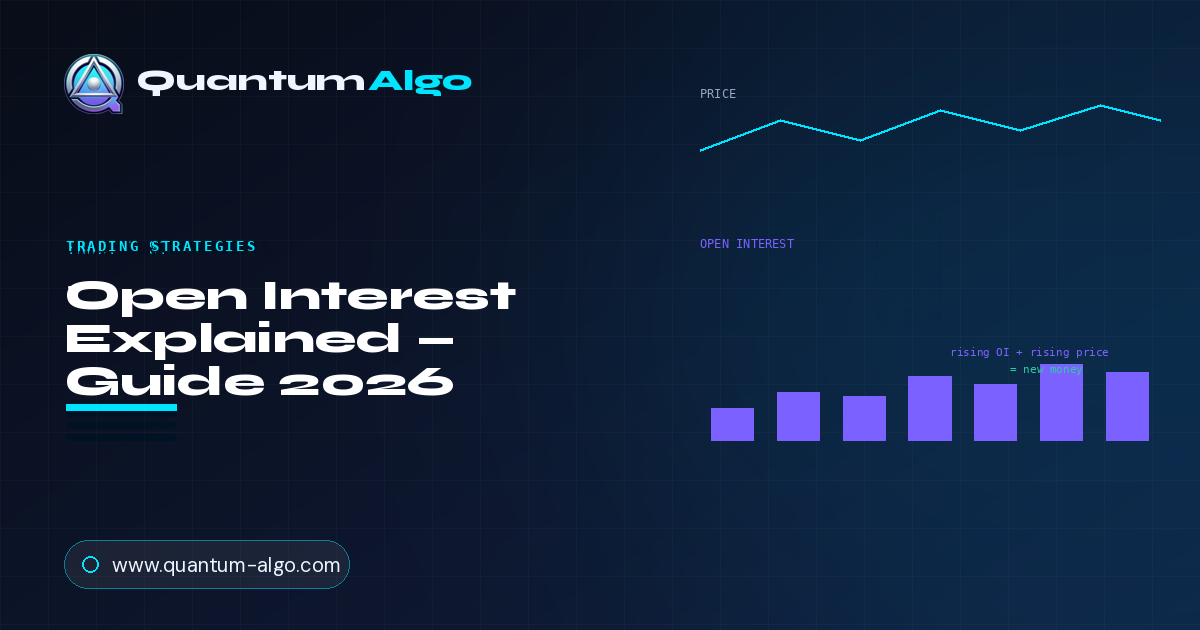
| Rising OI | New money entering — fresh positions opened |
| Falling OI | Positions closing — money leaving |
| The key read | OI direction + price direction together |
| Best used with | Funding, liquidation, price structure |
1. What Is Open Interest?
Open interest is the total number of derivative contracts — futures or perpetual swaps — that are currently open and have not yet been closed or settled. It is a running count of live positions in the market. If a thousand contracts are open and none are closed, open interest is a thousand. Every open long is matched by an open short, so open interest measures the size of the outstanding bet, not its direction.
The concept trips people up because it is so easily confused with volume, and the two answer completely different questions. Volume counts how many contracts traded in a period — every buy and sell, whether opening or closing a position. Open interest counts how many contracts remain open at the end of it. You can have enormous volume with flat open interest (traders opening and closing all day) or modest volume that steadily builds open interest (new positions accumulating). Volume is activity; open interest is commitment.
Why does commitment matter? Because open interest tells you whether a price move is backed by new money or is just existing traders shuffling out. A rally on rising open interest means fresh positions are being opened into the move — new conviction is entering. The same rally on falling open interest means the move is being driven by traders closing out, not new buyers stepping in — a weaker, less sustainable foundation. Open interest is the difference between a move that is being funded and one that is merely being unwound.
Open interest is the count of live derivative positions. Volume is activity; open interest is commitment. Read alongside price, it tells you whether a move is backed by new money entering or old money leaving.
2. Open Interest vs Volume
Because this distinction is the foundation of everything else, it is worth making crystal clear with a simple example. Suppose one bar shows heavy volume. That alone tells you a lot of trading happened — but nothing about what it means. Now layer in open interest. If open interest rose on that bar, the heavy volume was traders opening new positions: new money committing. If open interest fell, the same heavy volume was traders closing positions: money leaving. Identical volume, opposite meaning — and only open interest tells you which.
Volume = activity
How many contracts changed hands in the period, opening and closing alike. High volume means a busy market, but says nothing on its own about whether positions are being built or unwound.
Open interest = commitment
How many positions remain open at the end of the period. Rising OI means the net position base is growing; falling OI means it is shrinking. This is the fresh-money-vs-exit signal.
They move independently
You can have high volume with flat OI (churn), or low volume with steadily rising OI (quiet accumulation). Reading them together is far more informative than either alone.
Both are per-contract
Open interest applies to derivatives — futures and perpetuals — where a contract is opened and later closed. Spot markets have volume but no open interest, because there is no open contract to count.
3. The Four Combinations of Price and Open Interest
The heart of open interest analysis is a simple two-by-two: price can be rising or falling, and open interest can be rising or falling. Each of the four combinations tells a distinct story about who is in control and how healthy the move is. Memorise this grid and you have the core of the entire tool.
| Price | Open Interest | Interpretation |
|---|---|---|
| Rising | Rising | Strong uptrend — new longs entering, fresh money confirms the move |
| Rising | Falling | Weak uptrend — short covering, not new buying; move may be running out |
| Falling | Rising | Strong downtrend — new shorts entering, fresh money confirms the decline |
| Falling | Falling | Weak downtrend — long liquidation, not new selling; decline may be exhausting |
The logic is consistent throughout: rising open interest confirms the current price direction because it means new positions are being opened in that direction, while falling open interest warns that the move is being driven by exits rather than fresh conviction. A trend backed by rising OI has new fuel; a trend on falling OI is coasting on the momentum of people leaving, and is more prone to stalling or reversing.
Rising price + rising OI
The healthiest bullish signal. New longs are being opened into the rally — genuine fresh demand. The trend has real conviction behind it and is more likely to continue.
Rising price + falling OI
A caution flag on an up-move. The rally is being fed by shorts covering (closing), not new buyers. When the short covering finishes, the fuel is gone — the move can stall.
Falling price + rising OI
The healthiest bearish signal. New shorts are being opened into the decline — genuine fresh supply. The downtrend has conviction and is more likely to continue.
Falling price + falling OI
A caution flag on a down-move. The decline is driven by longs closing (liquidating), not new sellers. When the liquidation finishes, the selling pressure can dry up.
New positions in the direction of the move (rising OI) confirm the trend has fresh money behind it. A move on falling OI is fed by exits — short covering or liquidation — and is more prone to stalling once those exits are done.
4. Open Interest, Funding and Liquidation: The Derivatives Cluster
Open interest does not live in isolation. On crypto perpetual futures especially, it is one of three tightly linked derivatives signals — alongside the funding rate and liquidation — and reading them together gives a far richer picture of positioning than any one alone.
The links are intuitive once you see them. Rising open interest means new leveraged positions are being opened — which is exactly the fuel that later becomes liquidation pools when those positions are forced out. A sharp spike in open interest is a build-up of fresh leverage that a liquidation map will show as new clusters. Meanwhile, the funding rate tells you which side that new open interest is leaning: heavily positive funding with rising OI means the new positions are predominantly crowded longs — over-eager, over-leveraged, and vulnerable to exactly the downside liquidation cascade the liquidation map is warning about.
OI is the leverage build-up
Rising open interest on perps is fresh leveraged positioning. It is the raw material that funding skews and liquidation clusters are built from — the "how much new leverage" number.
Funding shows the lean
Positive funding with rising OI = crowded new longs; negative funding with rising OI = crowded new shorts. Funding tells you which side the new open interest is stacked on.
Liquidation is the payoff
Today's rising OI is tomorrow's liquidation fuel. A big OI build-up on one side sets up the pools that a liquidation cascade later purges — the positions have to be closed somewhere.
Read the three together
Rising OI + extreme funding + a crowded liquidation map on one side is a classic over-leveraged setup, primed for a squeeze in the opposite direction. Any one signal is a hint; all three aligning is a warning.
This is why derivatives traders watch open interest so closely: it is the leading edge of the leverage cycle. New leverage shows up first as rising open interest, then reveals its bias through funding, and finally resolves — often violently — through liquidation. Catch the build-up early in the open interest, and the later funding extremes and liquidation cascades are far less surprising.

Automate your trades. Let Quantum Algo trade for you.
Every signal executed on your own account — 24/7, hands-off.
5. Reading Open Interest in Practice
The practical skill is pairing the open interest read with the price read and asking whether they tell a consistent story. A trend you want to trade is far more trustworthy when open interest confirms it, and far more suspect when open interest is quietly draining away beneath a move that looks strong on price alone.
Read the open interest signal
Four snapshots pairing a price move with an open interest change. Click the one that shows the strongest, most sustainable uptrend — the healthiest bullish combination.
The game rewards the combination that too many traders ignore: not just "price is going up," but "price is going up and new money is entering." A rally on rising open interest is a different animal from a rally on falling open interest, even when the price chart looks identical. Training yourself to check the open interest before trusting a trend is the whole practical value of the tool.
Confirm trends
Before trusting a breakout or trend, check that open interest is rising with it. New money entering in the trend's direction is the confirmation that the move has real backing.
Spot exhaustion
A strong price move on falling open interest is a warning: the move is being fed by exits, not new conviction. When the exits finish, the fuel is gone.
Watch the extremes
A rapid, extreme spike in open interest signals a crowded, over-leveraged market — often a setup for a violent squeeze once the positioning unwinds. Extreme OI is a caution, not a green light.
Always pair with price
Open interest alone has no direction — it counts positions, not sides. It only becomes a signal when read together with the price move it accompanies.
6. Open Interest in Your Toolkit
Open interest data is widely available — most derivatives exchanges publish it, and charting platforms plot it as a line or histogram beneath price, often aggregated across exchanges for a fuller picture. A few practical points make it far more useful than a glance at the raw number.
First, prefer aggregated open interest where you can get it. A single exchange's OI can be distorted by that venue's own flows; open interest summed across the major exchanges gives a truer read of market-wide positioning. Second, always read open interest as a change relative to price, never as an absolute level — "open interest is 5 billion" means nothing on its own; "open interest rose 12% while price broke out" means a great deal. Third, remember open interest is a derivatives-only concept: it is most powerful on futures and perpetual swaps, and simply does not exist on spot markets, where there is no open contract to count.
Use aggregated OI
Sum open interest across major exchanges for a market-wide read. Single-venue OI can mislead when one exchange's flows dominate; aggregated data reflects true positioning.
Read the change, not the level
The absolute OI number is meaningless in isolation. What matters is the direction and rate of change relative to the price move it accompanies.
Derivatives only
Open interest applies to futures and perpetuals. Spot markets have volume but no open interest — there is no open position to remain outstanding.
Combine, don't isolate
Open interest is a confirmation layer, strongest alongside price structure, funding and liquidation. On its own it has no direction; in context it sharpens every read.
Because open interest is fundamentally about leverage and positioning, it belongs in the same toolkit as the other derivatives signals. It is the leading number in the leverage cycle that funding and liquidation complete, and it pairs naturally with order-flow tools like cumulative volume delta that read the aggression behind the positioning open interest counts.
Read as a change relative to price, aggregated across exchanges, open interest tells you whether a move is backed by new money. It is the first number in the leverage cycle — the build-up that funding and liquidation later resolve.
7. Test Your Knowledge
Seven questions on open interest, the four combinations, and the derivatives cluster.
8. Open Interest Within a Full Trading Framework
Open interest answers one question — is this move backed by new money? — and that answer is most valuable layered on top of a structural read. It confirms or contradicts a thesis you already formed from price; it does not generate trades on its own.
The connections are direct. A break of structure backed by rising open interest is far more trustworthy than one on draining OI. A rally into a premium zone on falling open interest hints the move is exhausting right where you would look to sell. And a rapid open-interest spike into an over-leveraged extreme often precedes exactly the kind of liquidation cascade that resets the whole positioning picture.
• Buy/sell signals with built-in SL and TP — structural entries, stronger when OI confirms new money
• Break of structure mapping — the move OI either confirms or contradicts
• Liquidity sweep detection — where over-leveraged OI gets purged
• Multi-timeframe confluence scoring — so a trend confirmed by OI across timeframes scores higher
• ATR-based risk management — sizing anchored to volatility, not to leverage extremes
The habit to build: use structure to find the setup, use open interest to judge whether new money is backing the move, and be extra cautious when a strong-looking trend is quietly bleeding open interest. New money confirms; draining money warns.
Frequently Asked Questions
Open interest is the total number of derivative contracts - futures or perpetual swaps - that are currently open and have not yet been closed or settled. It is a running count of live positions in the market. Every open long is matched by an open short, so open interest measures the size of the outstanding position base, not its direction. Read alongside price, it reveals whether a move is backed by new money entering the market or existing traders closing out.
Volume counts how many contracts traded in a period - every buy and sell, whether opening or closing a position. Open interest counts how many contracts remain open at the end of it. You can have huge volume with flat open interest (traders opening and closing all day) or modest volume that steadily builds open interest (new positions accumulating). Volume is activity; open interest is commitment. The same heavy volume means opposite things depending on whether OI rose (new positions) or fell (closing).
Rising open interest means new positions are being opened - fresh money is entering the market. When open interest rises in the direction of the current price move, it confirms the trend has real conviction behind it: rising price with rising OI is a strong uptrend (new longs), and falling price with rising OI is a strong downtrend (new shorts). Rising open interest is the signal that a move is being funded by new participants rather than just existing ones closing out.
Falling open interest means positions are being closed - money is leaving the market. When a price move is accompanied by falling OI, it warns that the move is being driven by exits rather than new conviction. Rising price with falling OI is a weak uptrend fed by short covering; falling price with falling OI is a weak downtrend fed by long liquidation. In both cases, when the exits finish, the fuel behind the move is gone and it becomes prone to stalling or reversing.
Pair the open interest change with the price direction. A trend is healthiest and most sustainable when open interest is rising with it - new money entering in the trend's direction. A strong-looking price move on falling open interest is a caution flag, because it is being fed by traders closing rather than new buyers or sellers. So before trusting a breakout or trend, check that OI is rising alongside it; if OI is draining while price climbs, treat the move with suspicion.
On crypto perpetual futures, the three are tightly linked. Rising open interest is fresh leveraged positioning - the raw build-up of new leverage. The funding rate shows which side that new open interest leans: positive funding with rising OI means crowded new longs, negative means crowded new shorts. Liquidation is the eventual payoff, because today's rising open interest is tomorrow's liquidation fuel when those positions are forced out. Rising OI plus extreme funding plus a crowded liquidation map on one side is a classic over-leveraged, squeeze-prone setup.
No. Open interest is a derivatives-only concept - it counts open futures or perpetual contracts that are opened and later closed. Spot markets have volume but no open interest, because buying an asset on the spot does not create an open contract that remains outstanding; you simply own the asset. This is why open interest analysis is central to futures and crypto perpetual trading but does not apply to spot markets, where volume and price structure carry the analysis instead.
More guides
References & Related Guides
More in this topic
- Funding Rate Trading: Complete Guide 2026
- Liquidation in Trading 2026 - Magnets & Purges
- Cumulative Volume Delta (CVD): Complete Guide 2026
- What Are the Best Volume Indicators? (2026)
- Liquidity Sweep Trading: Stop Hunts Explained (2026)
- Order Flow Trading 2026 - Read the Footprint of Institutions
- Volume Profile Trading: Complete Guide 2026
- Smart Money Concepts (SMC): Ultimate Trading Guide 2026
- Premium and Discount Zones: Complete Guide 2026
- Risk Management in Trading 2026 - Complete Guide
- Delta Divergence: Complete Guide 2026
- Wyckoff Method 2026 - Complete Institutional Trading Guide
Core reading
- Funding Rate Trading: Complete Guide 2026
- Liquidation in Trading 2026 - Magnets & Purges
- Cumulative Volume Delta (CVD): Complete Guide 2026
- What Are the Best Volume Indicators? (2026)
- Smart Money Concepts (SMC): Ultimate Trading Guide 2026
- All Premium Guides
- Quantum Algo on TradingView
- Public Verified Track Record