What Is the Klinger Oscillator and How Do You Trade It?
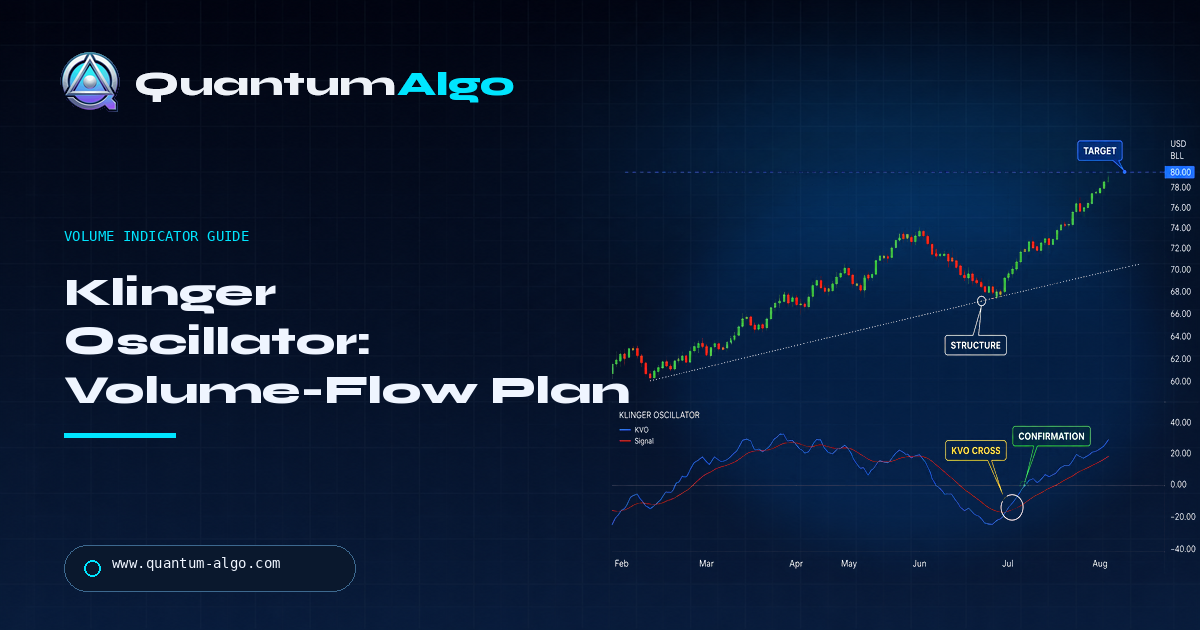
The Klinger Oscillator is most useful as a volume-flow confirmation layer, not as a standalone buy or sell switch. Read its fast and signal lines beside price location, displacement and a defined invalidation; a cross that happens in the wrong regime is just noise.
The Klinger Oscillator tries to answer a practical question: is volume supporting the direction of the move, or is price travelling on thinner participation? I use it on WTI, crypto, forex and index charts as a second opinion after structure has created a trade location. The order matters. Price creates the hypothesis; Klinger tells me whether the flow deserves more attention.
Indicators that prove themselves in public.
One engine, four precision tools — the Gold (XAU) Scalper, the institutional Gravity Zone, the Zeno momentum Oscillator, and Zeno Stocks for equities.
Use the guide as a decision filter, not as a collection of labels. The market, the session and the invalidation still decide whether an idea deserves risk.
What does the Klinger Oscillator measure?
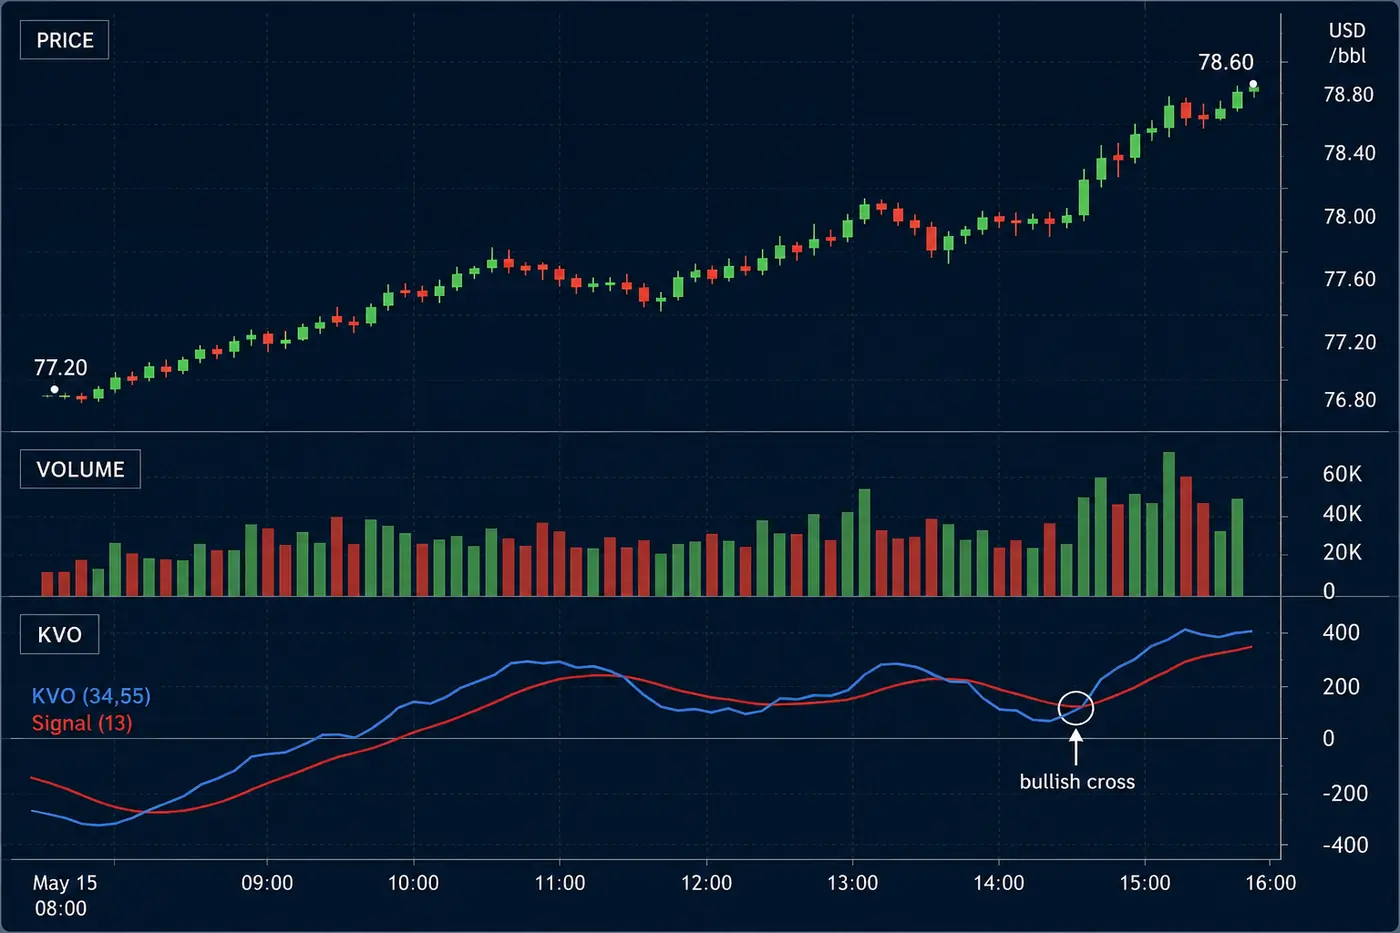
Klinger combines price direction with volume to estimate the force behind accumulation and distribution. It is built from a volume force series, then smoothed into a faster line and a slower signal line. When the fast line lifts above the signal line, buyers have improved the flow picture; that is evidence, not an order.
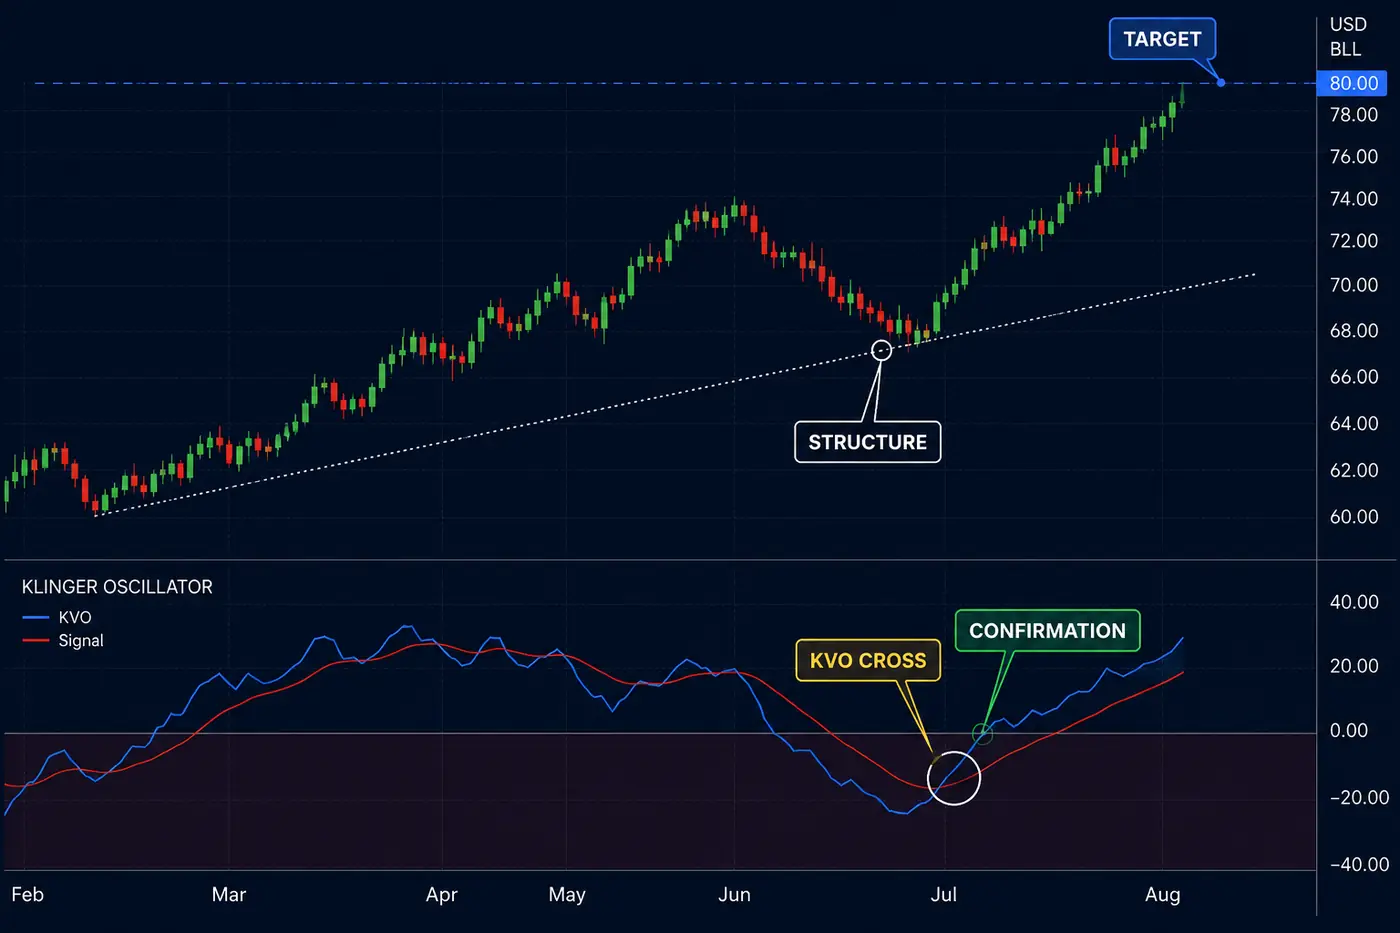
On a 15-minute WTI chart, I want the cross to occur after price has respected a meaningful level. A cross in the centre of a 40-cent range tells me very little. A cross after a sweep of the prior hour low, followed by a reclaim and a higher close, gives the same oscillator event a location and an invalidation.
| Item | Value / rule | Why it matters |
|---|---|---|
| Author / origin | Stephen J. Klinger, published 1997 (Technical Analysis of Stocks & Commodities) | The tool was built to combine volume with price trend, not to time entries alone |
| Default settings | Fast EMA 34 · Slow EMA 55 · Signal EMA 13 | KVO = EMA34(VF) − EMA55(VF); the signal is a 13-period EMA of KVO |
| Volume Force input | Volume × trend direction (from the high+low+close midpoint) × temp factor | Volume is signed by whether the typical price rose or fell |
| Zero line | KVO above 0 = accumulation bias; below 0 = distribution bias | Reads the regime before any cross is trusted |
| Three readings | Signal cross · zero-line cross · divergence against price | Divergence at a structure level is the highest-quality reading |
| Best pairing | Higher-timeframe level + displacement + defined invalidation | A cross with no location is noise |
How do you read a Klinger cross without chasing it?
Start with the zero line and the structure around the cross. A bullish cross below zero can mark a recovery from selling pressure, while a cross above zero shows a stronger positive-flow regime. Neither is automatically better. The useful question is whether the cross agrees with the direction you already have permission to trade.
I also look at the angle and separation. A tiny crossover with two flat lines is not the same event as a fast line lifting sharply while the signal line turns. On BTCUSDT, a cross that appears after a liquidation wick and a clean displacement candle is more interesting than a cross that appears after six overlapping candles.
What does Klinger divergence actually confirm?
Divergence is a warning about participation, not a promise of reversal. If WTI prints a higher high near 79.10 while Klinger prints a lower high, the second push carried less measured volume force. That can precede a pullback, but a strong trend can continue while the oscillator disagrees.
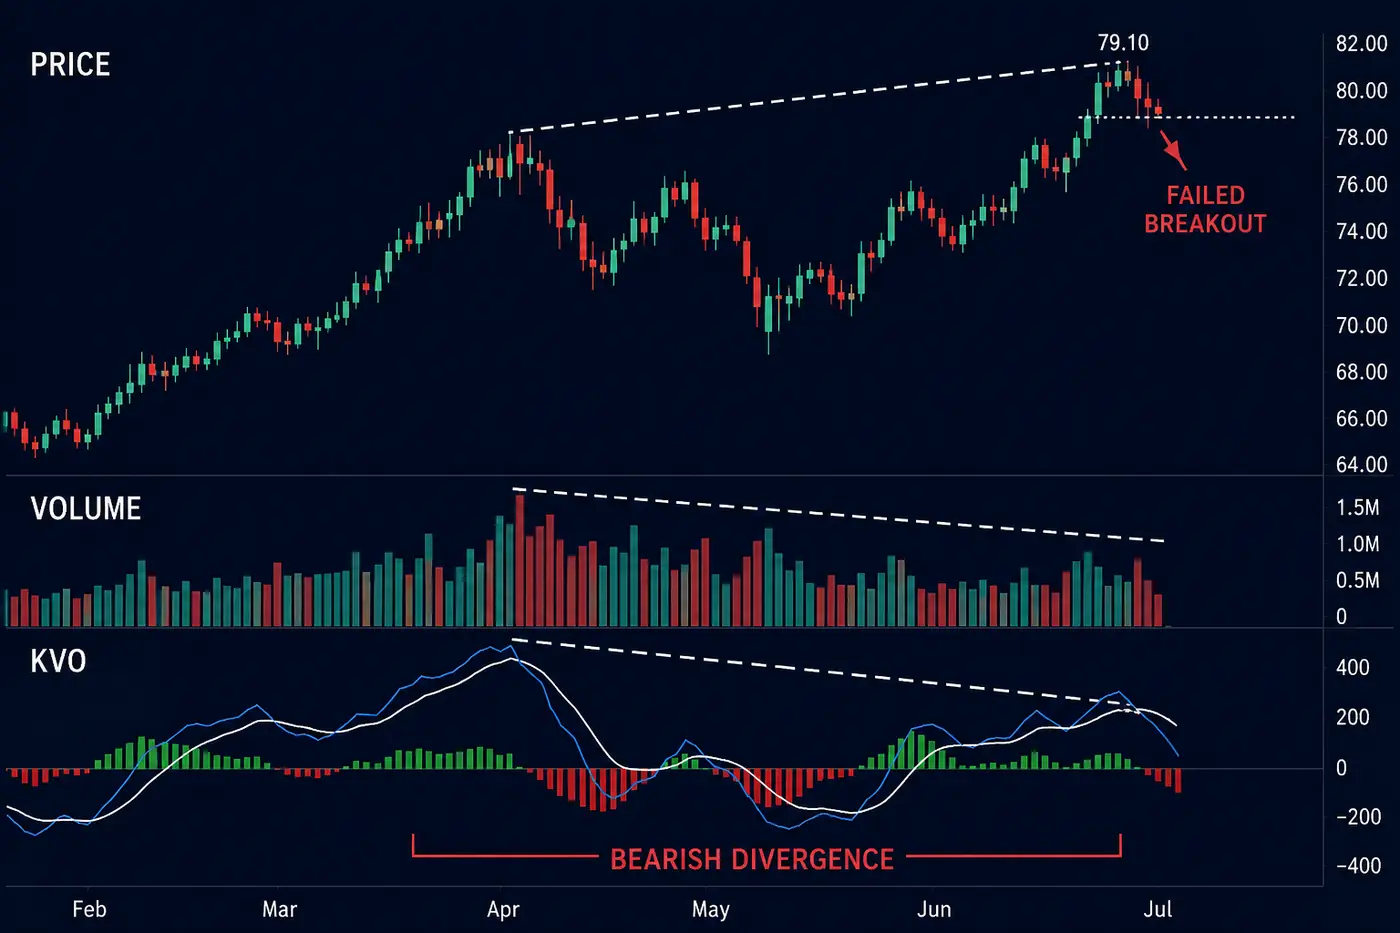
My rule is simple: divergence narrows the search area; it does not trigger the entry. I want a break of the short-term swing, a retest, or a failed continuation before I risk money. That keeps the oscillator in its proper role.

Automate your trades. Let Quantum Algo trade for you.
Every signal executed on your own account — on your account, with the plan you define.
Which Klinger settings fit oil, crypto and indices?
The default settings are a starting point, not a universal answer. Shorter settings make the oscillator respond faster and produce more crosses; longer settings reduce noise but delay the information. On a 5-minute chart, an aggressive setting can turn every small volume burst into a story. On a 4-hour crypto chart, the same setting may be too slow to notice a meaningful shift.
For a first pass, keep the standard calculation, then test one controlled change at a time. Compare 20 trades on the same symbol and session. Record whether the change improves location, not just whether it increases the number of winning crosses.
How do you combine Klinger with SMC displacement?
Use the free public Quantum Algo indicators for structure: order blocks, fair value gaps and the displacement that leaves them behind. Klinger is the participation check. A bullish order block that produces a sharp displacement and a Klinger cross has a coherent story; an order block with no response and a flat oscillator is a lower-quality observation.
Do not confuse product roles here. The free public indicators mark the SMC structures. Zeno provides signals with SL/TP and risk management; it does not draw a Unicorn, BPR or order block for you.
Can the Klinger Oscillator fail in a range?
Yes, and ranges are where the oscillator can look busiest. When price rotates between 76.80 and 77.50, volume spikes at both edges and the fast line repeatedly crosses the signal line. That is not a series of clean directional opportunities. It is information that the auction is balanced.
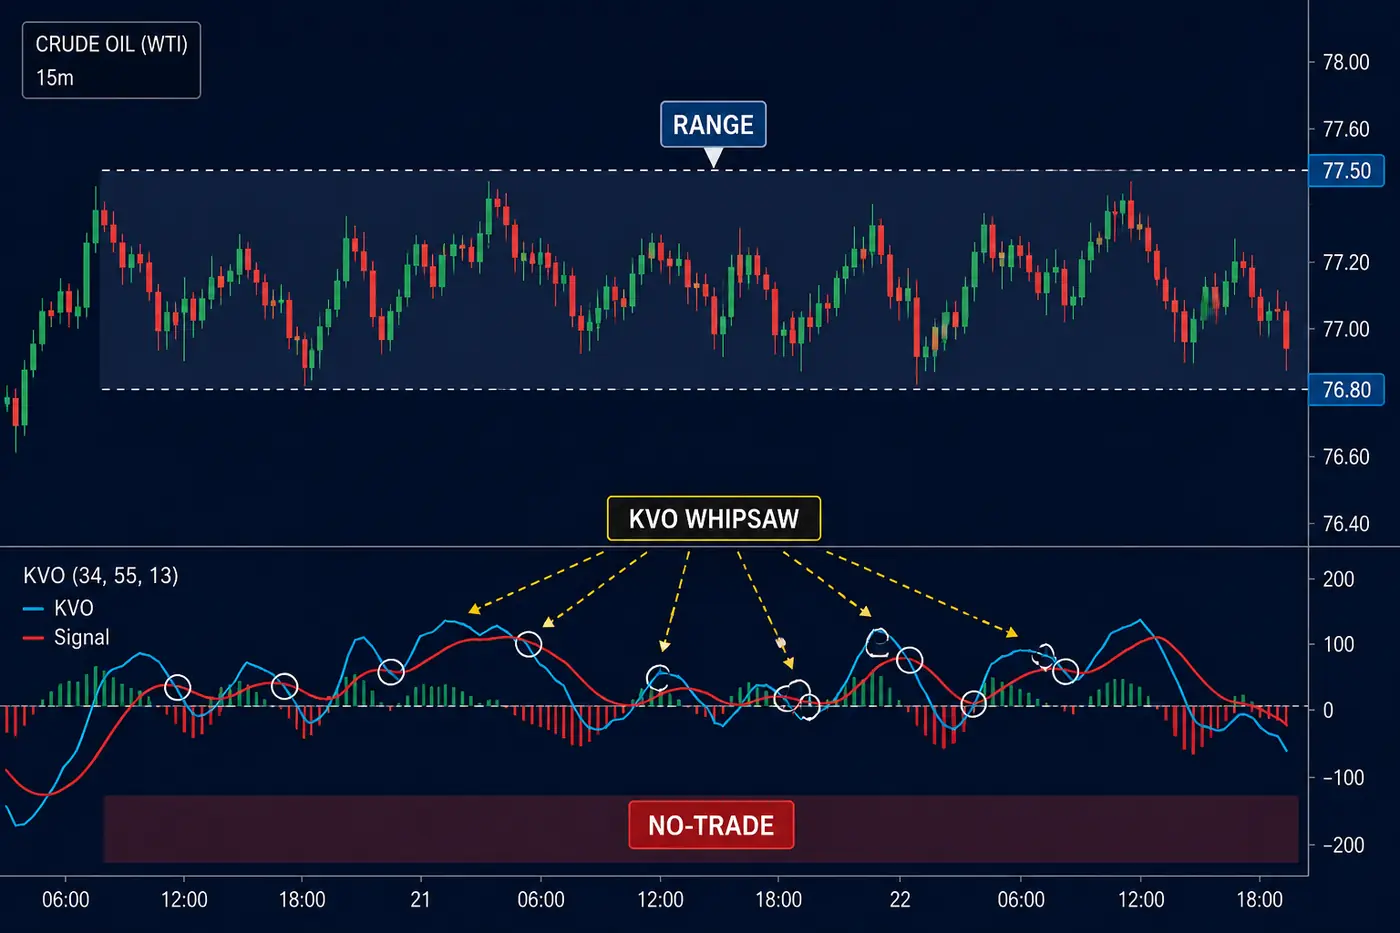
In a range I wait for the edge, then require rejection or acceptance outside it. A mid-range crossover is usually where I do nothing. Missing a mediocre cross costs less than paying spread and slippage on five of them.
How do you build a Klinger trade plan?
My plan has four decisions. First, mark the higher-timeframe level. Second, wait for price to show displacement, rejection or reclaim. Third, check whether Klinger confirms the same direction without being extended into an obvious opposing level. Fourth, define the stop before the order.
Suppose the account risk is $100 and one CFD point value is $10 per dollar move. A 38-cent stop changes the position size; the oscillator does not. If the required size is too large for the account, I skip the trade or choose a smaller contract. The signal must fit the risk plan, not the other way around.
For a second opinion on volume tools, compare the best volume indicators guide and the VSA guide. For the broader structure workflow, the free Academy is the better place to build the vocabulary.
Can a bot execute a Klinger-based signal?
A bot can execute a signal only after the rules are explicit: symbol, timeframe, entry condition, stop, target and risk. “Buy when Klinger crosses up” is not enough. It leaves location, spread, session and invalidation undefined.
Quantum Algo’s free public indicators mark order blocks and fair value gaps; Zeno provides confirmed Buy/Sell signals with stop-loss, take-profit and built-in risk management. QuantumBot is the $199/mo automated execution service. Plans are $19, $39 and $79 per month; cancel anytime. Verify the symbol and connection before allowing automation to act, and keep a public ledger or journal so the rule can be audited after the trade.
| Tool | What it measures | Its job in the plan |
|---|---|---|
| Klinger | Volume force + price direction | Participation confirmation after location |
| RSI | Momentum relative to recent range | Overbought/oversold context |
| MACD | Smoothed momentum and trend | Trend transition confirmation |
| VSA | Effort versus result | Candle-and-volume interpretation |
How do volume, price and Klinger disagree?
The fastest way to misuse Klinger is to treat the lower panel as a second price chart. It is not. A wide candle with heavy volume can still leave the oscillator flat if the net directional force is messy. Conversely, a modest-looking candle can lift the line when the session has a clear directional push. I separate the three observations: price tells me where the auction moved, raw volume tells me how much activity arrived, and Klinger estimates whether that activity travelled with directional intent.
On a 15-minute XAUUSD chart, for example, a New York opening candle can print a large volume bar while the range closes near its midpoint. I do not call that bullish because the bar is large. I mark it as an absorption question. If the next candle rejects the low, takes a nearby sell-side pool and the fast line turns up through the signal line, the oscillator has become useful. Without that sequence, the volume spike is just an event to remember.
This distinction also protects the trade from indicator stacking. Adding RSI, MACD and Klinger to the same panel does not create three independent confirmations if all three are derived from the same price series. I prefer one location tool, one participation tool and one risk rule. The free SMC indicators provide the location; Klinger supplies participation context; the stop defines the loss. That is a cleaner decision than counting coloured arrows.
How should you journal a Klinger setup?
Record the symbol, session, timeframe, higher-timeframe level, direction of the first displacement, Klinger state at the return, entry reason, invalidation and result in R. Add one line for what the oscillator did after entry. Did it continue away from the zero line, flatten immediately, or diverge before the stop? This tells you whether the tool is helping with selection or only helping you narrate trades after they happen.
Use a fixed sample. Twenty trades on EURUSD during London is more informative than five trades spread across BTC, gold, oil and the US close. Do not change the settings halfway through the sample. If a shorter setting produces more winners but also more trades, compare expectancy after spread, commission and slippage. A higher win rate can still be a worse process when the average loser expands.
I also mark “no-trade” crosses. These are the signals that appeared in a boxed range, directly under a higher-timeframe resistance, or after the move had already travelled two times the average session range. The no-trade sample prevents hindsight from turning every cross into a missed opportunity. A useful indicator should improve the decisions you decline, not only the decisions you take.
What changes between futures volume and spot volume?
Volume is not identical across markets. WTI futures have centralized exchange volume, while a spot-forex feed commonly reports tick volume from the broker’s stream. Crypto exchanges can show exchange-specific volume that differs between venues. Klinger can still be useful, but the meaning of a “volume surge” depends on the feed. If you change brokers or symbols, treat the indicator as recalibrated rather than assuming the old behaviour transfers perfectly.
For that reason I would not publish a universal claim such as “Klinger works best on the 15-minute chart.” The right test is narrower: does the same feed, session and setup definition produce a repeatable difference between qualified and rejected trades? If not, the oscillator may be visually persuasive without adding measurable edge.
What should you do when Klinger confirms too late?
Late confirmation is a design problem, not a reason to chase. If price has already travelled from 78.00 to 78.70 and Klinger finally crosses up, the cross may describe the move you missed. I mark the original location and ask whether the oscillator was improving during the first displacement. If it was, I can use that information on the retest. If it only reacts after the extension, I leave the entry alone.
On lower timeframes, I sometimes use the line’s slope as an early observation and the cross as a stricter confirmation. That is not the same as entering on a slope. It means I notice when flow is changing, then wait for price to prove the change at a level. A 5-minute KVO turn inside a 1-hour bearish FVG is not a long signal; it is a detail to watch while the higher-timeframe location remains unresolved.
Stops and targets should not be derived from the oscillator. Place the stop beyond the swing, order block or range edge that invalidates the price idea. Use the next liquidity pool or a planned R multiple for the target. If Klinger flattens after entry, the plan does not automatically change. Exit rules belong in the plan before the chart becomes emotionally expensive.
Review the losing trades in groups. A cluster of losses during low-volume Asian hours tells a different story from losses after large US news. A cluster of wins after London liquidity sweeps may show that the tool is acting as a session filter rather than a universal oscillator. That is the kind of conclusion worth taking from a journal: specific enough to test, modest enough not to become a promise.
What does a high-quality Klinger confirmation look like?
Picture a London-to-New York WTI handoff. Price sweeps the prior session low, reclaims it and prints a bullish displacement candle. The fast Klinger line turns up below zero, crosses the signal line and keeps widening as price retests the displacement origin. That is a complete sequence: location, response, participation and invalidation. If the cross appears first but price never reclaims the level, I do not manufacture the rest of the story.
The same logic works on BTCUSDT, but the clock is different. A 24-hour market can produce a clean flow change during a US session, then lose it during a thin weekend period. I tag the session and liquidity conditions because the oscillator’s visual shape does not reveal the quality of the market underneath it. A line that looks identical on two charts can represent very different execution.
My final check is opportunity cost. If the Klinger-confirmed setup requires a 1.5R target into a nearby high while another clean setup offers 2.3R with the same risk, the indicator does not make the first trade special. The tool helps rank candidates; it does not remove the need to compare them.
What is the Klinger rule I would actually trade?
I would trade only when a mapped level produces a clear price response, the Klinger line confirms the direction without a flat crossover, and the stop gives the target at least a sensible multiple. That rule is deliberately boring. It prevents the lower panel from becoming a reason to enter in the middle of nowhere.
If any part is missing, I log the chart as an observation. Those observations build a better sample than forcing a binary “indicator works” verdict. The useful output is not a colourful arrow; it is a repeatable distinction between qualified flow and noise.
What should the Klinger checklist leave out?
It should leave out predictions about the next candle, fixed claims about a universal setting and any suggestion that a crossover can replace a stop. Those shortcuts make a volume tool sound more certain than it is. Keep the checklist tied to the feed, session and setup definition you can test.
Klinger is a participation check, not a trade trigger. Let price location and displacement create the setup, then use the oscillator to test whether volume flow agrees. Divergence is a warning; a cross in a range is often a reason to wait.
◆ Interactive check
Can you use Klinger without chasing crosses?
Questions traders ask about volume indicators
The Klinger Oscillator is a volume-flow indicator that combines price direction and volume to estimate accumulation and distribution pressure. It is usually read through a faster line, a signal line and the zero line.
It is best treated as a confirming oscillator rather than a guaranteed leading signal. It can show improving or weakening flow before price makes a large move, but the information still needs price structure and risk context.
Wait for the crossover to agree with a meaningful level, displacement or reclaim. Define the invalidation first, then use the cross as confirmation instead of entering every time the two lines touch.
Klinger divergence means price and measured volume force are moving in different directions. It is a warning that participation may be weakening, not proof that price must reverse.
Start with the default settings and test changes on the same symbol and timeframe. Shorter settings react faster but create more noise; longer settings smooth the signal and delay it.
It can be used on forex charts, but spot-forex volume is often tick volume rather than centralized exchange volume. Treat it as broker-feed context and test it on the exact symbol you trade.
Yes. Use SMC structures for location and displacement, then use Klinger to check whether volume flow supports the move. The free public indicators mark order blocks and FVGs; Zeno provides signals with SL/TP and risk management.
Quantum Algo’s public indicator focus is Smart Money Concepts structures such as order blocks and fair value gaps. Zeno is the signal layer; it does not draw Klinger-specific structures or imply that a Klinger cross is a guaranteed signal.
There is no universal best timeframe. Use a higher timeframe for the directional context and a practical execution timeframe for the setup, then keep the Klinger settings and test sample consistent.
QuantumBot can automate a defined signal plan where a supported connection is available. A rule must specify entry, stop, target, symbol and risk; a standalone oscillator cross is not a complete automation rule.
Quantum Algo publishes a timestamped ledger showing 75% across 140 posted trades, with 105 wins and 35 losses. That record is available to verify and is not a promise for a Klinger setup or an individual account.
References & Related Guides
Read next
- Best Volume Indicators: Complete Guide
- Volume Spread Analysis: Complete Guide
- Divergence Trading Guide
- Mean Reversion Trading Guide
Authoritative sources
- TradingView: Klinger Oscillator reference
- CME Group: WTI contract specifications
- StockCharts ChartSchool: Klinger Oscillator