Market Facilitation Index (BW MFI): Bill Williams' Volume-Range Indicator, and Why It Is Not the Money Flow Index
The Market Facilitation Index (BW MFI) is Bill Williams' indicator that measures how much price movement each unit of volume produced — (high − low) ÷ volume — and colours every bar by two changes from the previous bar: whether the index rose or fell, and whether volume rose or fell. The four colours are the tool: green (both up — moving with participation), fade (both down — losing interest), fake (index up, volume down — a move without support) and squat (index down, volume up — heavy volume that failed to move price, the bar before reversals). It is not the Money Flow Index, which shares the letters and nothing else.
Two indicators answer to "MFI" and traders mix them up constantly; this page is the one Bill Williams built, which reads a single bar's participation and is more useful at a level than most oscillators. It covers the four-colour matrix, the squat at a level, the formula, how to use it, where it fits a Smart Money workflow, the disambiguation from the Money Flow Index, platforms, a worked Nasdaq example and the checklist. The classifier below takes two changes and returns the colour and its meaning.
Indicators that prove themselves in public.
One engine, four precision tools — the Gold (XAU) Scalper, the institutional Gravity Zone, the Zeno momentum Oscillator, and Zeno Stocks for equities.



What is the Market Facilitation Index?
The Market Facilitation Index (MFI) is Bill Williams' indicator that measures how much price movement each unit of volume produced — (high − low) ÷ volume — and, more usefully, colours every bar by the combination of two changes: whether the index rose or fell from the previous bar, and whether volume rose or fell. The four colours are the whole tool: green (both up — the market is moving with participation), fade (both down — it is losing interest), fake (index up, volume down — a move without support) and squat (index down, volume up — heavy volume that failed to move price, the bar that precedes reversals). It is not the Money Flow Index, which shares the abbreviation and nothing else; the last section disambiguates them.
The four bar colours
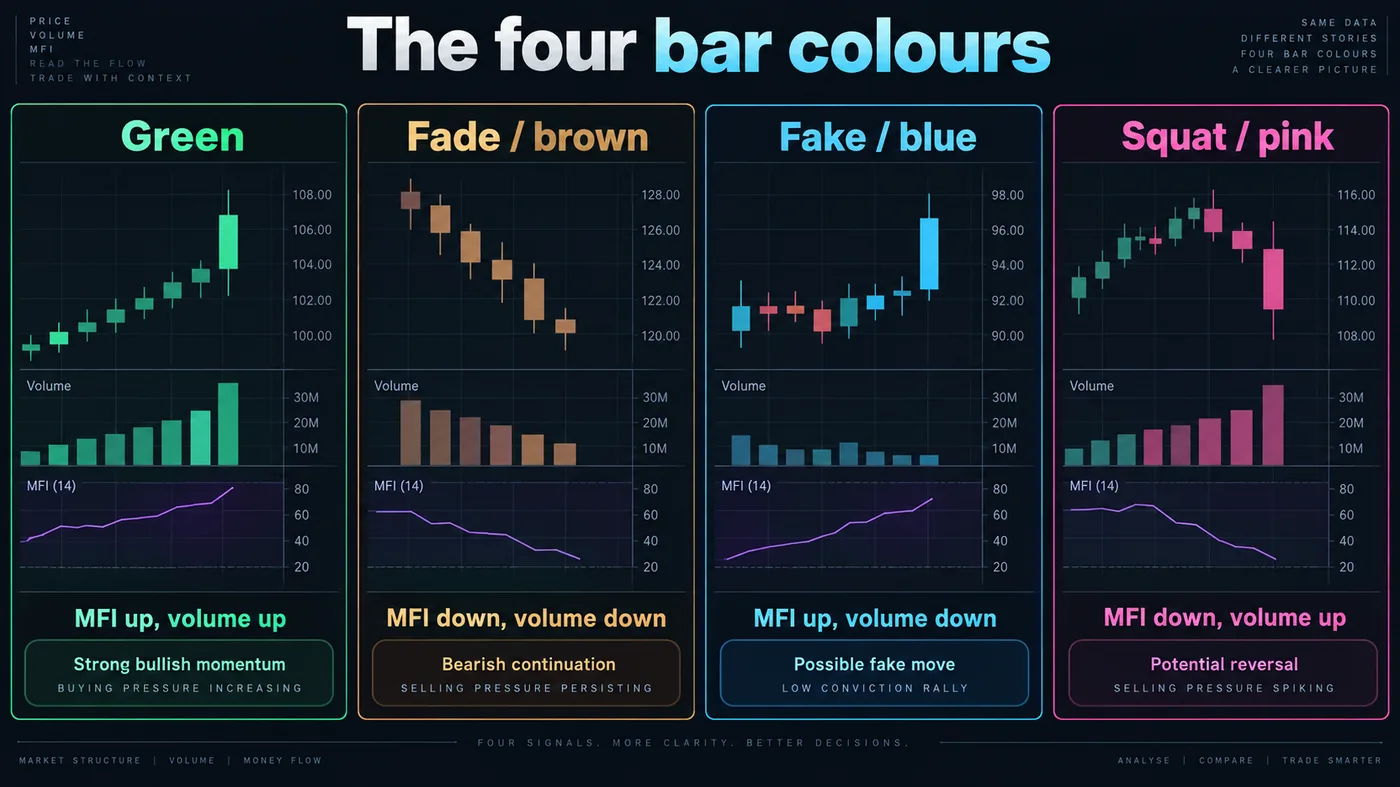
The illustration in this guide lays out the matrix:
| MFI vs previous bar | Volume vs previous bar | Colour (Williams) | Meaning |
|---|---|---|---|
| Up | Up | Green | The market is moving and participants are joining — trend continuation |
| Down | Down | Fade (brown) | Movement and interest both shrinking — the end of a move, boredom, a pause |
| Up | Down | Fake (blue) | Price moved on thin volume — a move without support, often a trap |
| Down | Up | Squat (pink) | Heavy volume but price barely moved — a battle at a level; the bar before a reversal or a breakout |
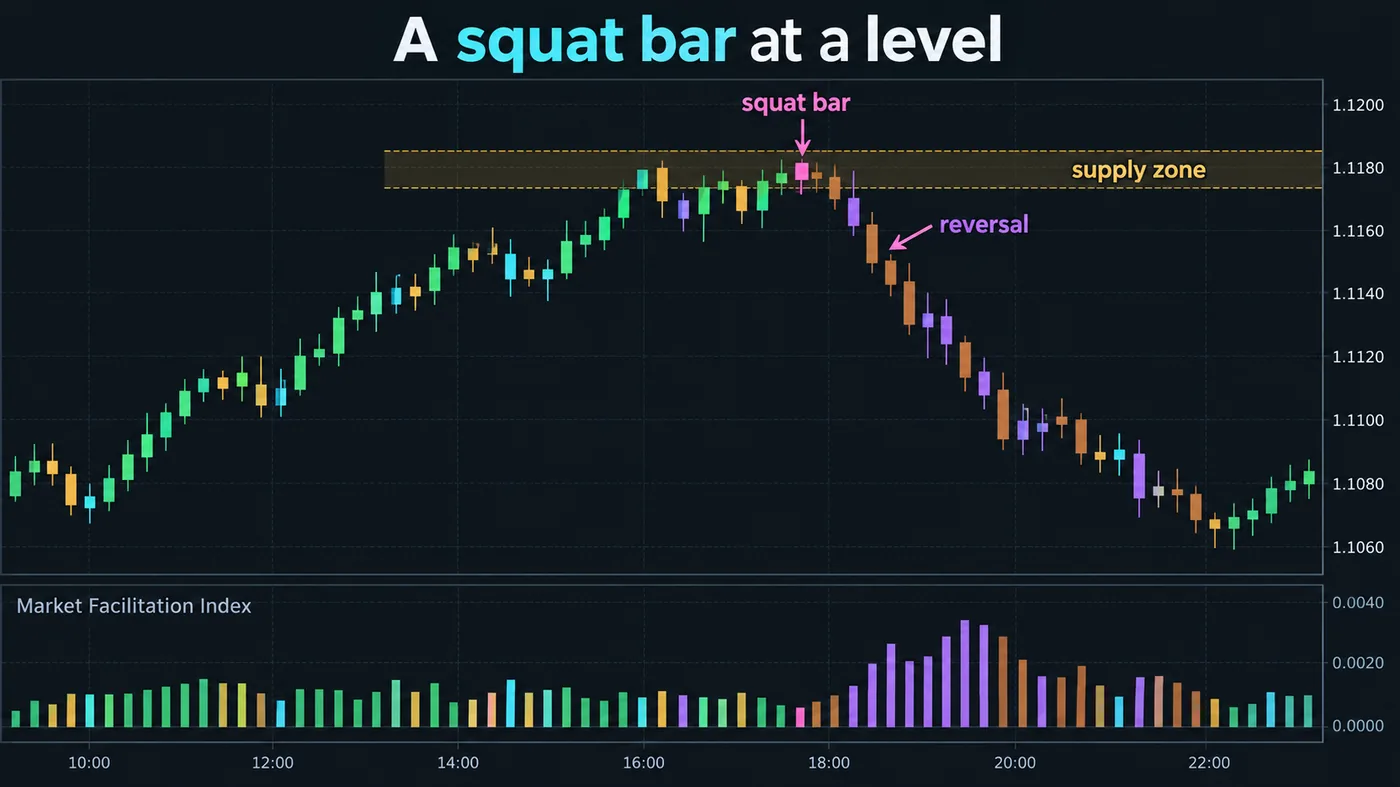
Williams' own emphasis was on the squat: it is where the largest volume meets the smallest range, which means one side absorbed the other, and the next bars decide who won. In Smart Money terms a squat at a supply or demand zone is absorption — the institution filling — and the bar after it is the one to watch.
A squat bar at a level
The chart illustration in this guide shows price bars coloured by MFI approaching a supply zone: green bars into the zone, then a pink squat bar exactly at it — volume spikes, the range collapses — and the reversal that follows. That sequence is the trade: the squat is not the entry, it is the warning; the entry is the change of character on the next bars, with the stop beyond the squat bar's extreme and the target at the next liquidity. A squat inside a range with no level behind it means far less.

Automate your trades. Let Quantum Algo trade for you.
Every signal executed on your own account — on your account, with the plan you define.
How it is calculated
MFI = (high − low) ÷ volume, per bar, scaled for readability (TradingView's built-in multiplies by a factor so the values are legible). The value itself is rarely read — a bar with a $50 range on 1,000 contracts and a bar with a $5 range on 100 contracts have the same index — which is why Williams compared each bar with the one before and coloured the result. The index is the raw material; the colour is the indicator.
How to use it
- Ignore the line, read the colours — on TradingView the built-in "Market Facilitation Index" histogram is coloured by the four states; many traders apply the colours to the price bars instead.
- Green with the trend — continuation; hold or add at structure.
- Fade after a move — interest gone; take profit at the next level, expect a pause.
- Fake on a breakout — a break of a level on a fake bar has no participation; treat it as a sweep candidate rather than a breakout, and let the Liquidity Sweeps indicator confirm.
- Squat at a level — absorption; wait for the next bar's direction and the change of character, then trade it with the stop beyond the squat.
Where it fits a Smart Money workflow
The MFI's four states are volume-and-range reads on a single bar, which is exactly the information missing from a structure chart: the location comes from the order block, the ranked level or the sweep; the MFI says whether the bar at that location had participation (green), was a trap (fake) or was absorption (squat). It pairs naturally with the Order Blocks with Volume indicator (volume at the zone) and the Institutional Pressure Oscillator (directional pressure over a window) — the MFI is the per-bar view, the oscillator the accumulated one.
MFI versus the Money Flow Index
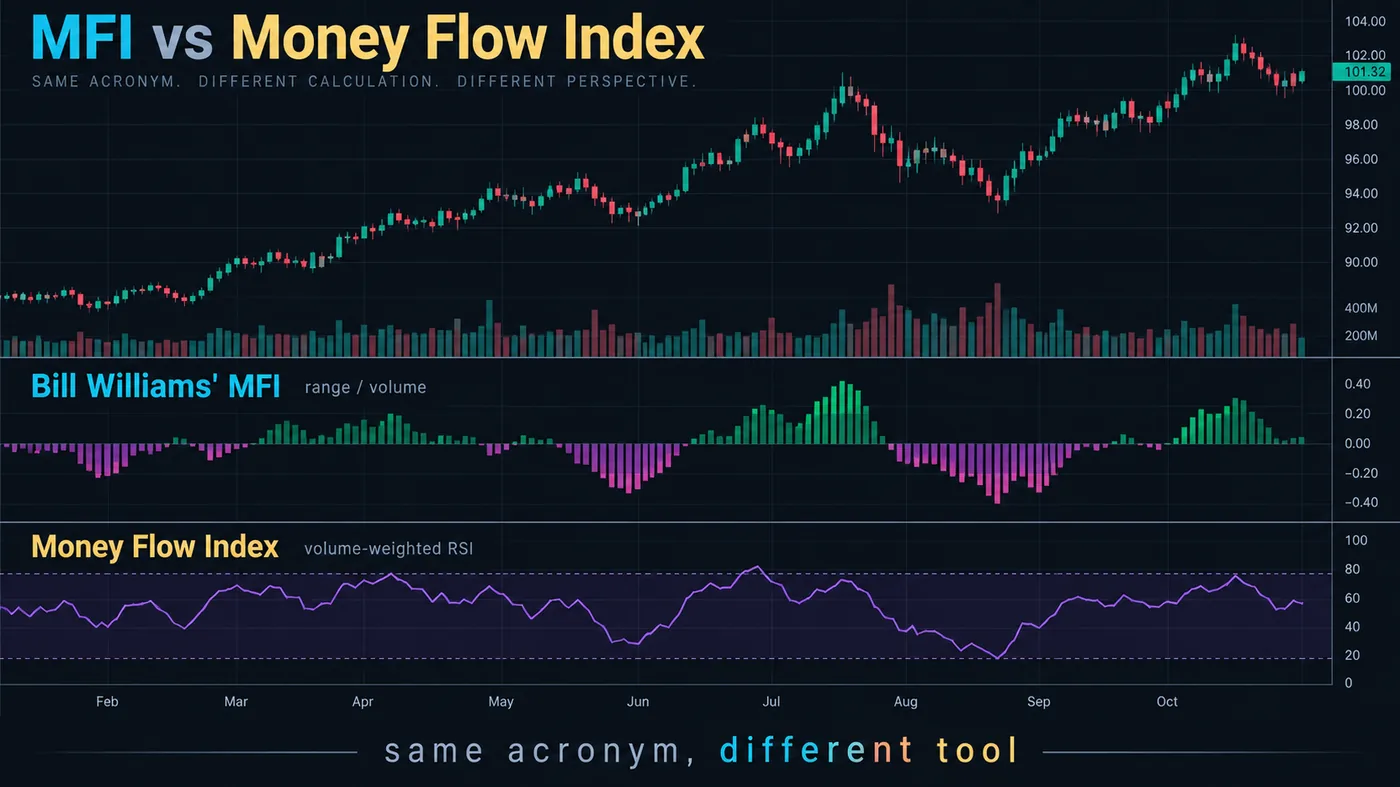
The disambiguation illustration in this guide puts the two indicators in separate panes, because the shared abbreviation causes real confusion:
| Market Facilitation Index (BW MFI) | Money Flow Index | |
|---|---|---|
| Author | Bill Williams | Gene Quong and Avrum Soudack |
| Formula | (high − low) ÷ volume, per bar | A volume-weighted RSI of typical price over 14 periods |
| Output | Four coloured states | A 0–100 oscillator with 20/80 levels |
| Reads | Whether volume produced movement on this bar | Whether money is flowing in or out over the window |
| Use | Bar-by-bar participation, traps, absorption | Overbought/oversold, divergence |
Our Money Flow Index guide covers the second; this page is the first. If a strategy says "MFI" without a formula, ask which one.
Settings and platforms
There is nothing to set — the index has no period. On TradingView, "Market Facilitation Index" is in the built-in indicators with the four colours; MetaTrader ships it as "BW MFI" in the Bill Williams group with the same colours. The only choice is whether to show it as a histogram pane or to colour the price bars, which most Williams-method traders prefer.
Mistakes
- Reading the index value — it is meaningless across bars of different size; only the colour comparison means anything.
- Confusing it with the Money Flow Index — different authors, formulas and uses.
- Trading the squat itself — it is absorption, direction unknown; the next bars decide.
- Reading green as "buy" — green is participation in whatever direction the bar moved; a green down bar is a real down move.
- Using it on symbols with unreliable volume — the whole index is volume; on CFD tick volume the colours are indicative.
A worked example: a squat before the breakout
Nasdaq futures, 5-minute, 09:40 ET. Price has climbed into the pre-market high — a ranked level on the Institutional Key Levels tool — on three green bars: range expanding, volume rising, participation with the move. The bar at the level prints pink: volume the largest of the session, range the smallest — a squat. Buyers pushed into the level and were absorbed. The next bar is a fake (blue): a small push above the level on falling volume — the breakout without support — and the bar after it closes back below with a fade. That sequence — green into the level, squat at it, fake through it, fade back — is the textbook failed breakout, and it is also a liquidity sweep of the pre-market high. Short on the close of the fade bar, stop above the fake bar's high, target the opening-range low. The MFI did not find the level; the level tool did. The MFI read the four bars at it.
The MFI checklist
- A level from structure — the MFI colours mean most at a location.
- Green bars into the level: participation; continuation likely if the level breaks on green.
- Squat at the level: absorption; wait for the next bars.
- Fake through the level: a break without volume; treat as a sweep candidate.
- Fade after a move: interest gone; take profit, expect a pause.
- Volume source: exchange or futures volume for reliable colours; tick volume for indicative ones.
- Journal the colour of the entry bar; after fifty trades, see which colours preceded the winners.
Bill Williams' original method
Williams published the MFI as one of five tools in his Profitunity method, alongside the Alligator, the Awesome Oscillator, the Accelerator and Fractals. In that system the MFI's job was to read the participation behind each fractal break and each Alligator wake-up: a green bar on the break was the "green light", a fake was the warning, the squat the moment "the fight" was being decided. The tool stands on its own outside the method — its four states are useful under any structure approach — and it is one of the few indicators from that era whose reading has not changed with the markets.
Four colours from two comparisons — did the range-per-volume rise, did volume rise — and the one that matters most is the squat: heavy volume that could not move price, the bar where one side absorbed the other. Read the colours only at a location, never the index value, never as direction, and never confuse it with the Money Flow Index.
◆ Interactive check
Do you know the colours?
Questions traders ask about the Market Facilitation Index
How much price range each unit of volume produced on a bar — (high − low) ÷ volume — and, by comparing each bar with the last, whether the market is moving with participation, fading, faking or being absorbed.
A bar where volume rose but the index fell — heavy volume, small range: one side absorbed the other. Williams considered it the most important of the four; at a level it precedes reversals and breakouts.
No. BW MFI is Bill Williams' Market Facilitation Index; "MFI" alone usually means the Money Flow Index, a volume-weighted RSI. They share letters, not formulas.
Yes, on exchange volume — the colours are reliable on Bybit, Binance and futures. On forex CFDs the volume is tick volume, so treat the colours as indicative.
None — it has no period. Choose the histogram pane or coloured price bars; most Williams-method traders colour the bars.
Not inside Zeno; the free Order Blocks with Volume and Institutional Pressure Oscillator cover the volume read at the zone and over the window. The MFI's per-bar colours are a compatible addition.
Yes — a built-in under "Market Facilitation Index", drawn as a histogram coloured by the four states. MetaTrader ships it as BW MFI in the Bill Williams group.
Green: MFI and volume both up — moving with participation. Fade (brown): both down — losing interest. Fake (blue): MFI up, volume down — a move without support. Squat (pink): MFI down, volume up — absorption.
No — green means participation in whatever direction the bar moved; a green down bar is a real down move. The colours describe the bar, not the trade.
No period, no inputs — only the display choice: a histogram pane or colouring the price bars themselves.
BW MFI is (high − low) ÷ volume per bar, coloured by comparison; the Money Flow Index is a 14-period volume-weighted RSI of typical price with 20/80 levels. Different authors, formulas and uses.
Not inside Zeno; the free Order Blocks with Volume and Institutional Pressure Oscillator cover volume at the zone and over the window. The MFI's per-bar colours are a compatible addition at a level.
References & Related Guides
Read next
- Money Flow Index (MFI) — the other MFI
- Order Blocks with Volume (free indicator)
- Institutional Pressure Oscillator (free indicator)
- Institutional Key Levels (free indicator)
- On-Balance Volume (OBV)
- Liquidity Sweep Trading
- Footprint Chart Trading
- Zeno — the premium engine