Chaikin Money Flow (CMF): Formula, Settings and How to Read It
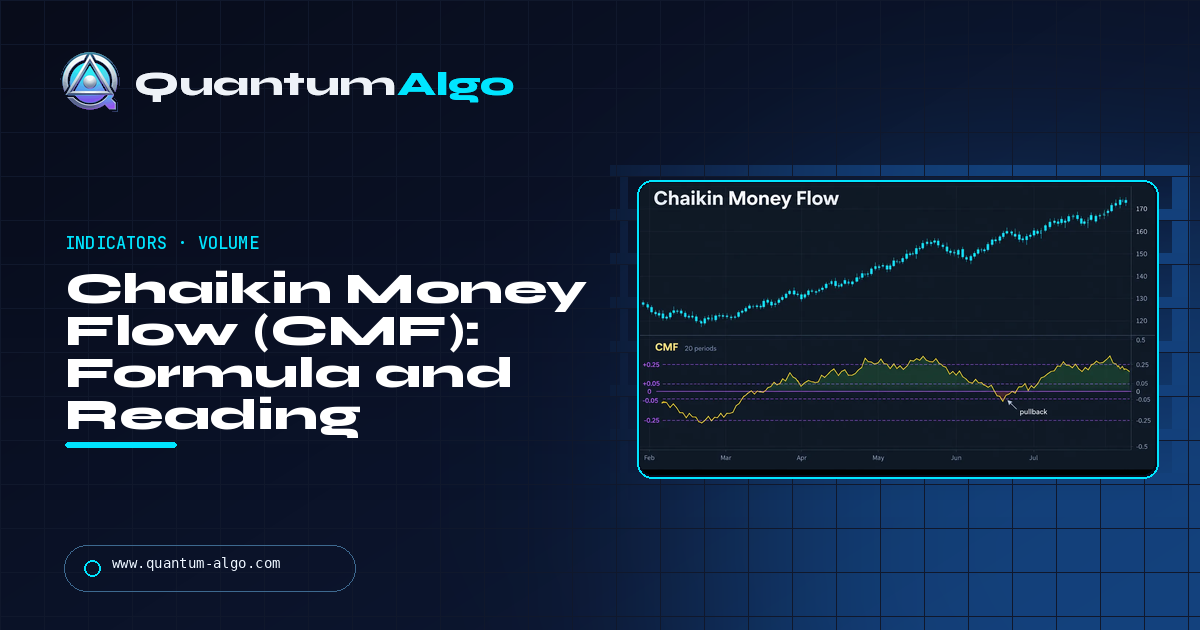
Chaikin Money Flow (CMF) measures where each bar closed inside its own range — near the high scores +1, near the low −1 — weights that by volume, sums it over 20 bars and divides by the 20-bar volume. Above +0.05 is buying pressure, below −0.05 selling pressure, beyond ±0.25 strong; the band in between is noise. It reads intrabar conviction rather than bar-to-bar direction, which is why it disagrees with OBV. Its best use is divergence — price making a higher high while CMF makes a lower high is distribution — and confirming that a breakout had volume behind it. It is fast, unfiltered and short-horizon; entries come from the chart.
CMF is the volume indicator I reach for when a breakout looks right and I want to know whether the closes agree. It answers a narrow question — did the bars finish strong or weak, on volume — and it answers it fast, which makes it a good divergence and confirmation tool and a poor trigger. This page is the multiplier and the formula, the ±0.05 and ±0.25 levels, how to read the sign, the cross and the divergence, the comparison with OBV, VFI, MFI and the A/D line, a BTCUSDT 4-hour top worked from the divergence at an order block to the cross at the structure break, and where CMF misleads. The calculator runs the full formula on pasted bars.
Indicators that prove themselves in public.
One engine, four precision tools — the Gold (XAU) Scalper, the institutional Gravity Zone, the Zeno momentum Oscillator, and Zeno Stocks for equities.



What Chaikin Money Flow measures
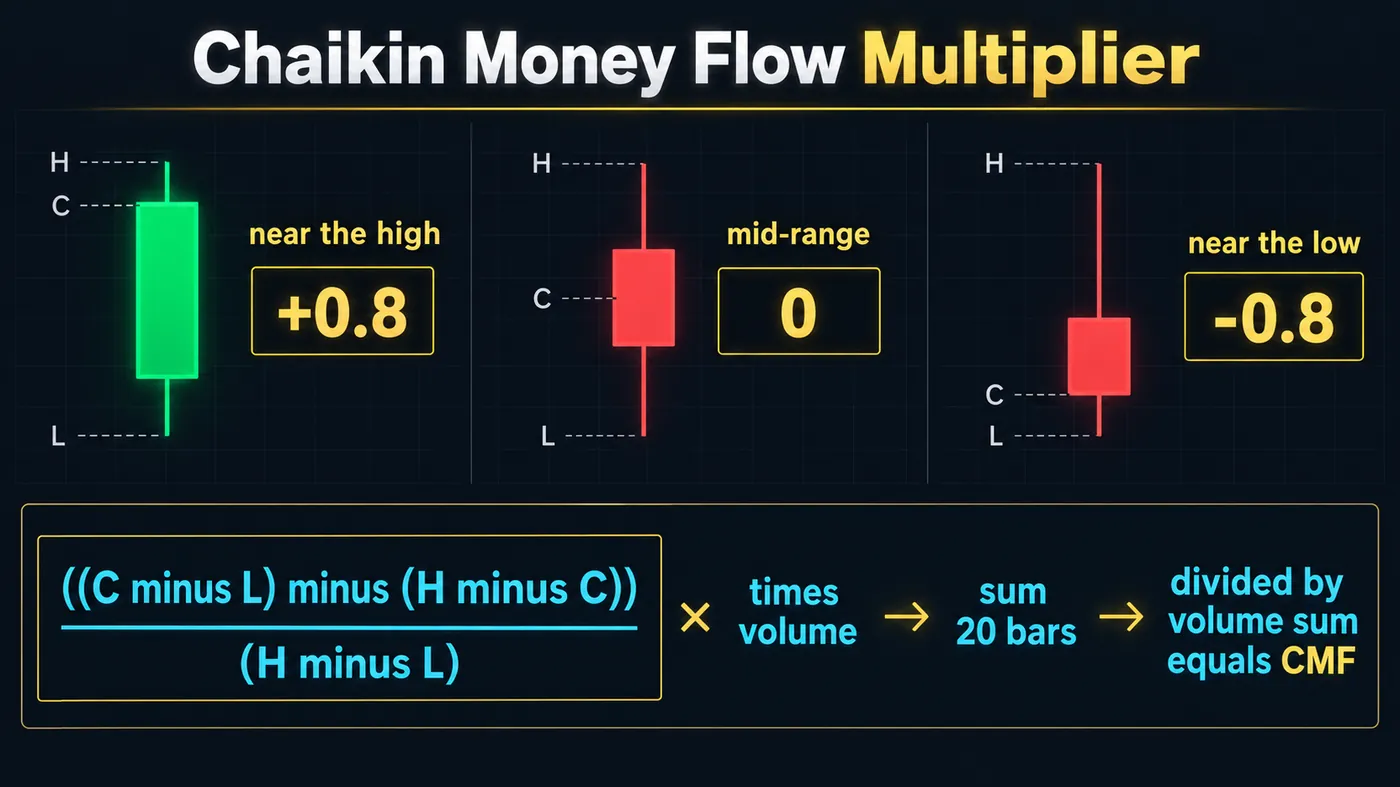
Chaikin Money Flow asks one question of every bar: where did it close inside its own range? A bar that closes at its high gets a multiplier of +1; at its low, −1; in the middle, 0. Multiply that by the bar's volume, sum the result over 20 bars, divide by the total volume over the same 20 bars, and you have CMF — a number between −1 and +1 that says whether, on balance, volume has been arriving on bars that closed strong or bars that closed weak. Above zero is accumulation in Marc Chaikin's sense; below zero, distribution.
It is the oscillator version of Chaikin's Accumulation/Distribution line, built in the 1980s on Larry Williams' close-location idea, and its defining feature is that it ignores the direction of the bar relative to the previous one. A bar that gapped down but closed at its high is a +1; a bar that gapped up and closed at its low is a −1. On-Balance Volume would score those the opposite way. CMF is measuring intrabar conviction, not day-to-day direction.
What it does not do: it has no memory beyond its window and no filter on which bars count. A 20-period CMF reacts to every candle, which makes it fast and makes it noisy — the ±0.05 band exists because most readings sit inside it and mean nothing. It is a confirmation and divergence tool with a short horizon; the Volume Flow Indicator is the slow, filtered cousin for the regime question.
The formula
| Step | Formula | Range |
|---|---|---|
| 1. Money flow multiplier | ((close − low) − (high − close)) ÷ (high − low) | −1 to +1 |
| 2. Money flow volume | multiplier × volume | — |
| 3. CMF | Σ money flow volume over n ÷ Σ volume over n | −1 to +1; in practice −0.5 to +0.5 |
| Levels (Chaikin) | ±0.05 = buying / selling pressure; ±0.25 = strong | — |
The multiplier is the whole idea. A close in the top quarter of the range is a bar the buyers finished in control of, whatever happened on the way; a close in the bottom quarter is one the sellers finished. Weighting by volume means a high-volume bar closing weak counts more than a low-volume one, and dividing by total volume normalises across instruments so that +0.2 means the same thing on ES and on a small cap. Bars with high equal to low (rare outside thin markets) get a multiplier of zero.
| Use | Period | Levels | Note |
|---|---|---|---|
| Default (Chaikin) | 20 | ±0.05 / ±0.25 | Roughly one month of daily bars; 21 is common and identical in practice |
| Daily swing | 20–21 | ±0.05 / ±0.25 | Keep it |
| 4H crypto and indices | 20–30 | ±0.05 / ±0.20 | Slightly longer to offset 24-hour noise |
| Intraday 15M | 20 | ±0.10 / ±0.25 | Wider neutral band; use only with a session or VWAP filter |
| Faster confirmation | 10 | ±0.10 | Reacts to every candle; divergence only, never the cross |
How to read it
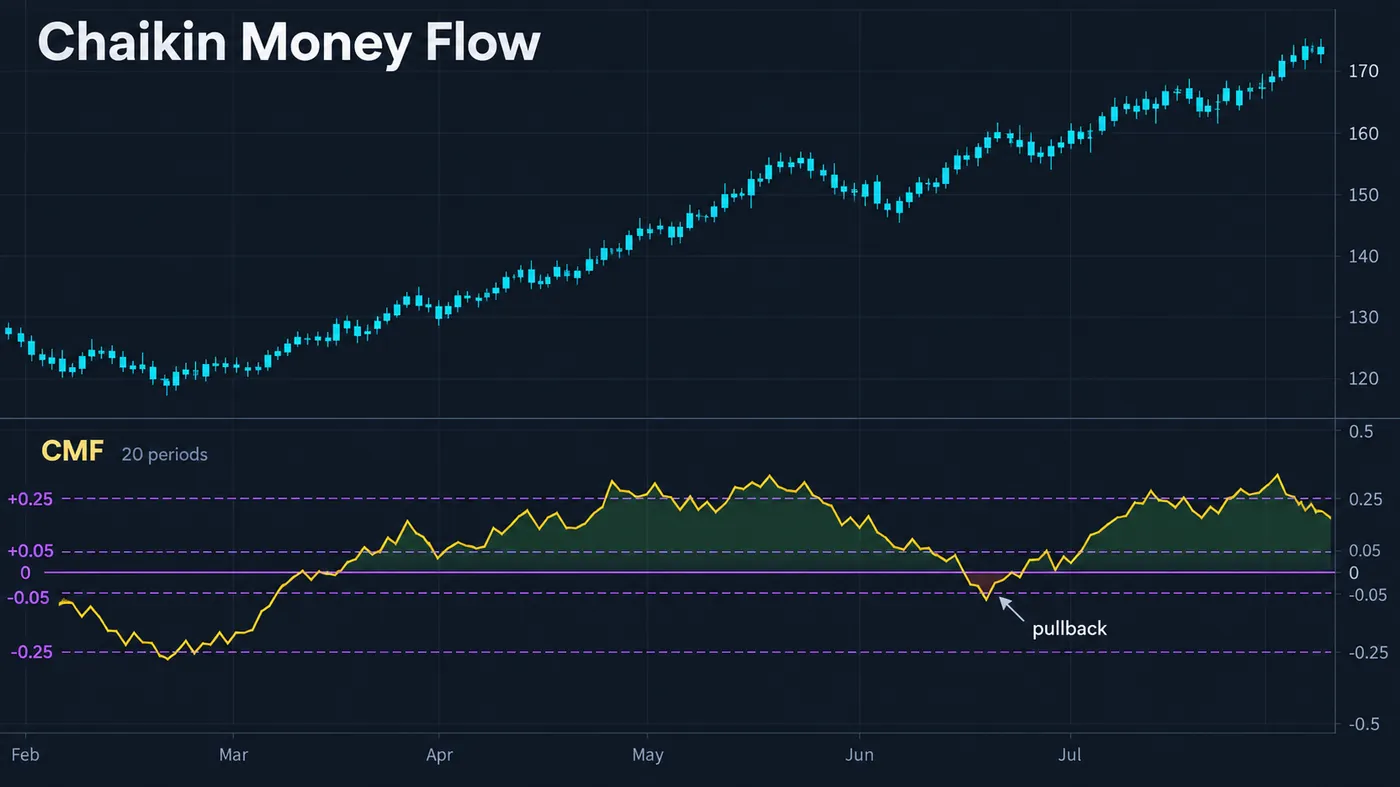
The sign and the band. Sustained readings above +0.05 confirm an uptrend: closes are landing in the upper part of their ranges on volume. Below −0.05 confirms a downtrend. Between the two is noise, and a 20-period CMF spends much of its life there. A reading beyond ±0.25 is strong and, in a trend, is the phase to hold through pullbacks.
The zero cross. Chaikin's original signal, and the noisiest — CMF crosses zero constantly in ranges. Use the ±0.05 band instead: a cross above +0.05 after a stretch below is a confirmation of a turn that structure has already shown, not a trigger on its own.
Divergence. The reading that earns its place. Price makes a higher high while CMF makes a lower high: the new high was made on bars that closed weaker in their ranges — buyers pushed it up and did not hold it. That is distribution at a top from the volume side, and it precedes the cross by several bars. The bullish mirror at lows is equally useful. Divergence on CMF is more reliable than on price-only oscillators because volume is in it.
Failure to confirm a breakout. A close above resistance with CMF still under +0.05 is a breakout the volume did not join. Half of those are traps; the ones with CMF pushing through +0.10 on the breakout bar are the ones worth chasing.

Automate your trades. Let Quantum Algo trade for you.
Every signal executed on your own account — on your account, with the plan you define.
CMF calculator
Paste bars as high, low, close, volume and the tool computes each bar's multiplier, the money flow volume, and the CMF over the period, reports the zone and whether it crossed a ±0.05 level on the last bar, and flags when the last three bars disagree with the total — the earliest divergence read. The preloaded sample is an uptrend whose last bars are closing lower in their ranges on rising volume.
CMF versus OBV, VFI, MFI and A/D
| Indicator | What it uses | Horizon | Best at | Where CMF differs |
|---|---|---|---|---|
| CMF | Close position in the bar's range × volume, summed over 20 | Short | Divergence, breakout confirmation | — |
| OBV | Full volume signed by close vs prior close | Cumulative | Long trend confirmation | OBV reads bar-to-bar direction; CMF reads intrabar location |
| VFI | Capped volume on bars that moved past a cutoff, over 130 | Long | Regime | VFI filters and is slow; CMF counts every bar and is fast |
| MFI | Typical price × volume, as an RSI, over 14 | Short | Overbought / oversold | MFI is bounded 0–100 and uses typical price; CMF uses close location and reads pressure, not extremes |
| A/D line | The same multiplier × volume, cumulative | Cumulative | Long divergence | CMF is the A/D line over a rolling window, normalised by volume |
CMF and the A/D line are the same calculation at two horizons; OBV and CMF measure different things and disagree often, which is why a trader running both is usually confused rather than confirmed. Pick CMF for the fast read and VFI for the slow one.
Reference data
| Item | Value |
|---|---|
| Origin | Marc Chaikin, 1980s, building on Larry Williams' close-location concept; oscillator form of the Accumulation/Distribution line |
| Multiplier | ((close − low) − (high − close)) ÷ (high − low), −1 to +1 |
| CMF | Σ (multiplier × volume) over n ÷ Σ volume over n |
| Default period | 20 (21 on some platforms) |
| Levels | ±0.05 pressure; ±0.25 strong (Chaikin) |
| Range | −1 to +1 theoretically; −0.5 to +0.5 in practice |
| Reads as | Volume-weighted close location — intrabar conviction |
| Primary uses | Trend confirmation (sign beyond ±0.05), divergence at turns, breakout volume confirmation |
| Not for | Zero-cross entries in ranges; markets without real volume (spot forex, CFDs) |
| TradingView | Built-in "Chaikin Money Flow" (length 20) |
Worked example: BTCUSDT 4-hour, the divergence and the cross
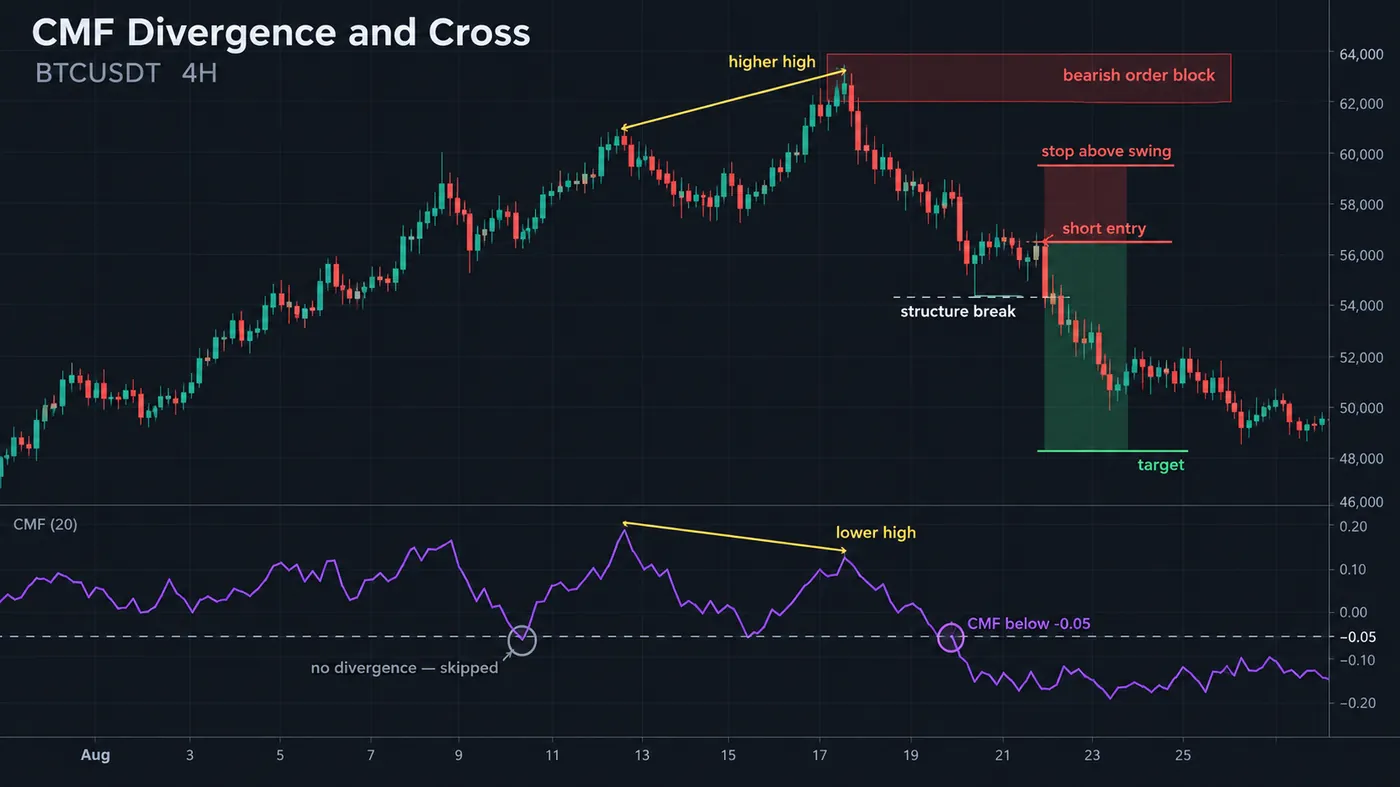
BTCUSDT perpetual, 4-hour chart, CMF at 20. A three-week uptrend with CMF holding between +0.12 and +0.31 the whole way — closes in the upper half of their ranges on rising volume, textbook accumulation. Price made a high at 68,900 with CMF at +0.27. Six bars later it made a higher high at 69,400; CMF printed +0.14. The last two bars into that high were the ones in the calculator's sample: 69,200 with a close at 68,300 on 4,600 volume, and 69,400 closing at 68,620 on 5,200 — multipliers of −0.64 and −0.29 on the two heaviest bars of the month. Divergence, and the higher high sat inside a daily bearish order block at 69,100–69,600.
That was the warning, not the trade. The trade came three bars later: a 4-hour close at 67,850 below the last higher low at 68,000 — a structure break — with CMF at −0.07, its first reading below −0.05 in three weeks. Short at 67,850, stop at 69,450 above the high, 1,600 of risk. Target the origin of the last impulse at 64,200, 3,650 points, 2.3R. Filled four days later.
The skipped trade, same chart, two weeks earlier: CMF dipped to −0.06 for two bars during a pullback in the middle of the trend with no divergence and no structure break, and went back above +0.10 within a day. A cross alone, in a trend, on no divergence, is noise. The divergence at a level plus the structure break is the signal; the CMF cross confirms it.
Where CMF fails
Gaps. A bar that gaps up and closes at its low reads −1 even though price rose; a bar that gaps down and closes at its high reads +1. On stocks around earnings CMF can point the wrong way for days. Read it with the direction of the bars, or use it on 24-hour markets where gaps are rare.
Ranges. The zero cross fires constantly and the ±0.05 band is crossed every few bars. In a range CMF is a divergence tool only, and even the divergences are frequent.
Markets without real volume. Spot forex and CFDs report tick volume; CMF on them is close-location weighted by nothing meaningful. Use futures, exchange-traded stocks and centralised crypto data.
Wide-range bars with mid closes. A huge-range bar that closes in the middle contributes nothing, however much volume it carried. That is by design, but a capitulation bar that closes mid-range can leave CMF oddly neutral at the exact moment the market turned.
Short periods. A 10-period CMF is a two-week window on daily charts and whipsaws through the band constantly. Use it for divergence only.
Mistakes traders make with CMF
- Trading the zero cross. Use ±0.05, and only as confirmation after structure.
- Reading it as direction. CMF measures where bars closed inside their ranges, not whether price went up or down.
- Running it on forex or CFDs. No traded volume, no meaning.
- Ignoring gaps on stocks. A gap-up that closes weak is a −1 bar; decide whether that is what you meant to measure.
- Stacking CMF with OBV as confluence. They disagree by construction; pick one per horizon.
- Expecting it to lead. CMF confirms and diverges; entries come from the chart.
CMF and the free indicators
TradingView's built-in CMF is exact. In the library, the Pressure Oscillator is the closest relative — it reads volume against range from the candle side and flags the absorption bars that CMF scores as mid-range zeros — and the Multi-Oscillator Divergence Scanner catches CMF-style divergences across several oscillators without a fourth pane. The Order Blocks with Volume script supplies the level the divergence should happen at, as in the example above. The premium engine, Zeno, prints buy and sell signals with a stop and targets; a Zeno sell signal at a level where CMF has just diverged is a signal with the volume side already on record.
Where did the bar close, and on how much volume? That is all CMF asks, and it asks it every bar. Use the sign beyond ±0.05 to confirm a trend, the divergence at a level to warn of its end, and the cross below −0.05 (or above +0.05) with a structure break to confirm the turn. Never trade the zero cross, never run it on forex, and let VFI answer the slow question CMF cannot.
◆ Interactive check
Do you know what CMF scores?
Questions traders ask about Chaikin Money Flow
A volume oscillator by Marc Chaikin that measures where each bar closed inside its own range — near the high is +1, near the low −1 — weights that by the bar's volume, sums the result over 20 bars and divides by the total volume over the same 20 bars. Above zero is accumulation in Chaikin's sense, below zero distribution.
Money flow multiplier = ((close − low) − (high − close)) ÷ (high − low). Money flow volume = multiplier × volume. CMF = the sum of money flow volume over n bars ÷ the sum of volume over n bars, with n usually 20. The result runs from −1 to +1 and in practice sits between −0.5 and +0.5.
The default 20 (or 21 — identical in practice) with ±0.05 as the pressure levels and ±0.25 as the strong levels. On 4-hour crypto and index charts 20 to 30 with a ±0.20 strong level; intraday, widen the neutral band to ±0.10 and use a session or VWAP filter. A 10-period CMF is for divergence only.
Sustained readings above +0.05 confirm an uptrend and below −0.05 a downtrend; the band between them is noise. A higher price high with a lower CMF high is distribution and a lower price low with a higher CMF low is accumulation — the divergences are the most useful signal. A breakout with CMF still inside the band is one the volume did not join.
OBV adds a bar's full volume when the close is above the prior close and subtracts it when below — it scores bar-to-bar direction. CMF scores where the bar closed inside its own range and ignores the prior close. A gap-up bar that closes at its low is positive for OBV and −1 for CMF. They measure different things and often disagree.
The same multiplier and money flow volume; the A/D line accumulates it forever, CMF sums it over a rolling window and normalises by volume. CMF is the oscillator form of the A/D line and is easier to compare across instruments.
On 4-hour and daily BTCUSDT and ETHUSDT charts from a major exchange, yes — 24-hour markets have few gaps, which removes CMF's main weakness on stocks. The worked example on this page is a 4-hour BTC top. On thin altcoins and low timeframes it whipsaws.
Not on spot forex or CFDs, which report tick or broker volume rather than traded volume. Use it on currency futures, exchange-traded stocks and ETFs, index futures and centralised crypto data.
Coincident to lagging on the cross, and leading on divergence — a lower CMF high against a higher price high typically appears several bars before structure breaks. Treat the divergence as the warning and the cross as confirmation.
The TradingView built-in is exact. The Pressure Oscillator is the library's closest relative, reading volume against range from the candle side; the Multi-Oscillator Divergence Scanner covers CMF-style divergences across several oscillators; Order Blocks with Volume supplies the level the divergence should happen at. Zeno, the premium engine, prints signals with stops and targets.
References & Related Guides
Read next
- Volume Flow Indicator (VFI)
- On-Balance Volume (OBV)
- Money Flow Index (MFI)
- Twiggs Money Flow
- Best Volume Indicators
- Divergence Trading
- Bull Trap and Bear Trap
- Pressure Oscillator (free indicator)
- Multi-Oscillator Divergence Scanner (free indicator)
- Order Blocks with Volume (free indicator)
- Zeno — the premium engine