McGinley Dynamic: Formula, Settings and How to Trade It
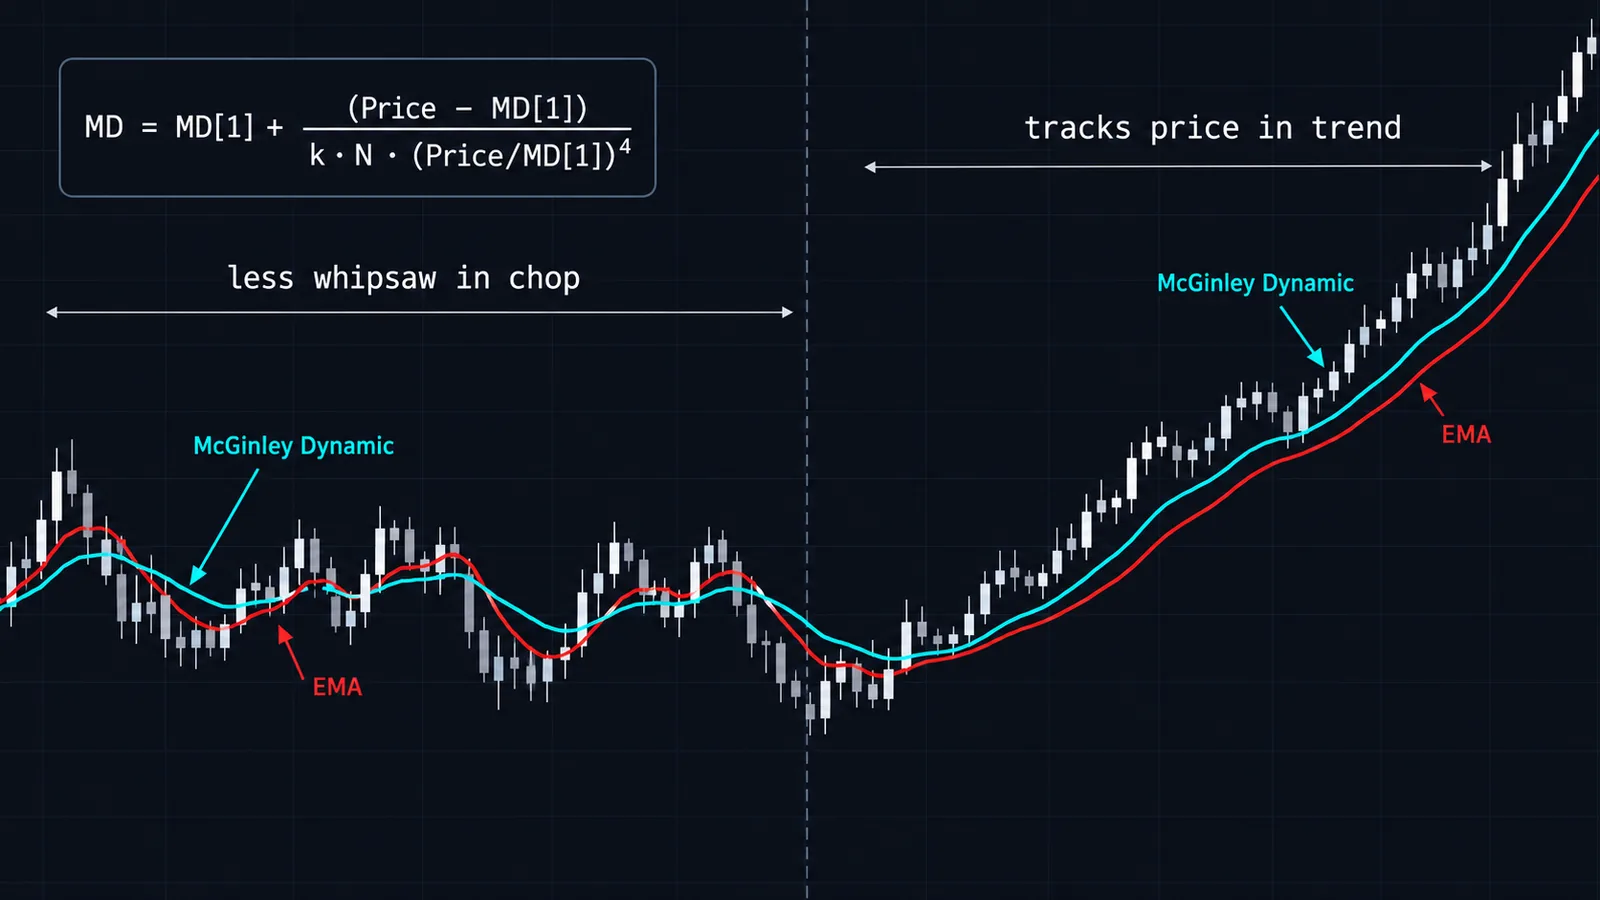
The McGinley Dynamic is an adaptive tracking line created by John R. McGinley. Each bar it moves toward price by (Price − MD) / (k × N × (Price/MD)⁴), so it speeds up when price falls below it and slows down when price runs above it. Most platforms use k = 1; set N to about 60% of your usual EMA length.
The McGinley Dynamic looks like a moving average on the chart, and that is the root of most mistakes people make with it. Its creator built it as a tracking line that changes speed depending on how far price has wandered, and it changes speed differently going up than going down. In this Quantum Algo guide we take the formula apart term by term, settle the k = 0.6 question, measure exactly how much faster it reacts to drops than to rallies, and show how to translate your favourite EMA into a McGinley setting that behaves the way you expect.
Indicators that prove themselves in public.
One engine, four precision tools — the Gold (XAU) Scalper, the institutional Gravity Zone, the Zeno momentum Oscillator, and Zeno Stocks for equities.
What problem was John McGinley trying to solve?
John R. McGinley was a Chartered Market Technician who edited the Market Technicians Association's Journal of Technical Analysis. According to Brian Twomey's March 2010 article in Technical Analysis of Stocks & Commodities, McGinley first published the Dynamic as an outline in that journal in 1991 and followed it with a full study in 1997. Some secondary sources date it to 1990; the 1991 outline and 1997 study are the dates given in the S&C account, which is the closest to a primary source available online.
His complaint about moving averages was specific. A fixed-length average assumes the market moves at a fixed speed. It doesn't. In a fast move the average falls far behind price; in a slow drift it hugs price so closely it gives false crosses. Traders respond by fiddling with the length, which is just guessing at the market's speed after the fact.
McGinley's fix was a line that adjusts its own speed according to how far price has run away from it. He did not pitch it as a better crossover signal. The way he and later writers describe it, the Dynamic is a tracking mechanism: a smoothing line meant to follow price more faithfully than a moving average, with fewer separations and fewer whipsaws. That framing matters, because most of the ways people misuse the McGinley Dynamic come from treating it as just another EMA to cross.
The McGinley Dynamic formula, term by term
The Dynamic is recursive: each new value starts from the previous one and moves a fraction of the way toward price.
MD = MD₁ + (Price − MD₁) / ( k × N × (Price / MD₁)⁴ )
- MD₁ is the previous bar's value of the line.
- Price − MD₁ is the gap between price and the line. Every bar, the line closes part of that gap.
- N is the speed setting. With price sitting on the line, the line closes 1 / (k × N) of the gap per bar.
- (Price / MD₁)⁴ is the adaptive part. When price is above the line the ratio is above 1, the fourth power makes it bigger, the denominator grows, and the step shrinks. When price is below the line the ratio is under 1, the denominator shrinks, and the step grows.
- k is a constant. Here the sources disagree, and it is worth knowing why.
k = 0.6 or k = 1?
Some references write the formula with k = 0.6; the pandas-ta library, for example, exposes it as a multiplier that defaults to 1 and notes that it is "sometimes" set to 0.6. Capital.com, LuxAlgo, WealthCharts and StockSharp all publish the formula with no k at all, which is the same as k = 1, and TradingView's built-in exposes only a length input, so there is no k to set. The two versions are reconciled by McGinley's own guidance, quoted by LuxAlgo and repeated by script authors on TradingView: set N to roughly 60% of the moving average length you would otherwise use. Writing k = 0.6 into the formula simply bakes that 60% in. So:
- k = 1 and N = 12 is identical to k = 0.6 and N = 20.
- If your platform has no k input, you are on k = 1, and you apply the 60% rule by hand.
How the line starts
Because it is recursive, the Dynamic needs a starting value. A TradingView idea published by a user who studied the built-in notes that TradingView uses an EMA as the base for the McGinley line, and most implementations seed with either an EMA, an SMA, or the first close. After a few dozen bars the seed's influence fades, but on a short history, or on a chart where the first bars are far from today's price, a bad seed can leave the line stuck for a while. That is the source of the "flat McGinley" complaint you will see in community scripts.
Why does the McGinley Dynamic speed up when price falls?
It comes straight from the fourth power. Take N = 10, k = 1, and a line sitting at 100.
- Price jumps to 105. The ratio is 1.05, and 1.05⁴ = 1.2155. The step is 5 / (10 × 1.2155) = 0.411. New MD: 100.41.
- Price drops to 95. The ratio is 0.95, and 0.95⁴ = 0.8145. The step is −5 / (10 × 0.8145) = −0.614. New MD: 99.39.
Same 5-point move, but the line reacts 49% more to the drop than to the rally. The table shows the share of the price-to-line gap the line closes in one bar, for different price-to-line ratios.
| Price / MD₁ | Gap closed per bar (N 10, k 1) | Gap closed per bar (N 10, k 0.6) | Reading |
|---|---|---|---|
| 0.70 (price 30% below) | 41.6% | 69.4% | Crash: line drops fast |
| 0.80 | 24.4% | 40.7% | Sharp selloff |
| 0.90 | 15.2% | 25.4% | Pullback |
| 1.00 (on the line) | 10.0% | 16.7% | Behaves like an EMA |
| 1.10 | 6.8% | 11.4% | Rally: line slows |
| 1.20 | 4.8% | 8.0% | Strong rally |
| 1.30 (price 30% above) | 3.5% | 5.8% | Parabolic: line nearly freezes |
The usual explanation is that markets fall faster than they rise, so a tracking line should drop quickly to stay with a selloff and rise cautiously so it doesn't chase a spike. That fits equity indexes reasonably well. It fits less well in markets without that skew, such as FX pairs, where "down" for EURUSD is "up" for USDEUR. Flip the chart and the Dynamic's behaviour flips with it. That alone tells you the asymmetry is a design choice, not a law of markets.
One more thing the table makes clear: the Dynamic adapts to distance, not to volatility. A quiet market that drifts 10% above the line slows it down just as much as a violent one. Calling it "volatility-adjusted", as many summaries do, is not accurate.
Worked example: nine bars, three lines
Here is a short rally and selloff, with the line seeded at the first close of 100. We compare the Dynamic with N = 10 at k = 1 (TradingView style), at k = 0.6, and a 10-period EMA seeded the same way.
| Bar | Close | MD (N 10, k 1) | MD (N 10, k 0.6) | EMA 10 |
|---|---|---|---|---|
| 0 | 100 | 100.00 | 100.00 | 100.00 |
| 1 | 102 | 100.19 | 100.31 | 100.36 |
| 2 | 104 | 100.51 | 100.84 | 101.02 |
| 3 | 107 | 101.02 | 101.65 | 102.11 |
| 4 | 110 | 101.66 | 102.66 | 103.55 |
| 5 | 108 | 102.16 | 103.39 | 104.36 |
| 6 | 103 | 102.24 | 103.33 | 104.11 |
| 7 | 98 | 101.74 | 102.23 | 103.00 |
| 8 | 95 | 100.85 | 100.61 | 101.54 |
Two bars by hand, using k = 1:
- Bar 1: ratio 102 / 100 = 1.02; 1.02⁴ = 1.0824; denominator 10 × 1.0824 = 10.824; step 2 / 10.824 = 0.185. MD = 100.185.
- Bar 7: previous MD 102.237, close 98. Ratio 0.9586; to the fourth power 0.8443; denominator 8.443; gap −4.237; step −0.502. MD = 101.735.
What to notice:
- During the rally (bars 1 to 4) both McGinley lines lag the EMA, and the k = 1 line lags badly. When price is far above it, the line deliberately slows down.
- During the drop (bars 6 to 8) the k = 0.6 line falls 2.71 points in two bars, more than the EMA's 2.57, and finishes below the k = 1 line after sitting above it for the whole rally. That is the downside acceleration at work.
- The k = 1 line with N = 10 is slower than EMA 10 almost everywhere. It is not an error: on the line, it closes 10% of the gap per bar, the same as an EMA(19). Which brings us to choosing N.
Paste your own closes into the calculator below to see the latest value, how much of the gap the last bar closed, and the EMA that matches its flat-market speed.
How fast does it catch a move? Step-response numbers
The cleanest way to see the asymmetry is to hit each line with an instant price jump and count how many bars it takes to cover half the distance. Start every line at 100, move price to the new level and hold it there.
| Price jump | MD N 10, k 0.6 | MD N 10, k 1 | EMA 10 | EMA 20 |
|---|---|---|---|---|
| +10% | 6 bars | 9 bars | 4 bars | 7 bars |
| −10% | 3 bars | 5 bars | 4 bars | 7 bars |
| +30% | 9 bars | 15 bars | 4 bars | 7 bars |
| −30% | 1 bar | 2 bars | 4 bars | 7 bars |
An EMA takes the same number of bars regardless of direction or size; it has no idea how far away price is. The Dynamic takes nine times longer to cover half of a 30% gap up than half of a 30% gap down at k = 0.6. On a stock that gaps 30% higher on earnings, an EMA 10 will be halfway there in four bars; the McGinley line will still be crawling for two weeks of daily bars. Whether that is a feature (it refuses to chase a spike) or a bug (it leaves you with a stop miles below price) depends on what you are using the line for.
How to choose N: the 60% rule and settings by timeframe
Because N in the Dynamic and N in an EMA mean different things, the first job is translation. When price sits on the line, the Dynamic closes 1 / (k × N) of the gap per bar. An EMA of length M closes 2 / (M + 1). Set them equal and you get:
Equivalent EMA length ≈ 2 × k × N − 1
So McGinley N = 10 at k = 1 behaves like an EMA(19) near the line, and at k = 0.6 like an EMA(11). Flip it around: to replace an EMA you already use, set N to about 60% of that EMA's length with k = 1 (or N equal to the EMA length with k = 0.6). This is exactly McGinley's 60% guidance, and the arithmetic shows it gets you close to the EMA's speed in quiet conditions, then lets the line adapt when price runs.
| Style / timeframe | EMA you might be using | McGinley N at k = 1 | Typical use |
|---|---|---|---|
| Scalping, 1–5 min | EMA 9–13 | 6–8 | Short-term trend side; very noisy below 6 |
| Day trading, 15 min–1 h | EMA 20–21 | 12–13 | Pullback line, trailing reference |
| Swing, 4 h–daily | EMA 34–50 | 20–30 | Trend filter and dynamic support |
| Position, daily–weekly | EMA 100–200 / 40-week | 60–120 | Regime line; changes direction rarely |
Treat those as starting points, not answers. The Dynamic's character depends on how far your instrument typically strays from its average, so a setting that is calm on EURUSD can be twitchy on a small-cap stock. Avoid very small values of k × N. Below about 3, a sharp drop can make the step larger than the gap itself, and the line overshoots below price. The calculator warns you when that happens.
How to set up the McGinley Dynamic on TradingView
TradingView ships the McGinley Dynamic as a built-in indicator, documented in its Help Center.
- Click Indicators on the top toolbar and search McGinley Dynamic. Add the built-in version (it overlays the price pane).
- Open settings. There is a single Length input. Enter about 60% of the EMA length you would normally use, from the table above.
- Style it as a thick line in a colour that contrasts with your candles. Because it adapts, the line will sometimes look oddly flat during rallies; that is expected.
- For alerts, use Add alert with the condition "Crossing" between the close and the McGinley line, triggered once per bar close.
- Load enough history. The line is recursive, so on a freshly loaded chart with few bars the seed still matters. Scroll back or use a longer timeframe range before trusting the first visible values.
If you want the k = 0.6 variant or a different seed, it takes a few lines of Pine. The core update is md := md[1] + (src - md[1]) / (k * n * math.pow(src / md[1], 4)), with md seeded from ta.ema(src, n) on the first bar where the previous value is missing. Guard against zero or negative prices before the division. For layout, alerts and Pine basics, see our TradingView platform guide.
How do traders actually use the McGinley Dynamic?
1. As a trend side, not a trigger
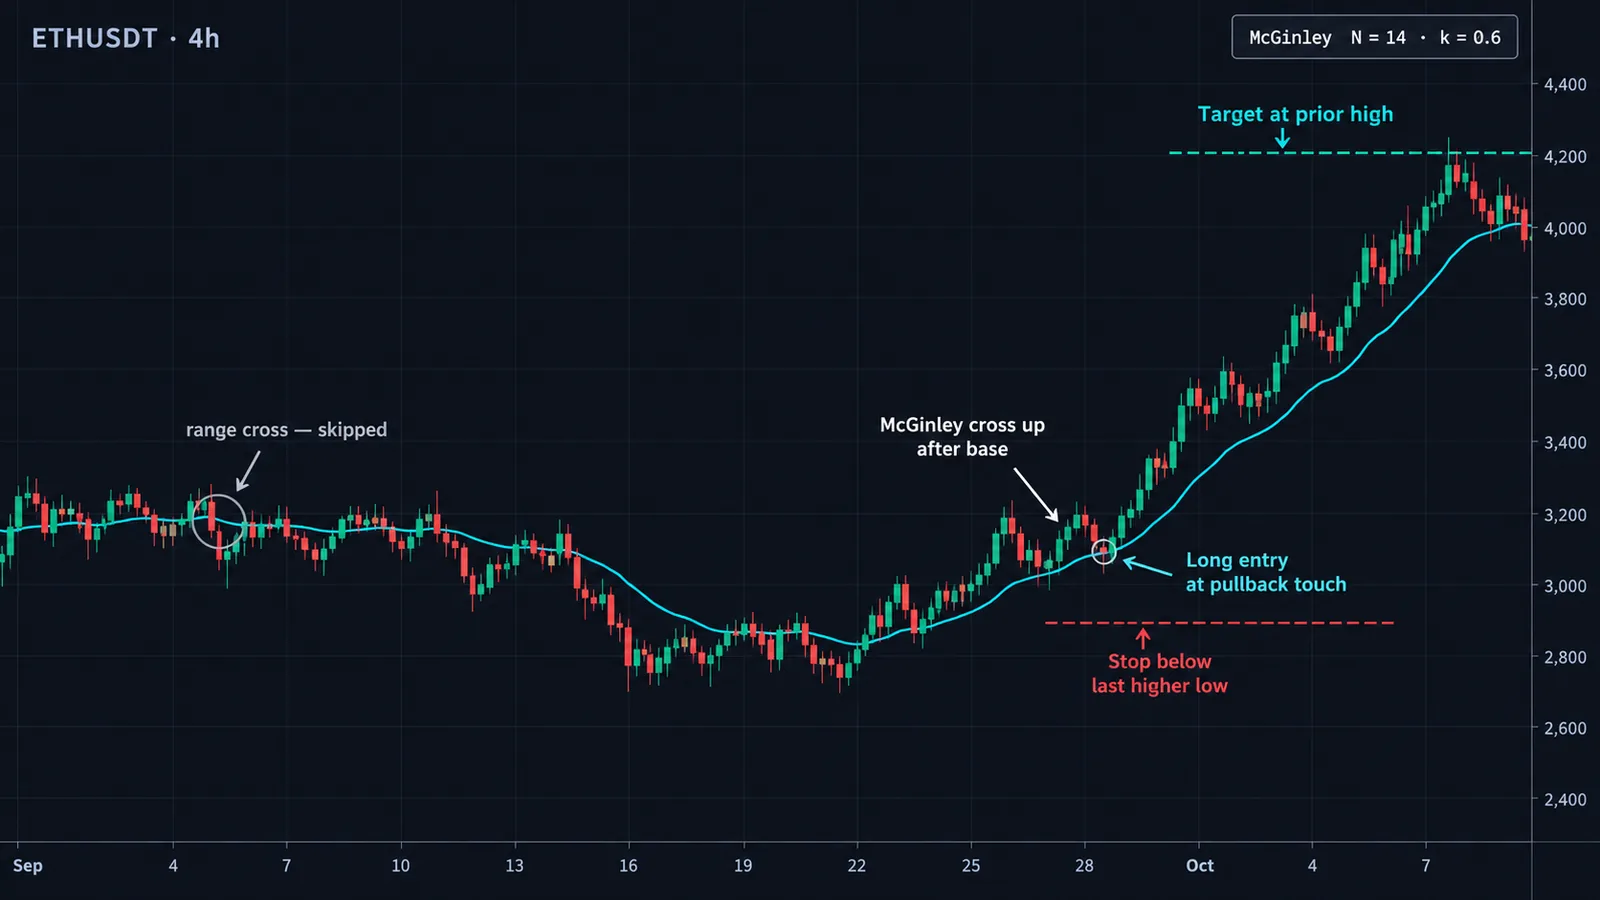
The simplest and most defensible use: above a rising McGinley line, look only for longs; below a falling one, only shorts. Because the line drops quickly on selloffs, it tends to flip bearish sooner than an EMA at a matching speed, which some swing traders like as an early warning on equity indexes.
2. As a pullback zone
In a steady trend the line acts as a floor (or ceiling) that price returns to. A practical entry: price pulls back to within 0.5 ATR of a rising McGinley line, then prints a bullish close back away from it. Stop below the pullback low; target the prior swing high, then trail.
Example: a stock trends up with the McGinley (N 20) at 48.60 and ATR at 1.10. Price dips to 48.95, within half an ATR, then closes at 49.70. Entry 49.70, stop below the pullback low at 48.80, risk 0.90 per share. Prior high at 51.50 gives 1.80 of reward, so 2R. On a $25,000 account risking 0.5% ($125), that is 138 shares.
3. As a trailing reference
Because it slows down when price runs away, the line makes a patient trailing stop in strong rallies: it will not stop you out on the first shakeout. The flip side is that after a parabolic leg the line can be so far below price that a stop there gives back most of the move. Many traders switch to a tighter, volatility-based trail once price is more than about 3 ATR above the line, such as a Chandelier Exit or a Supertrend.
4. Matching it to the market
The faster-down design suits stock indexes best, because their selloffs are typically sharper than their rallies; on the S&P 500 or Nasdaq futures the line tends to roll over sooner than an EMA of matching speed when a heavy down day arrives. On major FX pairs the edge is weaker, since the base and quote currencies are interchangeable and the asymmetry is arbitrary; consider a slightly longer N there so one-sided spikes carry less weight. In crypto, where rallies of 30% or more happen, expect the line to fall far behind in up-legs and use it more as a regime line on the daily chart than as a stop on intraday charts. For futures more broadly, our best indicators for futures trading guide covers what tends to pair well with a tracking line.
5. Crossovers, with care
Price-crosses-line signals work as well as they do for any average, which is to say they are fine in trends and poor in ranges. The Dynamic reduces but does not remove whipsaw. If you trade crosses, add a regime filter: an ADX reading above 20–25, or a statistical regime test such as the Hurst exponent.
McGinley Dynamic vs EMA, KAMA and ALMA
Three other lines get compared with the Dynamic most often. They solve the lag problem in different ways.
| Line | How it adapts | Memory | Direction-symmetric? | Best at |
|---|---|---|---|---|
| EMA | Does not adapt; fixed smoothing | Recursive, infinite | Yes | Simple, predictable reference |
| McGinley Dynamic | Speed changes with price-to-line distance (fourth power) | Recursive, infinite | No: faster down, slower up | Tracking price without chasing spikes |
| KAMA | Speed changes with the efficiency ratio (net move vs total path) | Recursive, infinite | Yes | Going flat in chop, waking up in trends |
| ALMA | Does not adapt; Gaussian-weighted window | Fixed window | Yes | Smoothest line at a given lag |
The most useful contrast is with the Kaufman Adaptive Moving Average. KAMA asks "is the market moving efficiently?" and slows down in noisy, back-and-forth conditions. The Dynamic asks "how far is price from me?" and slows down when price runs away upward. In a choppy range KAMA flattens out; the Dynamic keeps oscillating around price because the price-to-line ratio stays near 1, where it behaves like an ordinary EMA. If whipsaw in ranges is your main problem, KAMA is the more direct fix.
Against the ALMA indicator, the difference is memory and shape. ALMA only sees its window and never adapts, but it is very smooth at any given lag. The Dynamic remembers everything and adapts, but its line can look lumpy as the step size changes. For broader context on the whole family, our moving averages guide and Hull Moving Average guide cover the remaining low-lag options. If you are interested in a more formal adaptive filter, the Kalman filter takes the "track the true price" idea further with an explicit noise model.
Common mistakes and where the McGinley Dynamic breaks
- Copying EMA lengths. Typing 20 because you use a 20 EMA gives you a line that behaves like an EMA(39) at k = 1. Translate with the 60% rule.
- Parabolic rallies. With price 30% above the line, the step drops to 3.5% of the gap per bar at N = 10. During a blow-off move in a small cap or a cryptocurrency, the line can sit so far below price that it is useless as a stop or as support.
- Overshooting with tiny settings. When k × N is small and price collapses, the step can exceed the gap. At k × N = 2, a 40% one-bar drop overshoots: the formula moves the line almost four times the gap and below zero. Keep k × N above about 3 on anything that can gap.
- Zero and negative prices. The ratio Price / MD₁ breaks at zero and becomes meaningless below it. Spread charts, some synthetic instruments and, famously, front-month crude oil futures in April 2020 have printed negative values. Use another average there.
- Short history and seed effects. On a chart with little history, the line can sit flat or far from price until the seed washes out. Community scripts such as "McGinley Dynamic Fixed" exist purely to skip early bars for this reason.
- Treating it as volatility-adaptive. It adapts to distance and direction only. A slow, steady grind away from the line slows it exactly as much as a violent spike of the same size.
- Using it alone for entries. McGinley designed it as a tracking line. Signals need context: market structure, momentum, or a separate trigger. Our indicator combination guide shows how to pair a trend line with non-overlapping tools.
- Assuming the asymmetry suits every market. The faster-down behaviour reflects equity-style crash risk. On an inverted chart, or a market that squeezes higher violently, it works against you.
McGinley Dynamic and Quantum Algo
The McGinley Dynamic is a good answer to one question: where is the "fair" tracking price right now, without letting one spike drag it around? It is not a complete system, and it says nothing about where to place a stop or a target. Use it as context and let something else handle the trade.
With QuantumAlgo's Zeno suite, a sensible split is to use a McGinley line on your timeframe as the trend side and take only Zeno buy or sell signals that agree with it; Zeno supplies the entry, stop and targets. On index futures, Zeno Stocks covers NAS100 and SPX500, where the Dynamic's faster-down behaviour also suits the market's crash-prone skew. You can review how the signals have performed on the public track record, and see plans on the pricing page.
On the free side, the open-source Adaptive Trend Sentinel and Directional Strength Index are natural companions: one gives an adaptive trend reading, the other tells you whether the trend has the strength to follow the line. The free Academy walks through the trend-following fundamentals behind all of this.
◆ Interactive check
How well do you know the McGinley Dynamic?
Questions traders ask about the McGinley Dynamic
It is an adaptive tracking line created by John R. McGinley that adjusts its speed according to how far price is from the line. It slows down when price runs above it and speeds up when price falls below it, aiming to follow price with fewer separations than a moving average.
MD = MD₁ + (Price − MD₁) / (k × N × (Price/MD₁)⁴), where MD₁ is the previous value and N is the length. Most platforms, including TradingView, use it without k, which is the same as k = 1; some references use k = 0.6.
John R. McGinley, a Chartered Market Technician and former editor of the MTA's Journal of Technical Analysis. It was outlined in that journal in 1991 with a full study in 1997, according to Stocks & Commodities; some sources date it to 1990.
Start from the EMA length you already use and take about 60% of it with k = 1. For example, a 20 EMA becomes N = 12, and a 50 EMA becomes N = 30. Then check it on your instrument and timeframe.
It is different rather than better. It avoids chasing spikes and drops faster in selloffs, but it lags badly in strong rallies and needs its length translated, since N = 10 behaves like an EMA(19) at k = 1.
Yes. It is a built-in indicator; search McGinley Dynamic in the Indicators dialog. It has a single Length input, so apply the 60% rule by hand.
No. Values on closed bars do not change. The value for the forming bar moves with live price until the bar closes, and on short histories the starting seed can affect early values.
Usually because price has run far above it, which shrinks the step to a few percent of the gap per bar, or because the chart has too little history and the seed has not washed out yet.
KAMA is usually better in ranges because it slows down when price movement is inefficient. The McGinley Dynamic behaves like an ordinary EMA when price oscillates around it, so it still whipsaws.
Yes, as a patient trailing reference in trends, since it will not chase short spikes. After a parabolic leg it can sit far below price, so many traders switch to a tighter volatility-based trail at that point.
References & Related Guides
Read next
- Kaufman Adaptive Moving Average (KAMA)
- Moving Averages
- Hull Moving Average
- Supertrend Indicator
- Chandelier Exit
- What Are the Best Indicators for Swing Trading?
- TradingView
- ATR
- What Is the Best Indicator for S&P 500 (SPX500)?
- What Are the Best Indicators for Futures Trading?
- Free TradingView indicators
- Zeno — the premium engine
Primary sources
- Traders.com — Forex Focus: The McGinley Dynamic (Brian Twomey, S&C, March 2010)
- Stocks & Commodities Store — V. 28:3 The McGinley Dynamic by Brian Twomey
- TradingView Help Center — McGinley Dynamic
- LuxAlgo Library — McGinley Dynamic
- Capital.com — McGinley Dynamic indicator
- TradingView — Using delayed McGinley Dynamic seeding to chart parabolics