ALMA Indicator: Arnaud Legoux Moving Average Explained
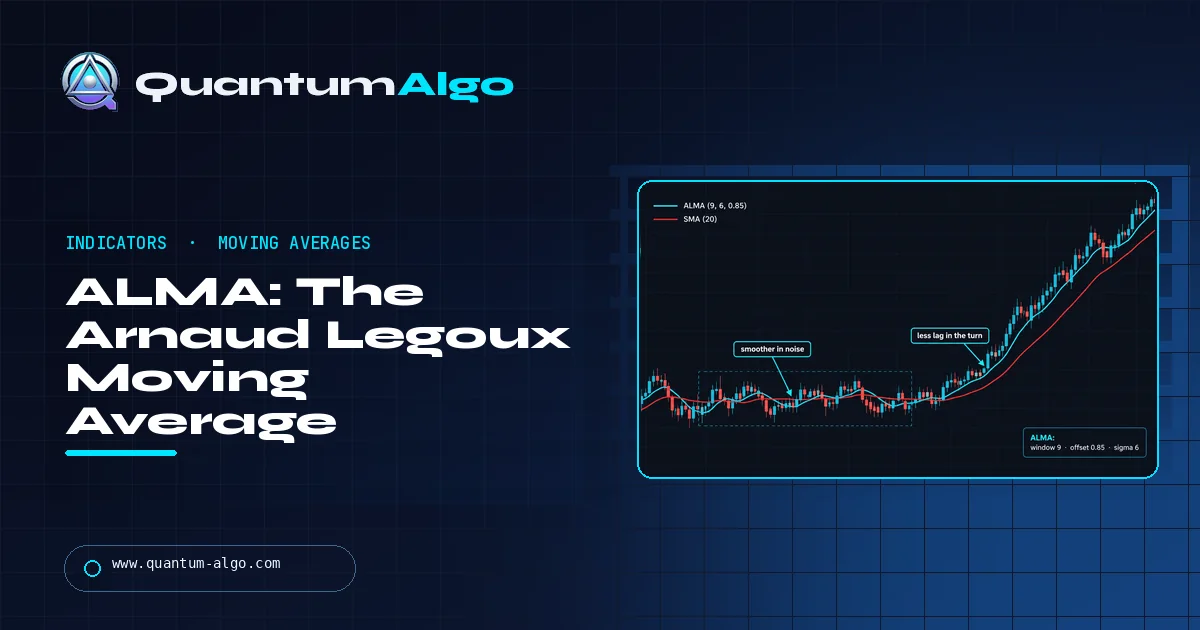
The ALMA indicator (Arnaud Legoux Moving Average) is a moving average that weights the last N bars with a Gaussian bell curve. Offset (default 0.85) moves the bell's peak toward recent bars to cut lag, and sigma (default 6) sets how narrow it is. At equal lag it produces a smoother line than an SMA or EMA.
Most traders meet the ALMA indicator as a line that hugs price better than an EMA, and stop there. That comparison is misleading: a default ALMA(9) lags about as much as a 4-bar average, so of course it looks fast. This Quantum Algo guide does the work the usual explainers skip. We compute the weights by hand, measure what offset and sigma really do to lag and noise, run a lag-matched test against the SMA and EMA, and translate it all into settings you can use on TradingView today.
Indicators that prove themselves in public.
One engine, four precision tools — the Gold (XAU) Scalper, the institutional Gravity Zone, the Zeno momentum Oscillator, and Zeno Stocks for equities.
Where did the ALMA indicator come from?
The Arnaud Legoux Moving Average was built by Arnaud Legoux and Dimitrios Kouzis-Loukas and released around 2009. TradingView's own help page credits both men (it spells the second surname "Douzis-Loukas") and says Legoux was heavily inspired by the Gaussian filter, the same bell-curve smoothing used in image processing and signal work. He liked to measure ALMA against the Hull Moving Average, which he considered the benchmark for a fast but clean line, and claimed ALMA beat it on smoothness.
The problem they were attacking is the oldest one in technical analysis. A simple moving average is smooth but late. An exponential average is earlier but jittery, because it hands the full weight jump to whatever the latest bar did. Every "low-lag" average since the 1990s tries to sit somewhere better on that trade-off curve. ALMA's answer was to stop using a linear or exponential weighting shape and use a bell curve instead, then let the trader slide that bell along the window.
That is the whole idea in one sentence: ALMA is a weighted moving average whose weights follow a Gaussian curve, and you choose where the curve peaks (offset) and how wide it is (sigma). Everything else in this guide is detail about what those two dials actually do, because most explanations of them online are vague or flat wrong.
What is the exact ALMA formula?
TradingView implements ALMA as the built-in function ta.alma(series, length, offset, sigma, floor). The reference shows the equivalent Pine logic, which boils down to four lines of math for a window of N bars:
m = offset × (N − 1)
s = N / sigma
w(i) = exp( −(i − m)² / (2 × s²) ), i = 0 … N−1
ALMA = Σ w(i) × price(i) / Σ w(i)
Three details matter more than they look.
- Index direction. In the Pine reference loop, weight i = 0 is applied to the oldest bar in the window and i = N − 1 to the current bar. So an offset of 0.85 puts the bell's peak 85% of the way toward the present. Offset 0.5 centres it, which turns ALMA into a symmetric Gaussian smoother with the same lag as an SMA. Offset 0 would put the peak on the oldest bar, which nobody wants.
- Sigma works backwards from intuition. The bell's width is s = N / sigma. A bigger sigma makes s smaller, so the bell gets narrower and spikier. A smaller sigma flattens it toward an SMA. Several popular explainers state the opposite.
- The floor argument. ta.alma has an optional fifth argument,
floor, default false. When true, the offset position is rounded down to a whole bar before the weights are built, so the peak lands exactly on a bar instead of between two bars. It changes values slightly; leave it off unless you are matching another platform.
Two common descriptions are worth correcting. ALMA is not recursive: unlike an EMA, it only looks at the last N bars, so a price spike from 50 bars ago has zero influence on ALMA(9). And despite some write-ups describing a "left to right, then right to left" pass, the function TradingView ships is one forward weighted sum. That also means ALMA does not repaint on closed bars. Its last value moves while the current candle is still forming, like every average that includes the live close, and is fixed once the bar closes. If repainting is a concern in your stack, our non-repaint indicators guide covers how to test for it.
Worked example: ALMA weights by hand
Five bars is short enough to do on paper and long enough to show the quirk that surprises most traders. Use N = 5, offset 0.85, sigma 6, and closes (oldest to newest) of 50, 51, 53, 52, 55.
- Peak position: m = 0.85 × (5 − 1) = 3.4. The bell peaks between bar 3 (one bar ago) and bar 4 (the current bar), closer to bar 3.
- Width: s = 5 / 6 = 0.833, so 2s² = 1.389.
- Raw weights: for each i, compute exp(−(i − 3.4)² / 1.389).
- Normalize: divide each raw weight by their sum, 1.9228.
- Weighted sum: multiply each close by its normalized weight and add.
| Bar (i) | Close | (i − m)² | Raw weight | Normalized | Close × weight |
|---|---|---|---|---|---|
| 0 (oldest) | 50 | 11.56 | 0.0002 | 0.0001 | 0.006 |
| 1 | 51 | 5.76 | 0.0158 | 0.0082 | 0.419 |
| 2 | 53 | 1.96 | 0.2439 | 0.1268 | 6.722 |
| 3 | 52 | 0.16 | 0.8912 | 0.4635 | 24.101 |
| 4 (current) | 55 | 0.36 | 0.7717 | 0.4013 | 22.072 |
| Total | 1.0000 | 53.32 | |||
ALMA(5) prints 53.32. The 5-bar SMA of the same closes is 52.20, and a 5-bar EMA seeded at 50 sits at 52.65. ALMA is closest to price, as advertised.
Now look at where the weight went. The bar before the current one carries 46.4% of the average and the current bar only 40.1%. With default settings ALMA never puts its maximum weight on the live candle. On the standard 9-bar setting the split is even more pronounced: the weights from oldest to newest are 0.000, 0.000, 0.002, 0.012, 0.053, 0.148, 0.263, 0.301, 0.220. The peak sits 1.2 bars back, and the current bar gets 22%. That small delay is deliberate. It is what keeps ALMA from twitching on every tick, and it is why ALMA looks calmer than an EMA that is technically "faster". You can check any combination yourself in the calculator below; it prints the full normalized weight list next to the result.
How do offset and sigma change lag and smoothness?
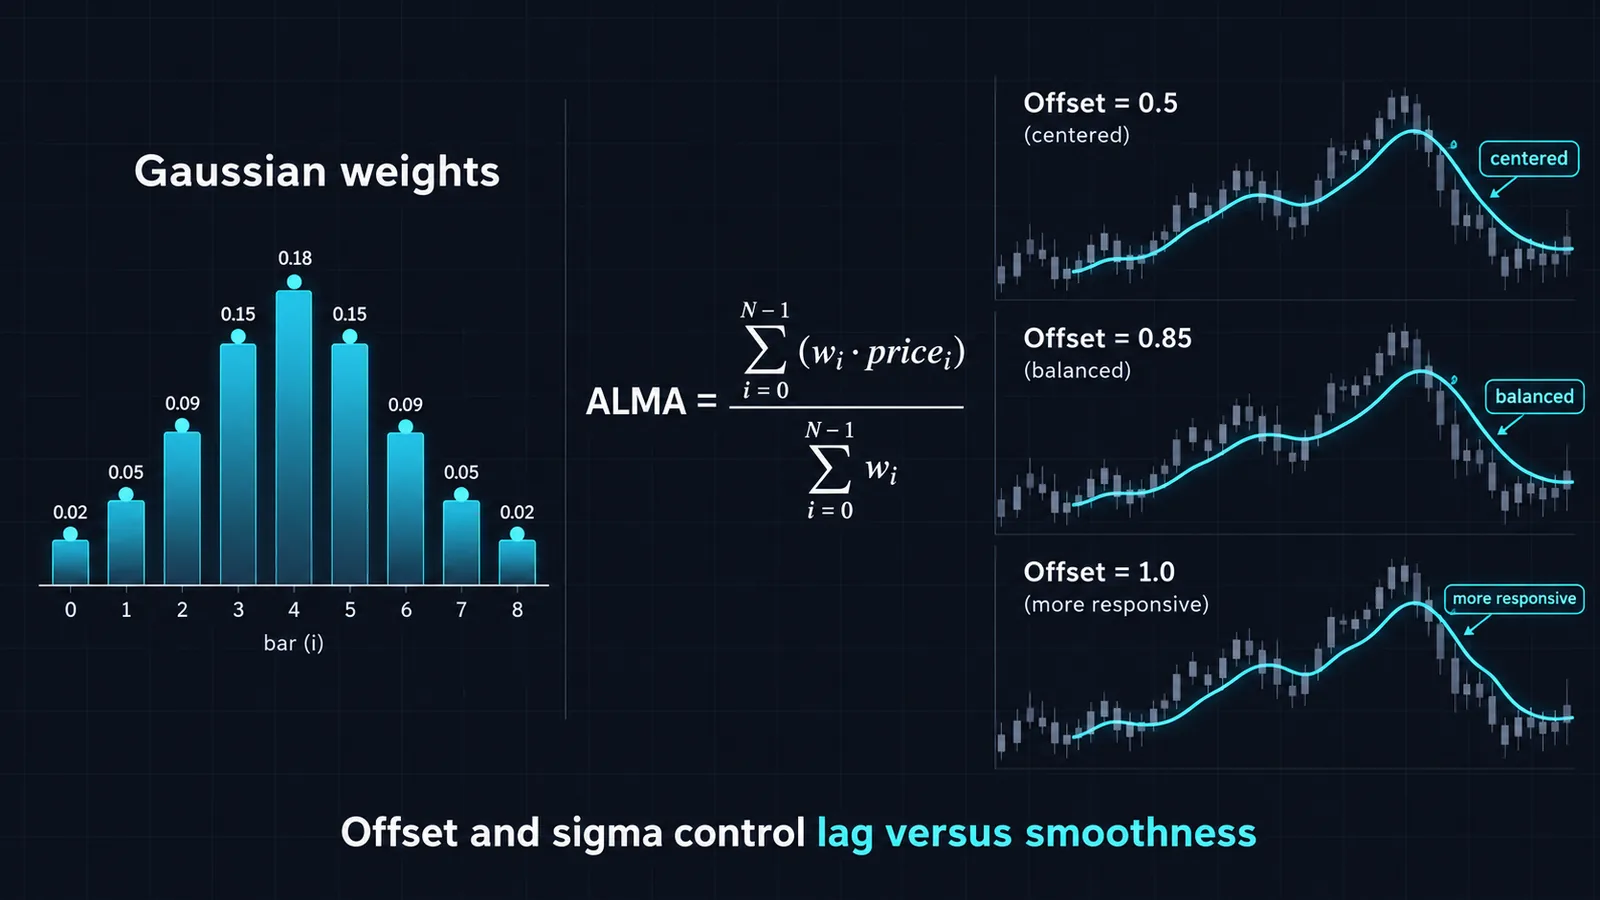
The cleanest way to compare settings is with two numbers you can compute from the weights alone, no chart required.
- Effective lag is the weighted average age of the bars in the window, in bars. An SMA(9) has a lag of 4 bars, and so does an EMA(9).
- Noise passed is the sum of the squared weights. It tells you what fraction of random bar-to-bar noise survives into the line. Raw price is 1.0; lower means smoother.
| Setting (N / offset / sigma) | Weight on current bar | Effective lag (bars) | Noise passed |
|---|---|---|---|
| SMA 9 (reference) | 11% | 4.00 | 0.111 |
| ALMA 9 / 0.50 / 6 | 0.8% | 4.00 | 0.189 |
| ALMA 9 / 0.85 / 6 (default) | 22% | 1.56 | 0.233 |
| ALMA 9 / 0.95 / 6 | 35% | 1.09 | 0.287 |
| ALMA 9 / 1.00 / 6 | 42% | 0.91 | 0.323 |
| ALMA 9 / 0.85 / 3 | 17% | 2.56 | 0.148 |
| ALMA 9 / 0.85 / 10 | 19% | 1.25 | 0.328 |
Read the table in two directions.
Offset is the lag dial. Moving it from 0.85 to 0.95 cuts lag by about half a bar and raises noise by roughly a quarter. Push it to 1.0 and the bell's peak sits on the live bar: lag under one bar, but a line that wobbles almost as much as a 3-bar SMA. Pull it down to 0.5 and you get a centred Gaussian with exactly the SMA's lag, which is pointless for trading but useful for smoothing a closed historical series.
Sigma is the shape dial. Dropping sigma to 3 widens the bell. More bars contribute, noise falls by a third, and lag rises by a full bar. Raising sigma to 10 narrows the bell so that two or three bars carry almost everything; lag improves slightly but noise jumps. Past roughly sigma 8 on a 9-bar window you are no longer averaging, you are just reading the last couple of closes.
Is ALMA really smoother than an EMA? A lag-matched test
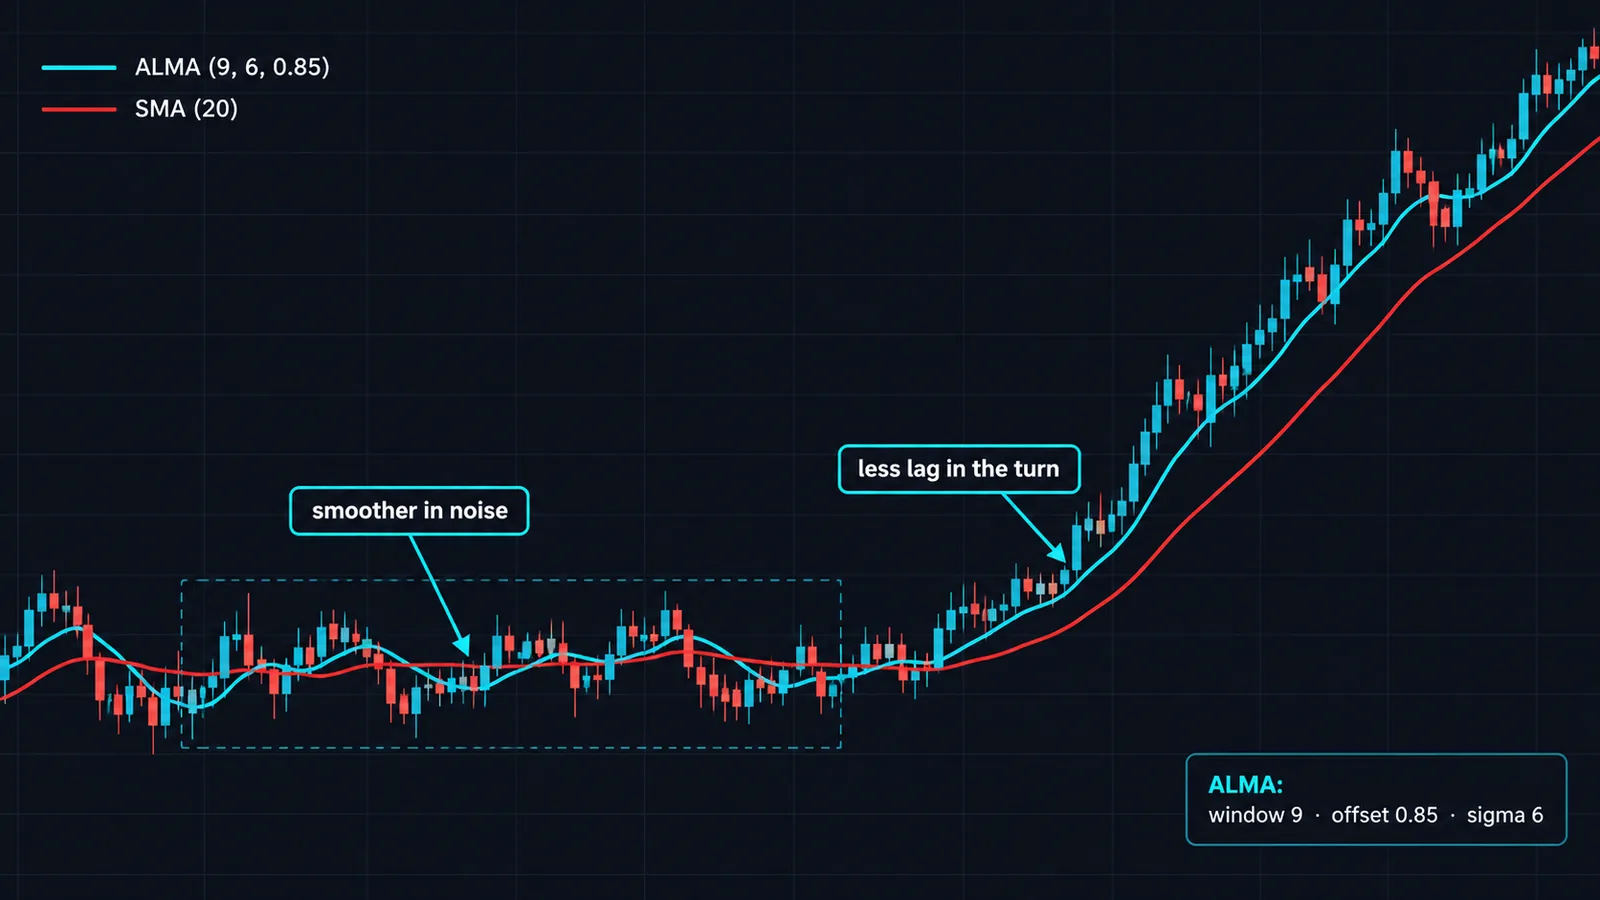
Most comparisons put ALMA(9) next to EMA(9), see that ALMA hugs price more closely, and declare a winner. That is not a fair fight. From the table above, ALMA(9) with default settings has about the same lag and noise as a 4-bar SMA (lag 1.5, noise 0.25). Of course it hugs price. So does any 4-bar average.
The fair question is: at the same lag, is ALMA smoother? To answer it we ran 200,000 bars of synthetic random noise through three filters tuned to the same 4-bar lag, then measured how much each line moved from one bar to the next (its "jitter"). Same exercise again at a 10-bar lag.
| Filter | Effective lag | Bar-to-bar jitter | vs. ALMA |
|---|---|---|---|
| EMA 9 | 4.0 | 0.211 | +95% |
| SMA 9 | 4.0 | 0.157 | +45% |
| ALMA 21 / 0.85 / 6 | 4.0 | 0.108 | baseline |
| SMA 21 | 10.0 | 0.067 | +60% |
| ALMA 50 / 0.85 / 6 | 9.9 | 0.042 | baseline |
Here ALMA earns its reputation. At equal lag, its line moves about 31% less per bar than an SMA and roughly half as much as an EMA. The total amount of noise it lets through is only a few percent lower than the SMA's; the gain is in how it lets noise through. The bell shape has no hard edges, so a bar entering or leaving the window does not kick the line the way it kicks an SMA, and the latest bar does not yank it the way it yanks an EMA. The practical result is fewer tiny direction flips, which is exactly what you want from a line you use to define trend direction.
The flip side is the lesson most traders miss. ALMA lengths are not interchangeable with EMA lengths. ALMA(21) lags like a 9-bar SMA, not like a 21 EMA. If you are replacing a 21 EMA in a system, an ALMA near 50 matches its lag (about 10 bars) while giving you a visibly calmer line. Swap "ALMA 21 for EMA 21" and you have quietly made your system twice as fast, with all the extra whipsaw that comes with it.
What are the best ALMA settings by timeframe?
There is no magic set, and nobody has published credible evidence that one ALMA setting beats another across markets. What you can do is choose a length by the lag you want, then sanity-check it on your instrument. These are reasonable starting points, all with sigma 6.
| Style / timeframe | Fast line | Slow line or filter | Offset | Notes |
|---|---|---|---|---|
| Scalping, 1–5 min | ALMA 9 | ALMA 34 | 0.85 | Session opens produce gaps in volatility; expect whipsaw in the first minutes. |
| Day trading, 15 min–1 h | ALMA 21 | ALMA 50 | 0.85 | The 50 lags like a 21 EMA, a familiar day-trading filter. |
| Swing, 4 h–daily | ALMA 21 | ALMA 100 | 0.85 | ALMA 100 lags about 20 bars, similar to a 41 EMA. |
| Position, daily–weekly | ALMA 50 | ALMA 200 | 0.80–0.85 | Lower offset trades a bar or two of lag for a quieter regime line. |
| Crypto, 24/7 | Same as above | Same as above | 0.85 | No session gaps, but weekend liquidity is thin; consider higher timeframes. |
Two adjustments worth making. On instruments that gap a lot at the open (single stocks, index futures on Sunday), a short ALMA will chase the gap and then snap back; lengthen it or check the line against a higher timeframe. On very smooth instruments such as major FX pairs on higher timeframes, you can afford an offset of 0.9 because there is less noise to amplify. For a broader view of how averages fit into a day-trading toolkit, see our best indicators for day trading roundup, and the swing trading equivalent for daily charts.
How do you trade an ALMA crossover?
The classic ALMA crossover uses two lines and trades the direction of the faster one relative to the slower one. ALMA's calm shape helps here: fewer micro-crosses in a sideways patch than the same pair of EMAs at equal lag.
A simple, testable version
- Lines: ALMA 21 and ALMA 50 (both 0.85 / 6) on the 1-hour chart.
- Long trigger: ALMA 21 closes above ALMA 50 and ALMA 50 is higher than it was 5 bars ago. The slope condition throws out crosses that happen while the slow line is still falling, which are the main source of chop losses.
- Entry: next bar's open, or a pullback into ALMA 21 within the next 3 bars.
- Stop: below the most recent swing low, or 1.5 × ATR below entry, whichever is tighter but outside normal noise.
- Exit: the opposite cross, or a trailing stop at ALMA 50.
Example in numbers: ALMA 21 crosses above ALMA 50 at 1.0850 on EURUSD, ALMA 50 is 12 pips higher than five bars ago, and ATR(14) is 18 pips. Entry 1.0852, stop at 1.0852 − 27 pips = 1.0825. Risk 27 pips. With 0.5% of a $20,000 account at risk ($100), position size is $100 / 27 pips ≈ $3.70 per pip, about 0.37 standard lots. The first target at 2R is 1.0906.
Price-cross variant
The more aggressive version trades the close crossing a single ALMA. It reacts faster but fires constantly in ranges. If you use it, require the close to be beyond the line by at least a fraction of ATR, or require two consecutive closes on the same side. Either rule cuts the number of signals sharply in a flat market without costing much in a trend.
Whatever version you pick, test it before you trust it. A few weeks of paper trading on the exact instrument and timeframe will tell you more than any backtest of someone else's settings.
Using ALMA as a trend filter
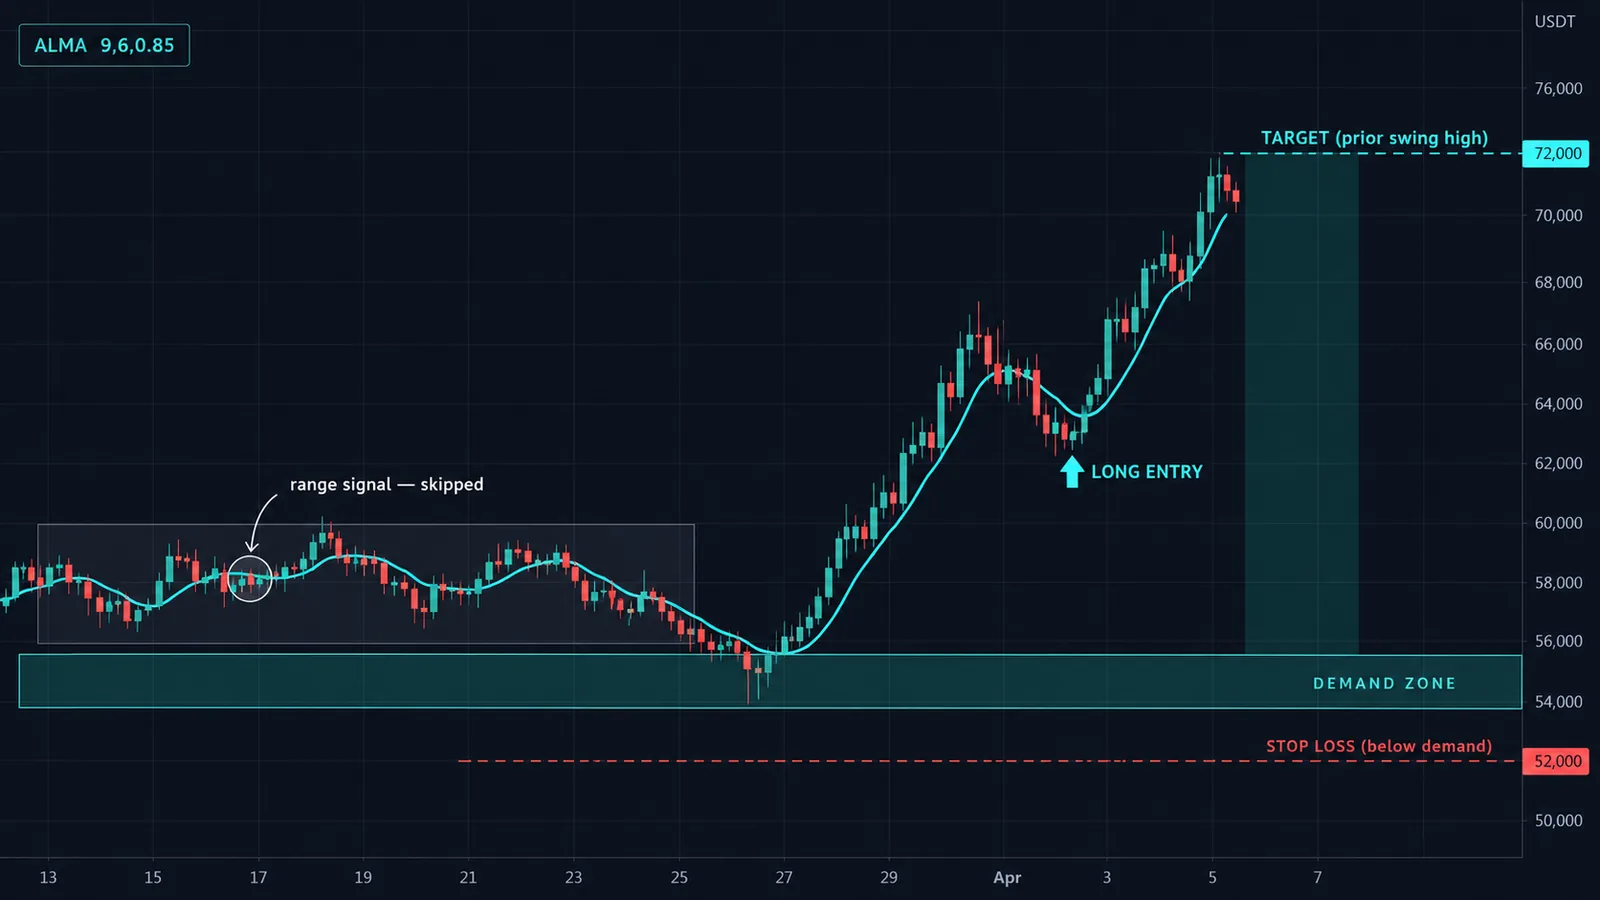
ALMA is arguably more useful as a filter than as a signal. A long ALMA with a measured slope answers one question well: should I be looking for longs, shorts, or nothing?
- Direction: close above ALMA 100 on the 4-hour chart = long setups only; below = shorts only.
- Slope: compute the change in ALMA over 10 bars and divide by ATR. A reading above +0.5 is a real uptrend, below −0.5 a real downtrend, and anything between is drift. In the drift zone, a trend system should stand aside and a mean reversion approach takes over.
- Distance: when price is more than 2–3 ATR away from the long ALMA, new trend entries carry poor risk-to-reward. Wait for a pullback toward the line.
ALMA's smoothness makes the slope reading steadier than an EMA's at the same lag, so the filter flips state less often. Pair it with a trend-strength reading such as the ADX if you want an independent check. If you want a statistical rather than visual regime test, our guide to the Hurst exponent covers how to measure whether a market has been trending or mean-reverting.
ALMA vs SMA, EMA, HMA and KAMA
Every one of these averages is trying to solve the same lag-versus-noise problem. They differ in the shape of the weights and in whether they adapt to conditions.
| Average | Weighting | Adapts to volatility? | Strength | Weakness |
|---|---|---|---|---|
| SMA | Equal weights, fixed window | No | Simple, widely watched levels (50, 200) | Most lag per unit of smoothing; jumps when old bars drop out |
| EMA | Exponential decay, infinite memory | No | Early, standard everywhere | Jittery; latest bar dominates |
| HMA | Weighted averages combined to cancel lag | No | Very low lag, smooth turns | Overshoots at reversals |
| KAMA | Smoothing constant scaled by an efficiency ratio | Yes | Goes flat in chop, speeds up in trends | Two extra parameters; slow to wake after quiet periods |
| ALMA | Gaussian bell, peak placed by offset | No | Smoothest line at a given lag; no overshoot | Lengths not comparable to EMA; three parameters |
The Hull Moving Average is ALMA's closest rival. HMA gets its speed by extrapolation, subtracting a slow weighted average from a fast one, so after a sharp reversal it can briefly shoot past price. ALMA cannot do that: all its weights are positive, so the line always stays inside the range of the closes in its window. That makes ALMA the safer choice for trailing stops, and HMA the more aggressive choice for timing turns.
The Kaufman Adaptive Moving Average solves a different problem. KAMA changes its own speed with market efficiency, which ALMA never does; ALMA(50) behaves identically in a trend and in a range. If your main complaint is whipsaw in sideways markets, KAMA, or a filter like the McGinley Dynamic, addresses that more directly than any fixed-weight average. For the full family tree, including the triangular moving average that ALMA resembles at offset 0.5, start with our moving averages guide.
How to add ALMA on TradingView
ALMA is built into TradingView, so there is nothing to install.
- Open a chart and click Indicators (or press the slash key).
- Search for Arnaud Legoux Moving Average and click it. It overlays the price pane.
- Open the settings. The inputs are Window Size (default 9), Offset (0.85) and Sigma (6). Set the window to the lag you want using the table earlier in this guide.
- For a crossover setup, add the indicator a second time with a longer window and give the two lines contrasting colours.
- Use Add alert on either line and set "Crossing" with the other ALMA as the target to get notified on crosses.
If you write Pine, the one-liner is ta.alma(close, 21, 0.85, 6). A minimal two-line overlay:
//@version=6
indicator("ALMA pair", overlay = true)
fast = ta.alma(close, 21, 0.85, 6)
slow = ta.alma(close, 50, 0.85, 6)
plot(fast, "ALMA 21", color.aqua)
plot(slow, "ALMA 50", color.purple)
Note that the offset argument of ta.alma is the Gaussian offset, not the plot offset that shifts a line left or right on the chart. Mixing those up is a common Pine bug. New to the platform? Our TradingView platform guide covers layouts, alerts and Pine basics.
Common mistakes and when ALMA fails
- Comparing lengths across averages. ALMA(20) is far faster than EMA(20). Match by lag, not by the number in the box, or your backtest compares two different systems.
- Cranking sigma for "sharpness". A high sigma on a short window turns ALMA into a two-bar average. You lose the smoothing you came for and gain nothing in timing.
- Offset 1.0 as a shortcut to zero lag. It does cut lag below one bar, but noise passed rises to about a third of raw price. At that point you are trading the candles, not a trend line.
- Optimizing all three parameters. With length, offset and sigma free, an optimizer will always find a beautiful backtest. Fix sigma at 6 and offset at 0.85, test a handful of lengths, and check that neighbouring values give similar results. If ALMA 37 works and 34 and 40 do not, you found noise.
- Using it in ranges. ALMA is not adaptive. In a sideways market every fixed average gets chopped up, ALMA included. It whipsaws less than an EMA, but it still whipsaws.
- Reading a flattening line as a reversal. A flat ALMA means momentum has paused. Reversals need confirmation from structure: a lower high after an uptrend, a break of the last swing low. Our break of structure and CHoCH guide covers those definitions.
- Ignoring the forming bar. The current bar carries roughly a fifth of the weight on default settings, so intrabar crosses can appear and disappear before the close. Use alerts set to "once per bar close".
ALMA and Quantum Algo
ALMA is at its best as the calm reference line on your chart: the thing that tells you which side of the market to work. It is not a timing tool on its own, and it does not know where risk sits. That is the division of labour we recommend.
A practical stack: a long ALMA (50 to 100 on your trading timeframe) defines bias, and something else times entries and manages risk. If you use QuantumAlgo's Zeno suite, the premium indicators give buy and sell signals with a stop and targets built in, so ALMA's job shrinks to one rule: only take Zeno signals that agree with the ALMA slope. Zeno Oscillator can add a momentum confirmation on top. The results of the signals themselves are on the public track record page, if you want to judge them independently.
If you prefer free tools, our open-source Adaptive Trend Sentinel pairs naturally with an ALMA bias line, and the Supertrend Engine gives you a volatility-based trailing stop that complements ALMA's smoothness. The free Academy covers the trend-following basics behind both, and you can browse everything at free indicators.
◆ Interactive check
How well do you know ALMA?
Questions traders ask about ALMA
ALMA, the Arnaud Legoux Moving Average, is a moving average that weights the last N bars with a Gaussian bell curve. Its offset parameter shifts the bell toward recent bars to reduce lag, and sigma controls the width of the bell.
Arnaud Legoux and Dimitrios Kouzis-Loukas developed it, and it was released around 2009. Legoux drew on the Gaussian filter from signal processing and often compared ALMA with the Hull Moving Average.
TradingView's built-in Arnaud Legoux Moving Average defaults to a window of 9, an offset of 0.85 and a sigma of 6. Those defaults produce an effective lag of about 1.6 bars.
A common starting point is ALMA 21 for timing and ALMA 50 as a trend filter on 15-minute to 1-hour charts, with offset 0.85 and sigma 6. ALMA 50 lags roughly like a 21 EMA. Test neighbouring lengths on your instrument before committing.
At the same lag ALMA is smoother; in our lag-matched test it moved about half as much per bar as an EMA. It is not more predictive, and ALMA lengths must be matched to EMA lengths by lag rather than by number.
Offset sets where the bell curve peaks inside the window, from 0 (oldest bar) to 1 (current bar). Higher values reduce lag and increase noise; 0.5 centres the bell and gives the same lag as a simple moving average.
Sigma controls the width of the Gaussian bell through s = N / sigma. A higher sigma narrows the bell so fewer bars matter, and a lower sigma widens it toward an equal-weight average. Most traders leave it at 6.
No. ALMA is a fixed-window weighted average, so values on closed bars never change. The value on the forming bar moves with the live price until that bar closes, like any moving average.
Both aim for low lag. HMA gets speed by extrapolation and can overshoot after reversals, while ALMA uses only positive Gaussian weights and always stays within the range of recent closes.
Yes. Call ta.alma(source, length, offset, sigma) and optionally a fifth floor argument. The offset argument here is the Gaussian offset, not the plot shift used in the plot function.
References & Related Guides
Read next
- Moving Averages
- Hull Moving Average
- Kaufman Adaptive Moving Average (KAMA)
- Triangular Moving Average
- Gaussian Channel Indicator
- Moving Average Ribbon
- Non-Repaint Indicators
- What Are the Best Indicators for Day Trading?
- What Are the Best Indicators for Swing Trading?
- ATR
- Free TradingView indicators
- Zeno — the premium engine
Primary sources
- TradingView Help Center — Arnaud Legoux Moving Average
- TradingView — Pine Script v6 language reference (ta.alma)
- Pineify — ta.alma() reference with Pine implementation
- Capital.com — Arnaud Legoux Moving Average guide
- LuxAlgo — Arnaud Legoux Moving Average (ALMA) guide
- TrendSpider Help — Arnaud Legoux Moving Average (ALMA)