Kaufman Adaptive Moving Average (KAMA): The Average That Knows When to Stop Moving
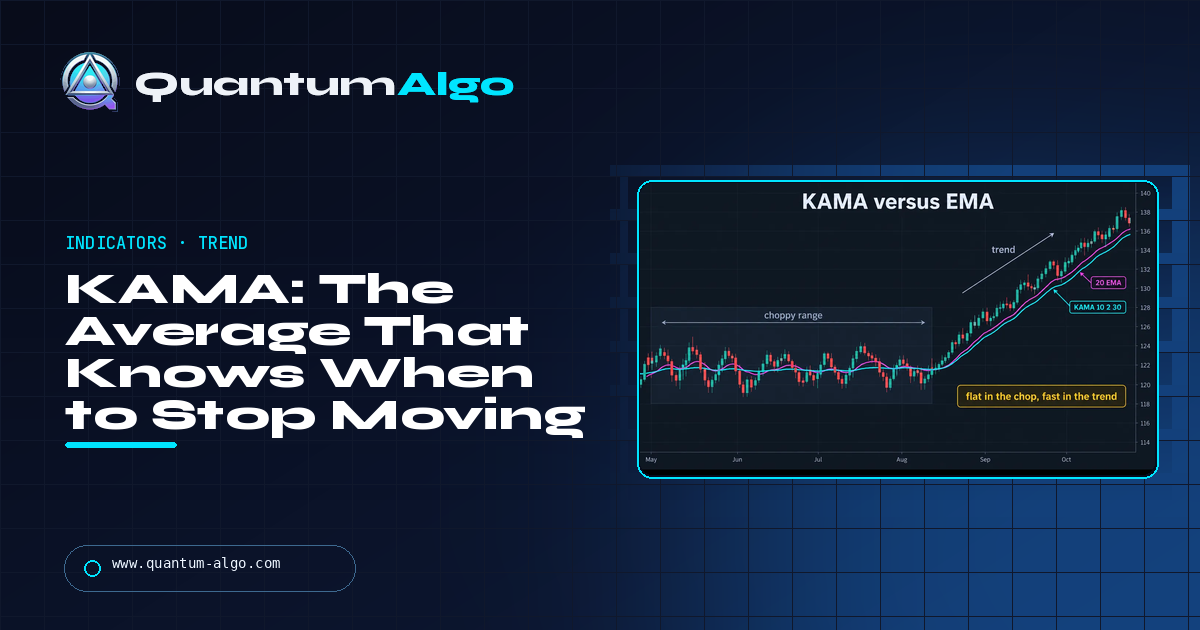
Kaufman's Adaptive Moving Average (KAMA) is a moving average whose speed changes every bar with the efficiency ratio — the net price change over 10 bars divided by the total bar-to-bar travel over those bars. When the move is efficient (ratio near 1) KAMA behaves like a 2-period EMA and tracks price tightly; when it is noise (ratio near 0) it behaves like a 30-period EMA and goes nearly flat. The signal is the slope turning after a flat stretch and the first pullback to the rising line, never price crossing a flat KAMA. It lags reversals like any average, but it whipsaws far less than a fixed-length EMA in ranges and tracks closer in trends.
KAMA is the one moving average I still keep on a chart, because it is the only one that tells me when not to use it: a flat KAMA means the market has stopped making progress, and I have never found a cleaner way to see that at a glance. This page is the efficiency ratio and why the smoothing constant is squared, the defaults and what changes them, the comparison with the EMA and other adaptive averages, the slope-and-pullback method, a BTCUSDT 4-hour range-and-breakout where KAMA crossed price twenty-six times without a single signal and then trailed a nine-day trend, and the ways it still lags. The calculator runs Kaufman's chain and reports KAMA's current speed as an equivalent EMA length.
Indicators that prove themselves in public.
One engine, four precision tools — the Gold (XAU) Scalper, the institutional Gravity Zone, the Zeno momentum Oscillator, and Zeno Stocks for equities.



What KAMA is
Kaufman's Adaptive Moving Average is a moving average whose speed changes bar by bar according to how efficiently price has been moving. When price travels a long way with little back-and-forth, KAMA speeds up and behaves like a 2-period EMA; when price travels a long way to end up nowhere, KAMA slows down and behaves like a 30-period EMA. Perry Kaufman published it in Smarter Trading (1995) as an answer to the oldest complaint about moving averages: a fast one whipsaws in ranges and a slow one lags in trends, and no fixed length avoids both.
The mechanism is a single number, the efficiency ratio: the net change over the last 10 bars divided by the sum of the absolute bar-to-bar changes over the same 10 bars. A straight-line move scores 1 — every step was progress. A zigzag that ends where it started scores 0 — all travel, no progress. That ratio is mapped onto a smoothing constant between the fast and slow EMA constants, squared to exaggerate the difference, and the result is how much of the latest price KAMA takes on board this bar.
What it is not: a predictor of trends. KAMA reacts to efficiency that has already happened; it goes flat after the chop has started and turns after the trend has started. Its value is that it does both of those things sooner and more cleanly than a fixed-length average, and that a flat KAMA is a legible "do not trade" signal — something an EMA never gives you.
The formula
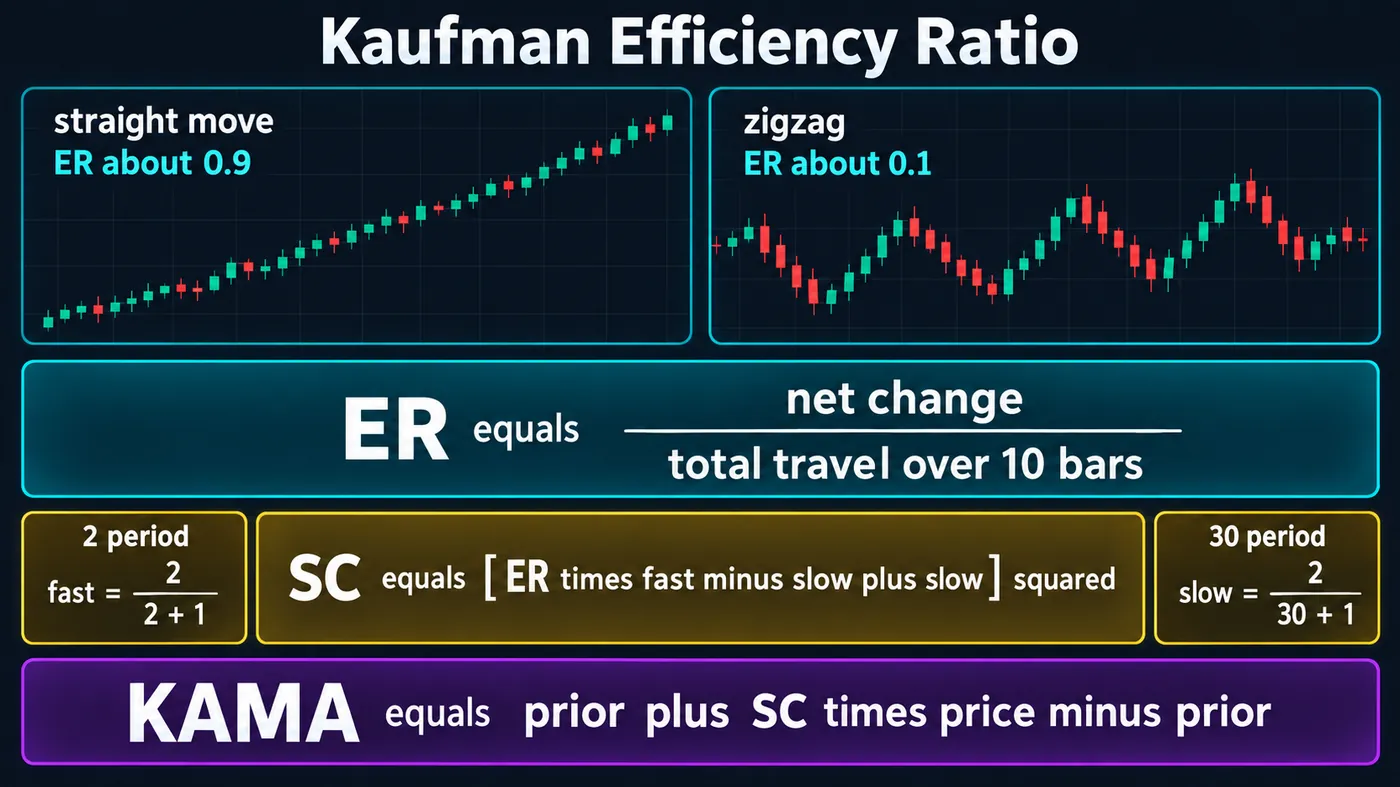
| Step | Formula | Default |
|---|---|---|
| 1. Change | |close − close n bars ago| | n = 10 |
| 2. Volatility | Σ |close − prior close| over n bars | n = 10 |
| 3. Efficiency ratio | change ÷ volatility | 0 to 1 |
| 4. Smoothing constant | [ER × (fast − slow) + slow]², where fast = 2 ÷ (2 + 1), slow = 2 ÷ (30 + 1) | fast 2, slow 30 |
| 5. KAMA | prior KAMA + SC × (close − prior KAMA) | — |
The squaring in step 4 matters. Without it, a middling efficiency ratio of 0.5 would put KAMA halfway between fast and slow. With it, ER 0.5 gives a smoothing constant close to a 9-period EMA and ER 0.3 gives one close to a 17-period EMA — the curve is bent toward slow, so KAMA stays quiet unless the move is convincingly efficient. That bias is deliberate and is why KAMA is flat far more often than it is fast.
| Use | ER period | Fast | Slow | Note |
|---|---|---|---|---|
| Default (Kaufman) | 10 | 2 | 30 | Daily bars; the tested set |
| Swing, daily and 4H | 10 | 2 | 30 | Keep it |
| Crypto 4H | 14 | 2 | 30 | Longer ER window for 24-hour noise |
| Intraday 15M | 10 | 2 | 20 | Narrower speed range; less lag when it does turn |
| Trailing stop | 10 | 2 | 30 | Use KAMA itself as the stop line; exit on a close through it |
KAMA versus the EMA and other adaptive averages
| Average | Adapts to | In a range | In a trend | Where KAMA differs |
|---|---|---|---|---|
| KAMA | Efficiency (progress ÷ travel) | Goes nearly flat | Tracks tightly | — |
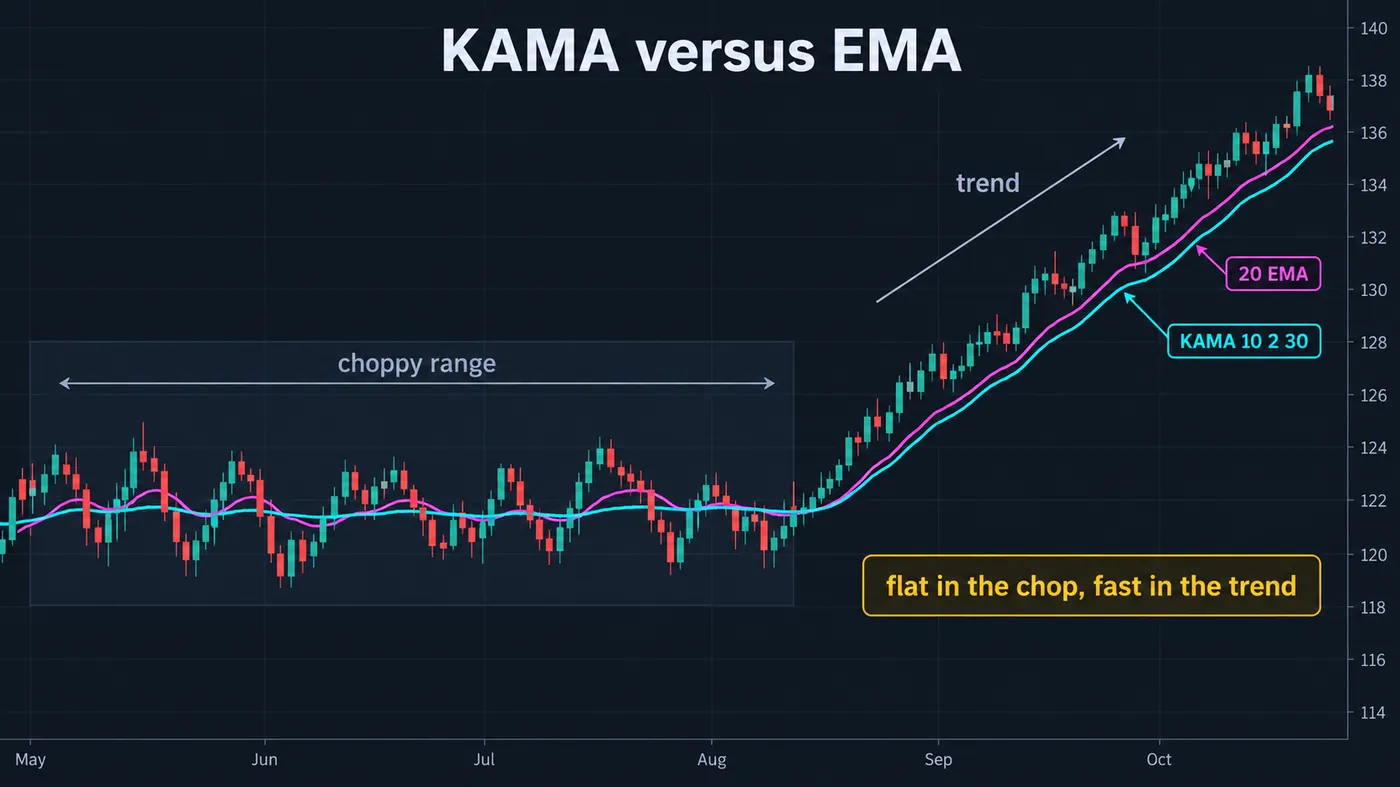
| EMA | Nothing — fixed length | Whipsaws | Lags by ~half the length | KAMA is both faster in trends and quieter in ranges than any single EMA |
| Hull MA | Nothing — weighted for low lag | Whipsaws hard | Very fast | Hull buys speed with noise; KAMA buys it with a filter |
| Triangular MA | Nothing — double-smoothed | Quiet | Very slow | TMA is always slow; KAMA is slow only when it should be |
| VIDYA (Chande) | Volatility (CMO-based) | Slows | Speeds up | Same idea with a different adaptivity input; behaves similarly |
| Adaptive Trend Sentinel | Volatility, with a ratchet | Holds | Trails | A regime line rather than an average; pairs well with KAMA as the stop |
The fair comparison is KAMA against whichever EMA length you would otherwise have chosen. Over a mixed chart KAMA will be flatter than that EMA in the ranges and closer to price in the trends, and it will cross price fewer times. That is the entire proposition, and on most liquid instruments it holds.

Automate your trades. Let Quantum Algo trade for you.
Every signal executed on your own account — on your account, with the plan you define.
How to trade it
- Use the slope, not the cross. KAMA turning up after a flat stretch is the signal; price crossing a flat KAMA is not. A flat KAMA means the efficiency ratio is low, and price crosses a flat line constantly.
- Read the efficiency ratio directly. Plot it, or use the calculator below. Above about 0.6 the market is moving efficiently and KAMA is a trend tool; below about 0.3 it is noise and KAMA is a filter telling you to stand aside.
- Enter on the first pullback to a rising KAMA. Kaufman's own entry was a close beyond KAMA by a small filter — a fraction of the standard deviation of KAMA's own changes. The practical version: KAMA rising, price pulls back to it and holds, enter on the bounce with the stop under the pullback low.
- Confirm with structure. A rising KAMA at a break of structure is a trend start; a rising KAMA inside a range is a range with a drift. The order block or swing low under the pullback is the stop, not the average.
- Trail with KAMA. In the trend, KAMA tracks close enough to work as the trailing stop: exit on a close through it. Because it goes flat when the trend stalls, it tightens automatically at the end.
- Stand down when it flattens. A KAMA that has stopped rising is telling you the efficiency ratio has collapsed. Do not take the next cross; wait for the next slope.
KAMA calculator
Paste closing prices and the tool runs the full Kaufman chain — change, volatility, efficiency ratio, squared smoothing constant, KAMA — and reports the current speed as an equivalent EMA length, so you can see whether KAMA is acting like a 2-period or a 30-period average on this bar. The preloaded sample is a chop followed by an efficient trend.
Reference data
| Item | Value |
|---|---|
| Origin | Perry J. Kaufman, Smarter Trading (McGraw-Hill, 1995) |
| Efficiency ratio | |close − close(n)| ÷ Σ|close − close(1)| over n; default n = 10 |
| Smoothing constant | [ER × (2/(2+1) − 2/(30+1)) + 2/(30+1)]² |
| KAMA | KAMA(1) + SC × (close − KAMA(1)) |
| Speed range | From a 2-period EMA (ER = 1) to a 30-period EMA (ER = 0) |
| Reads as | A trend line that is fast when the move is efficient and flat when it is not |
| Primary signals | Slope turn after a flat stretch; pullback to a rising KAMA; close through KAMA as the trailing exit |
| Not a signal | Price crossing a flat KAMA |
| Weakness | Lags reversals like any average; flat during the first bars of a new trend; the squared constant makes it slow to leave a range |
| TradingView | Community "KAMA" scripts (several exact implementations); also inside some built-in "MA" selectors |
Worked example: BTCUSDT 4-hour, range then breakout
BTCUSDT perpetual, 4-hour chart, KAMA at 10/2/30. Eleven days of range between 61,800 and 64,200 — price travelled about 38,000 points of bar-to-bar movement for a net change of under 900. Efficiency ratio between 0.02 and 0.15 the whole time; KAMA sat at 63,000 give or take 150 and price crossed it twenty-six times. A 20 EMA on the same chart crossed price thirty-one times and would have produced a dozen losing cross trades. KAMA produced none, because the rule is the slope, and it had none.
Day twelve, price closed at 64,700 above the range high and the next six 4-hour candles were all higher closes. ER rose to 0.71; the smoothing constant jumped from 0.005 to 0.24, an equivalent EMA length of about 7. KAMA turned up on the second candle after the breakout and was at 64,300 by the fourth. First pullback: 65,100 to 64,450, touching KAMA and closing back above it. Long at 64,900, stop under the pullback low at 64,300, 600 of risk. No target — trail on KAMA.
The trend ran nine days to 71,600. KAMA rose the whole way, staying 400 to 900 points under price; the close through it came at 70,100 on day ten. 5,200 points on 600 of risk, 8.7R, with no decision made after the entry except to check whether each 4-hour candle had closed below the line. The 20 EMA would have exited three days earlier at 68,400 on a pullback that KAMA — running slower because the pullback lowered the efficiency ratio — absorbed.
Where KAMA fails
The first bars of a trend. KAMA needs a few efficient bars to speed up, so it misses the breakout bar itself. The entry is the first pullback, and if there is no pullback the trade is missed. This is the price of the filter.
Sharp reversals. When an efficient uptrend reverses into an efficient downtrend, KAMA is running fast in the wrong direction for several bars before it flips. It is still an average; it still lags.
Slow ranges with drift. A range that drifts up produces an efficiency ratio of 0.3–0.4 and a slowly rising KAMA that looks like a trend. Structure says whether it is.
Over-tuning. The ER period, fast and slow lengths can be fitted to any chart. Kaufman's 10/2/30 were chosen on decades of futures data; change one, by one step, only if you can say why.
Treating the cross as a signal. The single most common misuse. A price cross of a flat KAMA is a coin flip.
Mistakes traders make with KAMA
- Trading price crossing KAMA. The slope is the signal; the cross of a flat line is noise.
- Expecting it to catch the breakout bar. It catches the first pullback.
- Ignoring the efficiency ratio. It is the indicator; KAMA is just its consequence.
- Running a fast and a slow KAMA cross. Two adaptive averages crossing each other is two lags fighting.
- Fitting the parameters. 10/2/30 is the system.
- Using it as support. It is a stop line, not a level; the level under the pullback is structure.
KAMA and the free indicators
Several community KAMA scripts on TradingView are exact and the calculator above lets you verify one. In the library, the Adaptive Trend Sentinel is the closest relative — a volatility-adaptive regime line that ratchets and pairs with KAMA as the stop — and the Adaptive Lorentzian Classification reads regime from a different direction. The Smart Money Concepts Engine supplies the structure break that says whether a rising KAMA is a trend or a drift. The premium engine, Zeno, prints buy and sell signals with a stop and targets and carries its own regime filter; a Zeno signal on the first pullback to a freshly rising KAMA is a continuation trade with the efficiency already measured.
A moving average with a throttle. The efficiency ratio decides each bar whether KAMA behaves like a 2-period or a 30-period EMA, so it goes flat in chop and hugs price in trends. Trade the slope turning and the first pullback, trail on a close through the line, and ignore every cross of a flat KAMA. Keep 10/2/30 and let structure decide whether a rising line is a trend or a drift.
◆ Interactive check
Do you know what sets the speed?
Questions traders ask about KAMA
A moving average, published by Perry Kaufman in 1995, whose smoothing changes every bar with the efficiency ratio — how much of the recent price travel was net progress. Efficient moves make it fast, like a 2-period EMA; noisy ones make it slow, like a 30-period EMA, so it goes flat in ranges and tracks price closely in trends.
Change = |close − close 10 bars ago|; volatility = the sum of absolute bar-to-bar changes over the same 10 bars; efficiency ratio = change ÷ volatility. Smoothing constant = [ER × (2/3 − 2/31) + 2/31]². KAMA = prior KAMA + SC × (close − prior KAMA).
The net price change over a window divided by the total distance price travelled bar to bar within it. A straight move scores 1; a zigzag ending where it began scores 0. It is the input KAMA adapts to, and it is worth plotting on its own as a trend-versus-noise gauge.
Kaufman's defaults: efficiency-ratio period 10, fast period 2, slow period 30. On 4-hour crypto a 14-bar ER window helps with 24-hour noise; intraday a slow period of 20 narrows the speed range. Change one parameter by one step, and only if you can say why.
Trade the slope, not the cross. Wait for KAMA to turn up after a flat stretch, confirm with a structure break, enter on the first pullback that holds the line with the stop under the pullback low, and trail the position with a close through KAMA. When the line flattens again, stand down.
For the job of one average on a mixed chart, usually: it crosses price fewer times in ranges and sits closer to price in trends than any single EMA length. It still lags reversals, and it misses the breakout bar because it needs a few efficient bars to speed up.
No. Each value depends only on completed closes and the prior KAMA; nothing changes once the bar closes.
On 4-hour and daily BTCUSDT and ETHUSDT charts, yes — the worked example on this page is one. Use a 14-bar efficiency window on 4H to offset the 24-hour noise. On 1-minute altcoin charts the ratio is rarely above 0.3 and KAMA is flat most of the time, which is honest but not useful.
Both adapt an EMA's speed to market conditions. KAMA uses the efficiency ratio (progress ÷ travel); Chande's VIDYA uses the Chande Momentum Oscillator as a volatility input. They behave similarly; KAMA's squared constant makes it a little more reluctant to speed up.
Several community scripts implement it exactly, and the calculator on this page verifies one. The library's closest relative is the Adaptive Trend Sentinel, a volatility-adaptive regime line that pairs with KAMA as the stop; the Smart Money Concepts Engine supplies the structure break. Zeno, the premium engine, prints signals with stops and targets and has its own regime filter.
References & Related Guides
Read next
- Moving Averages: Complete Guide
- Hull Moving Average
- Triangular Moving Average
- Moving Average Ribbon
- Supertrend Indicator
- Choppiness Index
- Aroon Indicator
- BOS & CHoCH: Market Structure
- Adaptive Trend Sentinel (free indicator)
- Adaptive Lorentzian Classification (free indicator)
- Regime — glossary
- Zeno — the premium engine