Expected Move
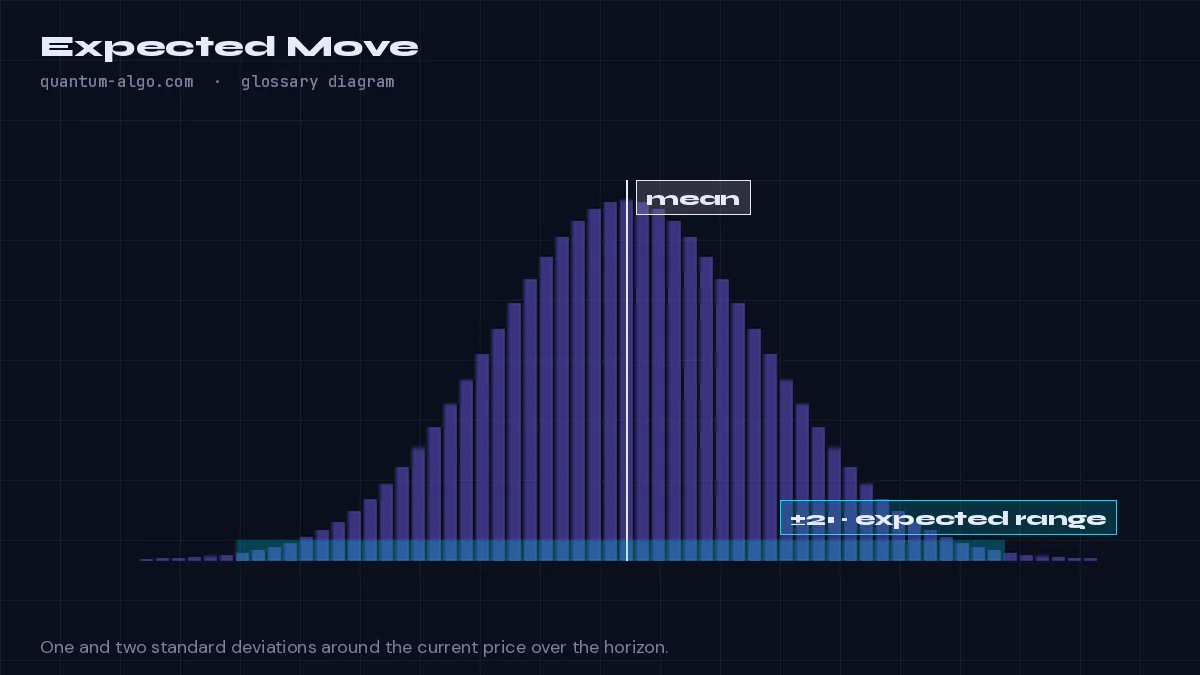
The expected move is the range price is statistically likely to stay inside over a horizon, calculated from volatility: one standard deviation (about 68% of outcomes) equals volatility per bar times the square root of the number of bars.
What it means
If a market moves 1.4% per bar on average, it does not move 28% over 20 bars — random moves partly cancel. The expected move applies square-root-of-time scaling: 1.4% × √20 ≈ 6.3% for one standard deviation, and about 12.5% for two. The range price ± that amount is where roughly 68% (1σ) or 95% (2σ) of outcomes land, assuming volatility stays put.
Options traders use implied volatility for this; chart traders use realised volatility — ideally a range-based estimator such as Yang-Zhang that uses open, high, low and close rather than closes alone. The Volatility Storm Tracker projects the cone forward from the current bar.
Its practical use is sizing and stop placement: a stop well inside the one-sigma cone is inside the noise and will be hit by chance; a target beyond two sigma is asking for a rare outcome. Compare planned stops and targets with the cone before entering.
How to identify it on a chart
- Measure volatility per bar (ATR as a percentage of price, or a realised-volatility estimator).
- Multiply by the square root of the horizon in bars for one sigma; double for two.
- Draw price ± the result from the current close; check stops and targets against it.
Worked example
BTC at 64,000 with 1.2% per-bar realised volatility on the 4-hour: over 12 bars, 1σ = 1.2% × √12 ≈ 4.2% ≈ ±2,660. A stop 800 points away sits deep inside the noise; the plan needs a wider stop or a lower-timeframe entry.
See it on the chart, read it in depth
Frequently asked questions
Why the square root of time?
Because independent random moves add in variance, not in size: variance scales with time, so the standard deviation scales with its square root.
Realised or implied volatility?
Implied comes from options prices and looks forward; realised is measured from price and is what chart tools use. Both are estimates.
Does the expected move predict direction?
No — it predicts a range around the current price with no directional view.
Which indicator draws it?
The Volatility Storm Tracker projects the one- and two-sigma cone forward and grades the current volatility regime.
Related terms
See Expected Move on your TradingView chart
Zeno reads Smart Money structure across timeframes and prints the entry, stop and targets — with a public record of every posted trade. The free indicators draw the concepts this page defines.