Band Walk
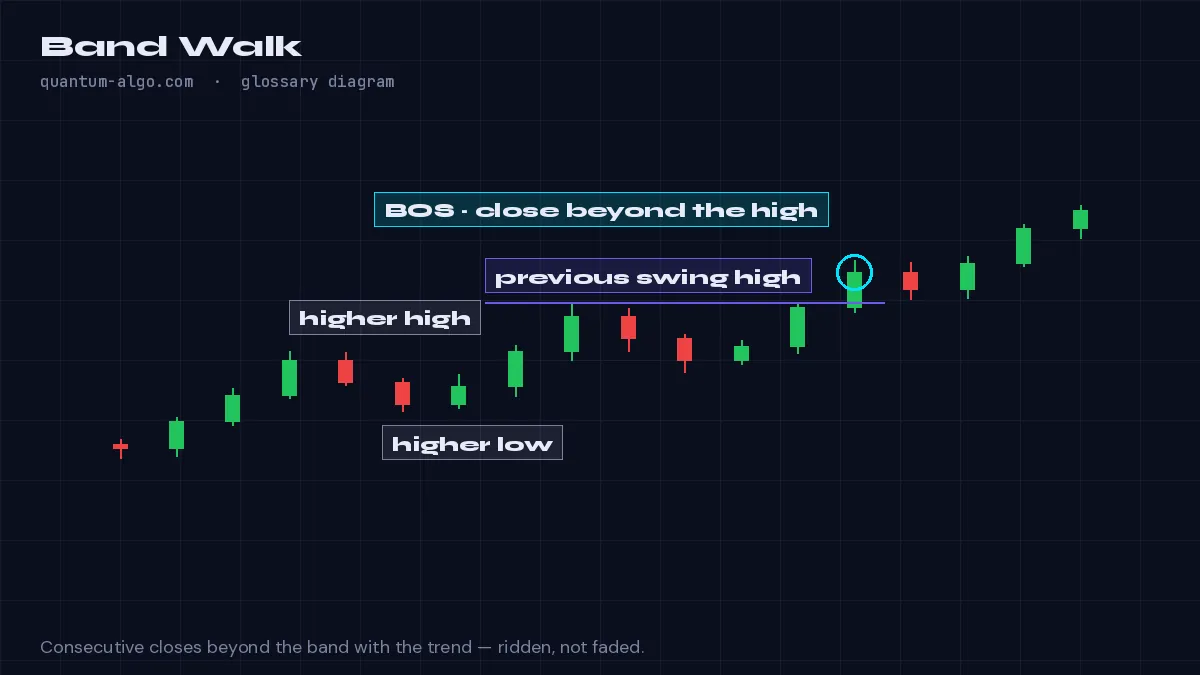
A band walk is a series of consecutive closes beyond the inner Keltner or Bollinger band in the direction of the trend — a sign of sustained strength, not an overbought or oversold condition, so it should be ridden rather than faded.
What it means
New traders read a close outside the upper band as "overbought". A band walk is the correction: in a strong trend, price can close above the upper band for many bars in a row while the band itself rises to follow it. Each close beyond the band is momentum confirming, and fading the walk is how channel traders lose.
The walk ends when price closes back inside the inner band, and that end — not the walk — is the first sign the trend is pausing. The regime matters: in a range, a touch of the outer band is fade material; in a trend, the same touch is continuation. Keltner Rings classifies the regime first and only then interprets the touch.
Band walks map onto Smart Money structure as the displacement leg extended: consecutive breaks of structure with shallow pullbacks that never reach the average.
How to identify it on a chart
- Confirm the regime is trending (structure, slope of the average).
- Count consecutive closes beyond the inner band with the trend — three or more is a walk.
- Hold with the walk; treat the first close back inside as the warning.
Worked example
SOL closes above the upper Keltner ring for nine consecutive 4-hour bars. A trader fading the first close "overbought" is stopped out four times; a trader riding the walk exits on bar ten when price closes back inside — near the top.
See it on the chart, read it in depth
Frequently asked questions
Is a band walk overbought?
No — it is trend strength. Overbought readings mean something only in ranging regimes.
How many bars make a walk?
Three consecutive closes beyond the inner band is the Keltner Rings default; four on fast index charts.
When does a band walk end?
On the first close back inside the inner band; that is the pause signal, and a close below the average is the exit.
Which bands?
Keltner (ATR-based) walks are cleaner than Bollinger walks because the channel breathes with range rather than variance.
Related terms
See Band Walk on your TradingView chart
Zeno reads Smart Money structure across timeframes and prints the entry, stop and targets — with a public record of every posted trade. The free indicators draw the concepts this page defines.