McClellan Oscillator: Formula, Readings and Breadth Thrusts
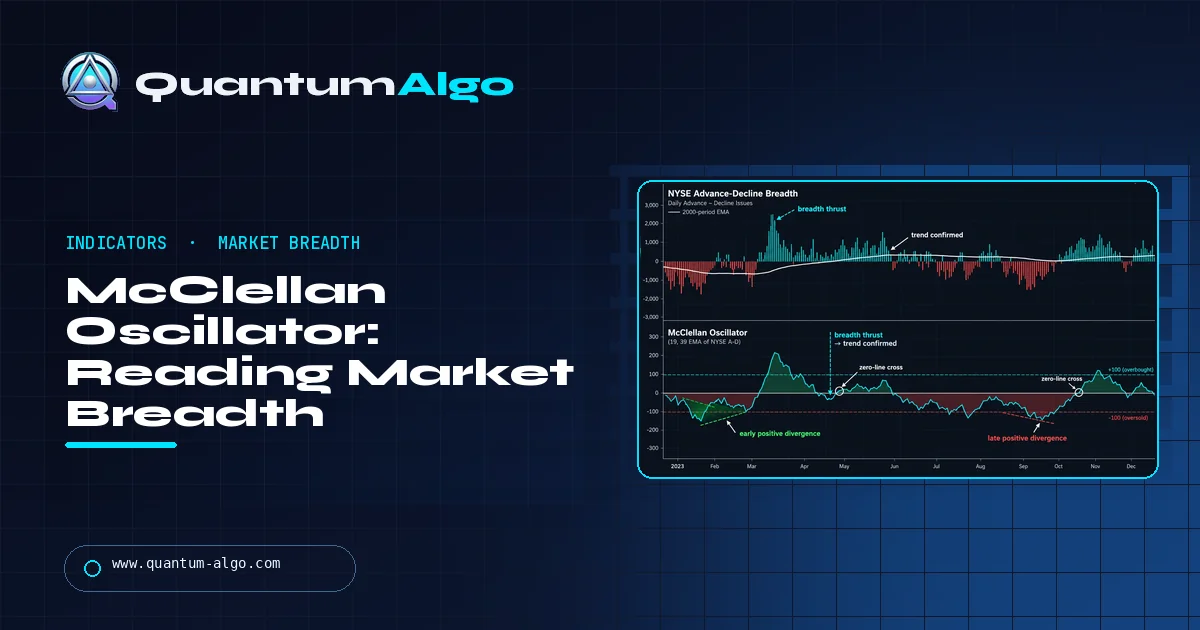
The McClellan Oscillator is a market breadth indicator equal to the 19-day EMA minus the 39-day EMA of daily NYSE net advances (advancing minus declining issues). The ratio-adjusted version divides net advances by total advances plus declines and multiplies by 1,000. Readings above zero show improving breadth, and a swing from below −50 to above +50 is a breadth thrust.
The S&P 500 can hit a new high while most stocks quietly fall. The McClellan Oscillator was built to catch exactly that. Created in 1969 by Sherman and Marian McClellan, it turns the daily count of advancing and declining NYSE issues into a single momentum line that often turns before price. This Quantum Algo guide gives you both formulas, a hand-worked two-day calculation, what the ±50 and ±100 levels really mean, how breadth thrusts and the Summation Index work, the exact TradingView symbols to use, and a calculator for your own data.
Indicators that prove themselves in public.
One engine, four precision tools — the Gold (XAU) Scalper, the institutional Gravity Zone, the Zeno momentum Oscillator, and Zeno Stocks for equities.
What does the McClellan Oscillator actually measure?
Price tells you what an index did. Breadth tells you how many stocks came along for the ride. The McClellan Oscillator is a breadth indicator: it is built entirely from the daily count of advancing and declining issues on an exchange, usually the NYSE, and it ignores the index level completely.
It doesn't simply measure whether more stocks rose than fell. It compares a fast-moving average of daily net advances with a slower one, so it shows whether breadth is improving or deteriorating relative to its recent trend. Tom McClellan, son of the creators, put it neatly in an interview with AAII: "The McClellan Oscillator measures acceleration in breadth, not just direction."
That distinction explains most of its behavior. After a long rally in which advances dominated every day, the oscillator can drop toward zero even while advances still beat declines, simply because the pace has slowed. And after a crash, a few strong breadth days can send it sharply positive while the index is still far below its highs. Acceleration turns before direction, which is why the oscillator often leads price at turning points and also why it whips around a lot.
If you've used an MACD, the shape will feel familiar. It is literally the difference between two exponential moving averages, just applied to breadth instead of price. Our MACD guide covers the price version, and the advance-decline line guide explains the raw breadth data the oscillator is built from.
Who created it, and why 19 and 39 days?
Sherman and Marian McClellan, a husband-and-wife team in Southern California, developed the oscillator and its companion, the Summation Index, in 1969. Marian, a mathematics major, did the exponential moving average calculations by hand; Sherman, who had studied business and economics, had turned to technical analysis after growing frustrated with fundamental methods. Their booklet Patterns for Profit, first published by Trade Levels in 1970, included eight years of hand-calculated oscillator and summation charts.
The McClellans built on the work of P.N. Haurlan, who used exponential moving averages on breadth data in the 1960s and, according to McClellan Financial, was an actual rocket scientist at the Jet Propulsion Laboratory. Haurlan described EMAs by their smoothing percentage rather than a day count, and the McClellans kept that language. The oscillator is officially the 10% Trend minus the 5% Trend of daily net advances.
The 19 and 39 come from converting those percentages to days with the standard formula, smoothing constant = 2 ÷ (n + 1). A 10% constant gives 2 ÷ 20, so n = 19. A 5% constant gives 2 ÷ 40, so n = 39. McClellan Financial notes that the day labels are "somewhat misleading," since an EMA uses all past data with decaying weights, not a fixed window.
Sherman McClellan received the Market Technicians Association's Lifetime Achievement Award in 2004, honoring the couple's joint work; Marian had died in November 2003.
How is the McClellan Oscillator calculated?
There are two versions, and mixing them up is the most common reason numbers don't match between websites.
Classic (unadjusted)
Net advances = Advancing issues − Declining issues10% Trend today = 10% Trend yesterday + 0.10 × (Net advances − 10% Trend yesterday)5% Trend today = 5% Trend yesterday + 0.05 × (Net advances − 5% Trend yesterday)Oscillator = 10% Trend − 5% TrendRatio-adjusted
The number of issues listed on the NYSE has changed a lot over the decades, so a net-advances reading of +500 meant something different when far fewer issues traded. The ratio-adjusted version divides by the total issues that moved and multiplies by 1,000 to avoid decimals:
RANA = (Advances − Declines) ÷ (Advances + Declines) × 1,000The two EMAs and the difference are then calculated on RANA exactly as above. Because RANA is a percentage scaled by 1,000, a reading of +753 means net advances were 75.3% of the issues that moved, which is the example StockCharts uses. Applying the ×1,000 before or after the EMAs gives the same result, since the math is linear.
| Feature | Classic | Ratio-adjusted |
|---|---|---|
| Input | Advances − declines | (A − D) ÷ (A + D) × 1,000 |
| Comparable across decades | No | Yes |
| StockCharts symbol (NYSE) | $NYMOT | $NYMO |
| Fixed guide levels (±50, ±100) | Not meaningful | Commonly used |
To start the series, StockCharts uses a simple average as the first EMA value. In practice, you want at least a few months of data before trusting the readings, because early values still carry the seed. The calculator below follows that convention: it seeds the 19-day EMA with the average of the first 19 days and the 39-day EMA with the average of the first 39.
Worked example: two days of NYSE breadth by hand
Here's the arithmetic for the ratio-adjusted version, using round numbers so you can follow every step. Assume that at yesterday's close the 19-day EMA of RANA was −35.0, the 39-day EMA was +10.0, so the oscillator stood at −45.0. The ratio-adjusted Summation Index was +120.
Day 1: advances 2,150, declines 650
- RANA = (2,150 − 650) ÷ (2,150 + 650) × 1,000 = 1,500 ÷ 2,800 × 1,000 = 535.71
- 19-day EMA = −35.00 + 0.10 × (535.71 − (−35.00)) = −35.00 + 57.07 = 22.07
- 39-day EMA = 10.00 + 0.05 × (535.71 − 10.00) = 10.00 + 26.29 = 36.29
- Oscillator = 22.07 − 36.29 ≈ −14.2
- Summation Index = 120 + (−14.2) = 105.8
Day 2: advances 2,300, declines 500
- RANA = 1,800 ÷ 2,800 × 1,000 = 642.86
- 19-day EMA = 22.07 + 0.10 × (642.86 − 22.07) = 22.07 + 62.08 = 84.15
- 39-day EMA = 36.29 + 0.05 × (642.86 − 36.29) = 36.29 + 30.33 = 66.62
- Oscillator = 84.15 − 66.62 ≈ +17.5
- Summation Index = 105.8 + 17.5 = 123.3
Two very strong breadth days, with roughly three-quarters of moving issues advancing, lifted the oscillator by 62.5 points, from −45.0 to +17.5. That's the acceleration idea in numbers: the fast EMA reacts twice as strongly as the slow one, so a sudden change in breadth pushes them apart quickly.
Now compare the classic version. Day 1's net advances are simply +1,500, and on an exchange with fewer issues the same 75% breadth might be +900. The classic oscillator's size depends on how many issues trade, which is why ±100 thresholds only make sense for the ratio-adjusted series.
The calculator loads 60 days of illustrative NYSE-style data: a choppy stretch, a sharp sell-off with declines dominating, and then a strong recovery. Run it and you'll see the ratio-adjusted oscillator end at +125.7, with a breadth thrust flagged from −138.1. Switch the menu to classic and the same data gives +339.8, which shows how different the two scales are.
What do the readings mean: zero, ±50, ±100 and beyond?
For the ratio-adjusted oscillator, the guide levels below are the ones practitioners and StockCharts' examples use most. Treat them as zones, not triggers.
| Reading | What it usually means | How we'd treat it |
|---|---|---|
| Above +100 | Very strong breadth surge; short-term overbought | Early in a new rally it's a sign of strength, not a sell |
| +50 to +100 | Strong, broad participation | Supports a rising market |
| 0 to +50 | Advances have the edge | Mildly bullish; watch the slope |
| 0 to −50 | Declines have the edge | Mildly bearish; watch the slope |
| −50 to −100 | Heavy, broad selling | Pressure is real; wait for a turn |
| Below −100 | Washout; short-term oversold | Look for a sharp reversal, especially if price is at support |
AAII's overview gives a similar frame, with overbought around +70 to +100 and oversold around −70 to −100, and notes that in intense stress readings can reach ±150 or beyond. So "oversold" is not a floor. In a true crash, the oscillator can sit below −100 while prices keep falling.
The zero line matters too. Positive readings mean the 10% Trend is above the 5% Trend, which StockCharts describes as advances gaining the upper hand. But crossings happen often, and AAII warns against trading every one. A crossing that comes after a deep negative reading, with a steep slope, is more meaningful than a drift across zero in a quiet market. StockCharts' examples show that in an indecisive period the oscillator stayed between +30 and −30, which is itself a message: no side is in control.
One more nuance: overbought readings early in a move are often bullish. The strongest rallies start with breadth so lopsided that the oscillator jumps far above +100. Selling that is like selling a stock because its volume was too high on a breakout.
What is a McClellan breadth thrust?
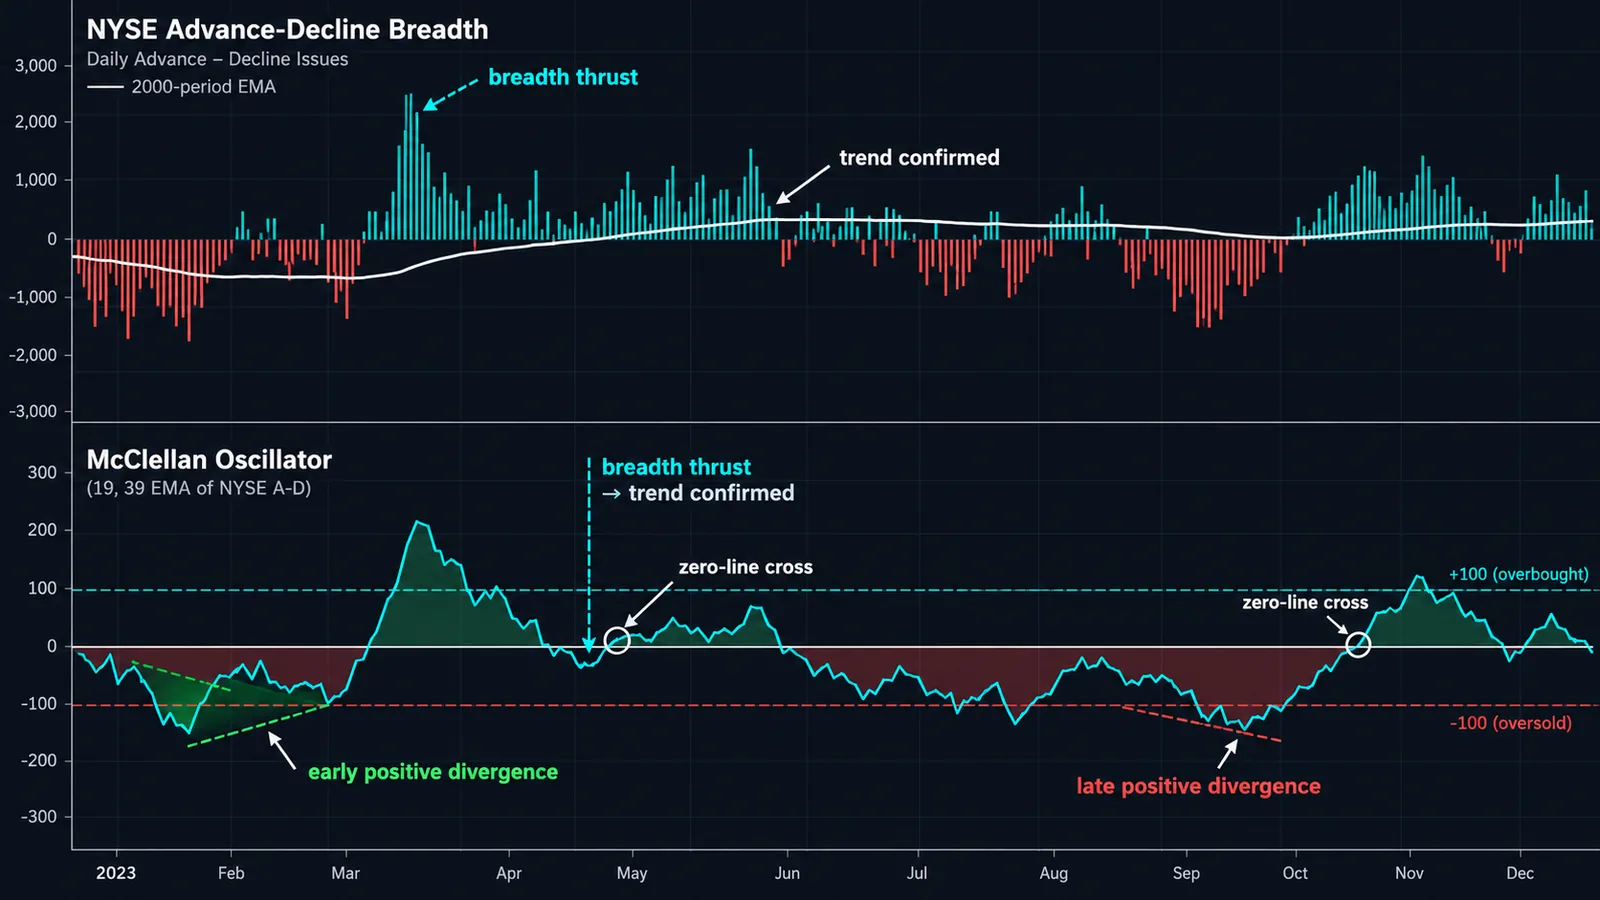
A breadth thrust is a sudden swing from broad selling to broad buying. StockCharts' definition: the oscillator moves from below −50 to above +50, a rise of at least 100 points. Those surges tend to appear near the start of meaningful advances, because they show that buyers stepped in across the whole market at once rather than in a handful of large stocks.
StockCharts' ChartSchool shows several examples. On the Nasdaq in March 2009, the oscillator surged from −80 to +80, more than 150 points, right as the bear market ended. In another example it thrust from −70 to +50, a 120-point move. In both cases the important part wasn't the final reading but the speed and size of the swing.
How to use a thrust
- Confirm it's real. The low point should be genuinely below −50 and the high above +50, ideally within a couple of weeks.
- Expect a pause. Lower highs on the oscillator after a thrust are normal. Breadth can't stay that lopsided for long, so the oscillator usually cools off while price keeps climbing or consolidates.
- Use price for timing. The thrust tells you the backdrop has improved. A higher low on the index, or a reclaim of a key moving average, is a better entry than buying the thrust day itself.
◆ Not fail-proof: StockCharts explicitly says breadth thrusts and zero-line crosses are "certainly not fail-proof." Use a thrust as a reason to stop being bearish, not as a guarantee of new highs.
Don't confuse this with other breadth-thrust signals you may read about, such as Martin Zweig's, which use different formulas and thresholds. The McClellan version is specific to this oscillator. For an intraday breadth read during the session, the NYSE TICK index covers the same idea minute by minute.
How do you trade McClellan Oscillator divergences?
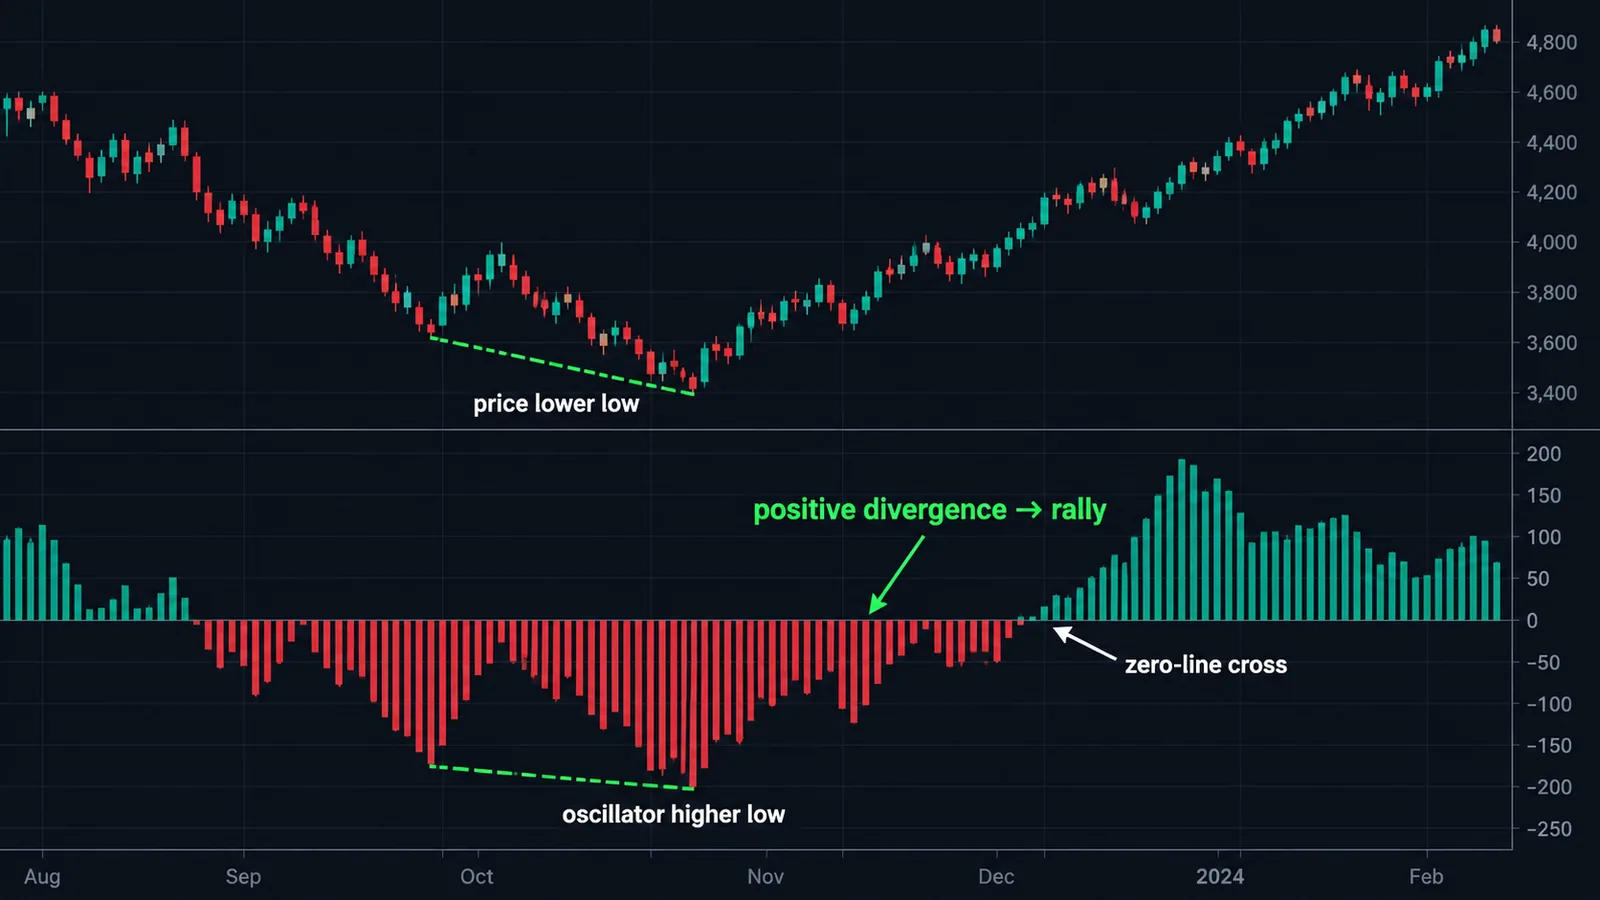
A bearish divergence happens when the index makes a higher high while the oscillator makes a lower high. Fewer stocks are participating in the new high. A bullish divergence is the reverse: the index makes a lower low while the oscillator makes a higher low, showing selling pressure is thinning even as prices slip.
Two rules from StockCharts keep divergences honest. First, divergences need to be sharp. A slightly lower oscillator high means little; the October 2007 example in ChartSchool showed a sharply lower high that was "barely positive" while the market was near its top. Second, they need confirmation: a bullish divergence is confirmed by a strong move into positive territory, a bearish one by a strong move into negative territory. Until that happens, it's only a warning.
StockCharts also admits the uncomfortable part: divergences are common, and "most will not result in reversals or extended moves." That makes them better at telling you when to tighten stops or reduce size than when to reverse your position.
A practical way to filter them is to require a second, independent sign of weakness or strength. On the price chart, that could be a break of a rising trendline or a failed breakout. On other breadth gauges, it could be the advance-decline line failing to confirm a new high, or the percentage of stocks above their 50-day average rolling over. Our free Multi-Oscillator Divergence Scanner handles the price-oscillator side of that cross-check, and our RSI guide covers how divergences behave on price momentum.
How does the McClellan Summation Index work?
Marian McClellan conceived the Summation Index as a running total of the daily oscillator values, the area under the oscillator's curve. Where the oscillator is a short-term momentum read on breadth, the Summation Index is the intermediate-term trend.
Summation Index today = Summation Index yesterday + Oscillator todayStockCharts notes the very first Summation value is just the first oscillator value. The original classic version was shifted up by 1,000 points, so its neutral level is +1,000 and normal readings run roughly from 0 to 2,000. The ratio-adjusted version (RASI, $NYSI on StockCharts) is centered on zero.
Readings that traders watch
- Direction. A rising Summation Index means the oscillator is positive and breadth is supporting the trend. StockCharts suggests smoothing it with a moving average, for example 20 days, and watching for turns.
- The zero line (RASI). Above zero favors bulls, below favors bears. Sustained readings matter more than single crosses.
- ±500 (RASI). Tom McClellan has written that a RASI move from below −500 to well above +500 shows a rally has enough "escape velocity" to continue, and that a failure to reach +500 warns the uptrend may not be strong. StockCharts presents ±500 as an example threshold a chartist can set, not a standard rule.
The Nasdaq version ($NASI) has a long-term downward bias, according to StockCharts, so compare its readings with its own history instead of with the NYSE version.
How do you chart the McClellan Oscillator on TradingView?
TradingView supplies the raw breadth data as US statistical index symbols. These are the ones you need, all verified on TradingView's symbol pages:
| Symbol | What it is | Use |
|---|---|---|
| USI:ADVN.NY | NYSE advancing issues | Ratio-adjusted NYSE oscillator |
| USI:DECL.NY | NYSE declining issues | Ratio-adjusted NYSE oscillator |
| USI:ADD | NYSE advances minus declines | Classic NYSE oscillator |
| USI:ADVN.NQ / USI:DECL.NQ | Nasdaq advancing / declining issues | Ratio-adjusted Nasdaq oscillator |
| USI:ADDQ | Nasdaq advances minus declines | Classic Nasdaq oscillator |
The easiest route is a community script. Open Indicators, go to Community and search "McClellan Oscillator." LazyBear's open-source version is one of the most used; its description says it supports a ratio-adjusted mode, lets you choose any market's advancing and declining issues, and defaults to the NYSE. Confirm it's set to ratio-adjusted if you want the ±100 levels to apply.
If you prefer to see the math, a minimal Pine version is short:
//@version=6indicator("McClellan Oscillator (ratio-adjusted)")adv = request.security("USI:ADVN.NY", "D", close)dec = request.security("USI:DECL.NY", "D", close)rana = (adv - dec) / (adv + dec) * 1000osc = ta.ema(rana, 19) - ta.ema(rana, 39)plot(osc, "McClellan", style = plot.style_columns, color = osc >= 0 ? color.teal : color.red)hline(100),hline(0),hline(-100)
Apply it on a daily chart of the S&P 500 or NYSE Composite. Pine's ta.ema uses the same 2 ÷ (n + 1) constant, so lengths 19 and 39 reproduce the 10% and 5% trends. Small differences from published values are normal: data vendors count issues slightly differently, and the seed value affects early readings. For a running summation, add sumIdx = ta.cum(osc) and plot it in a separate pane. If you're new to Pine and multi-pane layouts, our TradingView guide covers the basics.
How do you use it for the S&P 500 and NYSE?
The oscillator is computed from NYSE breadth, but most people trade the S&P 500 through SPY, ES futures or index CFDs. That's fine. NYSE breadth and the S&P 500 share most of their drivers, and the oscillator's job is to describe the market's internal health, not to match the index tick for tick.
There is one well-known complication. The NYSE lists many issues that aren't operating companies, including closed-end bond funds and preferred shares, and these can move with interest rates rather than with stocks. Some analysts prefer common-stock-only breadth for that reason. Tom McClellan's view is that the issue "has been overplayed," that the chart structures of the two versions don't differ hugely, and that common-only data is usually available only well after the close. We'd keep using the standard series but stay alert when rates are moving sharply.
A simple playbook
- Regime: Summation Index rising and above zero means you favor longs on pullbacks. Falling and below zero means you favor caution or shorts on rallies.
- Setup: in a rising regime, an oscillator dip toward −50 to −100 while the S&P 500 holds above a key moving average is a classic buy-the-dip zone, the breadth version of the setups in our mean reversion trading guide.
- Warning: a new S&P 500 high with an oscillator high that's sharply lower, especially barely positive, says participation is narrowing. Tighten stops.
- Turn: after a deep washout below −100, a thrust above +50 says the selling is exhausted; use price structure for the entry.
Breadth also works well next to sentiment. A washout below −100 that coincides with an extreme reading in the put/call ratio is a stronger case for a low than either alone. Pair it with price-based tools that work well on the index, which we cover in best indicators for the S&P 500. For Nasdaq-heavy portfolios, run the Nasdaq version too, and our best indicators for Nasdaq guide covers the price side. If you trade crypto, the same logic carries over to coin baskets, as we explain in the crypto market breadth indicator guide.
Limits and common mistakes with the McClellan Oscillator
- Comparing classic and ratio-adjusted numbers. A +300 classic reading and a +300 ratio-adjusted reading are not the same thing. Know which series you're looking at.
- Selling every reading above +100. Extreme positive readings often mark the start of strong rallies. Overbought early is strength.
- Buying every reading below −100. In a crash, the oscillator can stay deeply negative for days. Wait for a turn.
- Trading every zero cross. Crossings are frequent and noisy. Use the slope, the depth of the prior swing and the Summation Index for context.
- Trusting every divergence. By StockCharts' own account, most divergences don't lead to reversals.
- Using too little history. EMAs need warm-up. With less than a few months of data, your values depend heavily on the seed.
- Applying it to single stocks. It's a market-wide breadth tool. It tells you about the tide, not about one boat.
- Ignoring data quirks. Vendors differ in how they count issues and handle unchanged stocks, so your values may not match another site's exactly. McClellan Financial itself notes differences can come from different data or calculation errors on either end.
The biggest limit is structural. Breadth describes participation, and participation can stay narrow for a long time while a handful of mega-cap stocks carry the index higher. In those markets, bearish breadth readings can be "right" about internal weakness for months without the index falling. Use the oscillator to adjust risk, not to call tops. If you want another market-internals angle, the Smart Money Index looks at intraday timing of index moves instead of participation.
McClellan Oscillator and Quantum Algo
The McClellan Oscillator works best as a market filter sitting above your trade-level tools. For the price side, our free Market Bottom Finder pairs naturally with washout readings below −100, and the Directional Strength Index tells you whether the index trend is strong enough to trust a breadth thrust. For a related EMA-based momentum read on price, the TRIX indicator guide is a good companion.
If you trade the S&P 500 or Nasdaq with Zeno Stocks, part of Quantum Algo's premium Zeno suite for TradingView, a sensible split is breadth for the regime and Zeno for the timing and risk: take Zeno buy signals more readily when the Summation Index is rising, and be choosier when breadth is deteriorating. Zeno supplies the entry with a stop and targets; the oscillator tells you whether the market's internals are on your side. You can check the signals' history on the public track record, and the free QuantumAlgo Academy covers market breadth and index trading in more depth.
◆ Interactive check
How well do you know the McClellan Oscillator?
Questions traders ask about the McClellan Oscillator
For the ratio-adjusted version, readings above zero show advances gaining the upper hand, +50 to +100 shows strong participation, and above +100 is a short-term extreme. Below −100 is a washout. Context matters more than any single number.
It means breadth is extremely negative, a short-term oversold condition where declines heavily outnumber advances. It often appears near short-term lows, but in severe sell-offs readings can fall to −150 or lower before prices turn.
NYMO is the StockCharts symbol for the ratio-adjusted NYSE McClellan Oscillator, the short-term breadth momentum line. NYSI is the ratio-adjusted McClellan Summation Index, the running total of NYMO, used for the intermediate-term trend.
It often turns before price because it measures acceleration in breadth rather than direction. That makes it early at many turns, but it also produces many false signals, so use it with price confirmation.
You can add community scripts such as LazyBear's McClellan Oscillator, or build one in Pine using USI:ADVN.NY and USI:DECL.NY. The guide includes an eight-line Pine version.
The McClellans used EMAs described by smoothing percentages, 10% and 5%. Using the formula 2 ÷ (n + 1), a 10% constant equals 19 days and a 5% constant equals 39 days.
It divides net advances by total advances plus declines, then multiplies by 1,000, before applying the EMAs. That normalizes for changes in the number of listed issues, so readings are comparable across decades.
Yes, using Nasdaq advancing and declining issues (USI:ADVN.NQ and USI:DECL.NQ on TradingView). The Nasdaq Summation Index has a long-term downward bias, so compare it with its own history.
The advance-decline line is a cumulative total of daily net advances and shows the long-term breadth trend. The oscillator is the difference between two EMAs of net advances and shows short-term momentum. See our advance-decline line guide.
No. It is built from exchange-wide breadth data, so it describes the whole market. For a single stock, use price and volume indicators instead.
References & Related Guides
Read next
- What Is the Advance-Decline Line and How Do You Use It?
- What Is the Best Indicator for S&P 500 (SPX500)?
- MACD Indicator
- What Is a Crypto Market Breadth Indicator?
- Put/Call Ratio
- Smart Money Index
- Moving Averages
- NYSE TICK Index
- RSI Indicator
- TradingView
- Free TradingView indicators
- Zeno — the premium engine
Primary sources
- StockCharts ChartSchool — McClellan Oscillator
- StockCharts ChartSchool — McClellan Summation Index
- McClellan Financial Publications — Calculating the McClellan Oscillator
- McClellan Financial Publications — Sherman McClellan MTA Lifetime Achievement Award (PDF)
- McClellan Financial Publications — RASI Above +500 Says Bull Market Not Done
- AAII — Looking Beyond Price Trends With the McClellan Oscillator
- TradingView — USI:ADD, NYSE $ADV minus $DECL
- TradingView — McClellan Oscillator [LazyBear] (open-source script)