Smart Money Index: How the Open-vs-Close Indicator Tracks Institutions
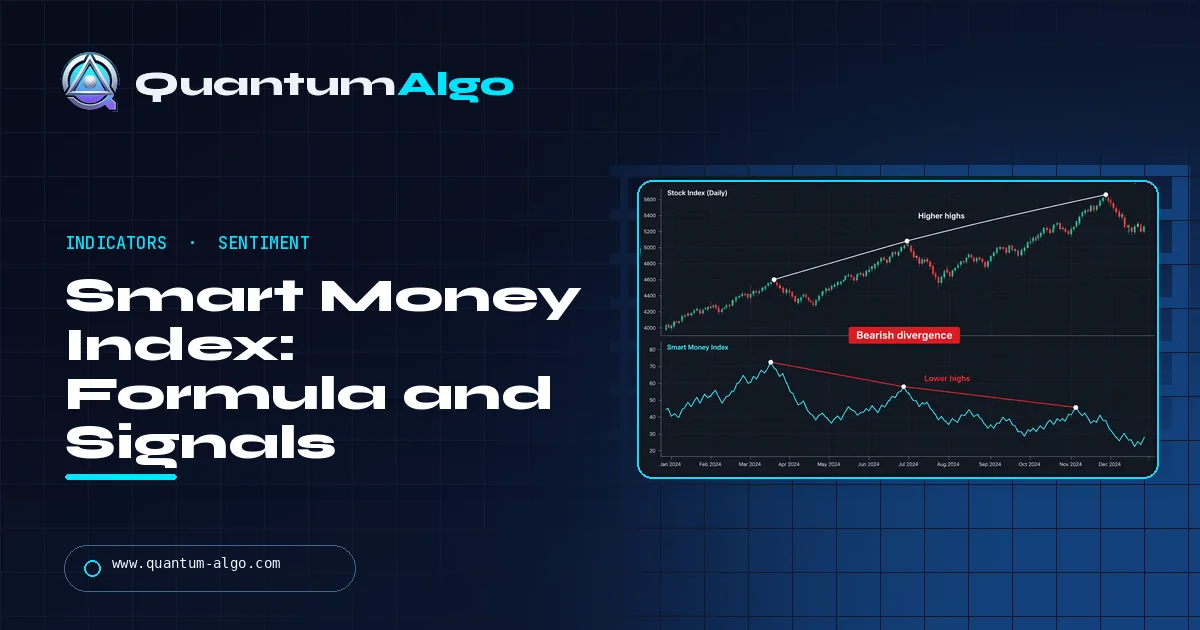
The Smart Money Index is a market sentiment indicator popularised by Don Hays in the 1990s. It assumes that emotional, news-driven buying and selling happens in the first 30 minutes of the US session, while professional money trades in the last hour. Each day it subtracts the Dow's move in the first half hour and adds its move in the last hour to a running total. When the index rises while the Dow falls, the "smart money" is said to be buying weakness; when it falls while the Dow rises, professionals are said to be selling into strength. It is a slow, divergence-based backdrop for the US stock market, not an entry signal, and closing-auction and ETF flows have weakened its original logic.
Most volume indicators count how much traded. The Smart Money Index asks when it traded. Its premise is old Wall Street wisdom: the crowd reacts to overnight headlines at the open, and professionals make their decisions near the close. This guide explains where the indicator comes from, the exact formula, how to read divergences, why the open-versus-close logic is weaker than it was, and how to use it alongside price. A calculator below builds the index from your own intraday prices.
Indicators that prove themselves in public.
One engine, four precision tools — the Gold (XAU) Scalper, the institutional Gravity Zone, the Zeno momentum Oscillator, and Zeno Stocks for equities.
What is the Smart Money Index?
The Smart Money Index is a sentiment indicator for the US stock market. It was popularised in the 1990s by Don Hays, a strategist who ran Hays Advisory and wrote about it widely; a closely related version published by others is called the Smart Money Flow Index. Both rest on the same idea: the time of day at which people trade says something about who is trading.
The theory goes like this. At the open, the market reacts to overnight news, analyst calls and emotional orders placed before the bell. That early activity is treated as "dumb money": fast, crowded and often wrong. By the last hour, the news has been digested, and large funds that need liquidity to move size do much of their work into the close. That late activity is treated as "smart money". If the market rises all morning but sells off into the close day after day, the professionals are said to be distributing; if it drops at the open but recovers into the close, they are said to be accumulating.
The indicator has nothing to do with the Smart Money Concepts used in price-action trading, and it is not the Stochastic Momentum Index, a momentum oscillator that also goes by SMI. To avoid confusion this guide spells the name out in full.
How is the Smart Money Index calculated?
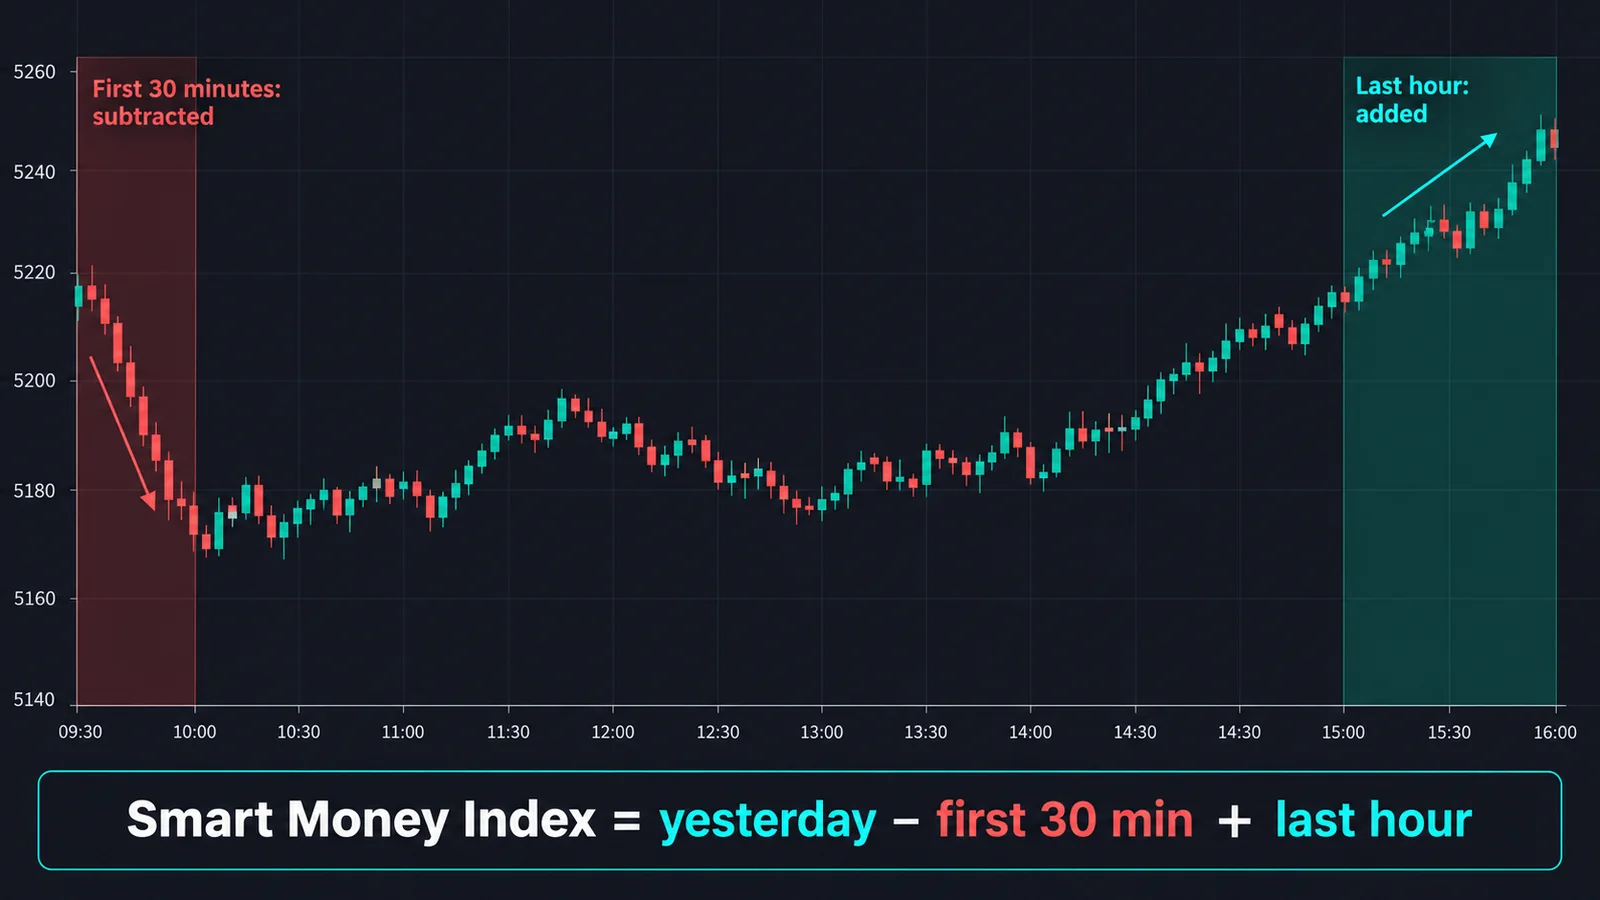
The classic formula uses the Dow Jones Industrial Average, although the same logic works on the S&P 500 or a liquid index ETF:
- First 30 minutes: the index level 30 minutes after the open minus the open (or, in some versions, minus the previous close, so the overnight gap counts as morning emotion too).
- Last hour: the close minus the level one hour before the close.
- Subtracting the morning move means a strong emotional rally at the open pulls the index down; adding the late move means buying into the close pushes it up.
The absolute level of the index means nothing; it depends on the starting value. What matters is its direction and how that direction compares with the market itself. Most charts start the series at an arbitrary number such as 10,000 and show it below or beside the index.
Because the calculation needs intraday prices at fixed times, you cannot build it from daily candles alone. You need a 30-minute or one-hour chart of the index, or a data source that publishes the series directly.
How do you read the Smart Money Index?
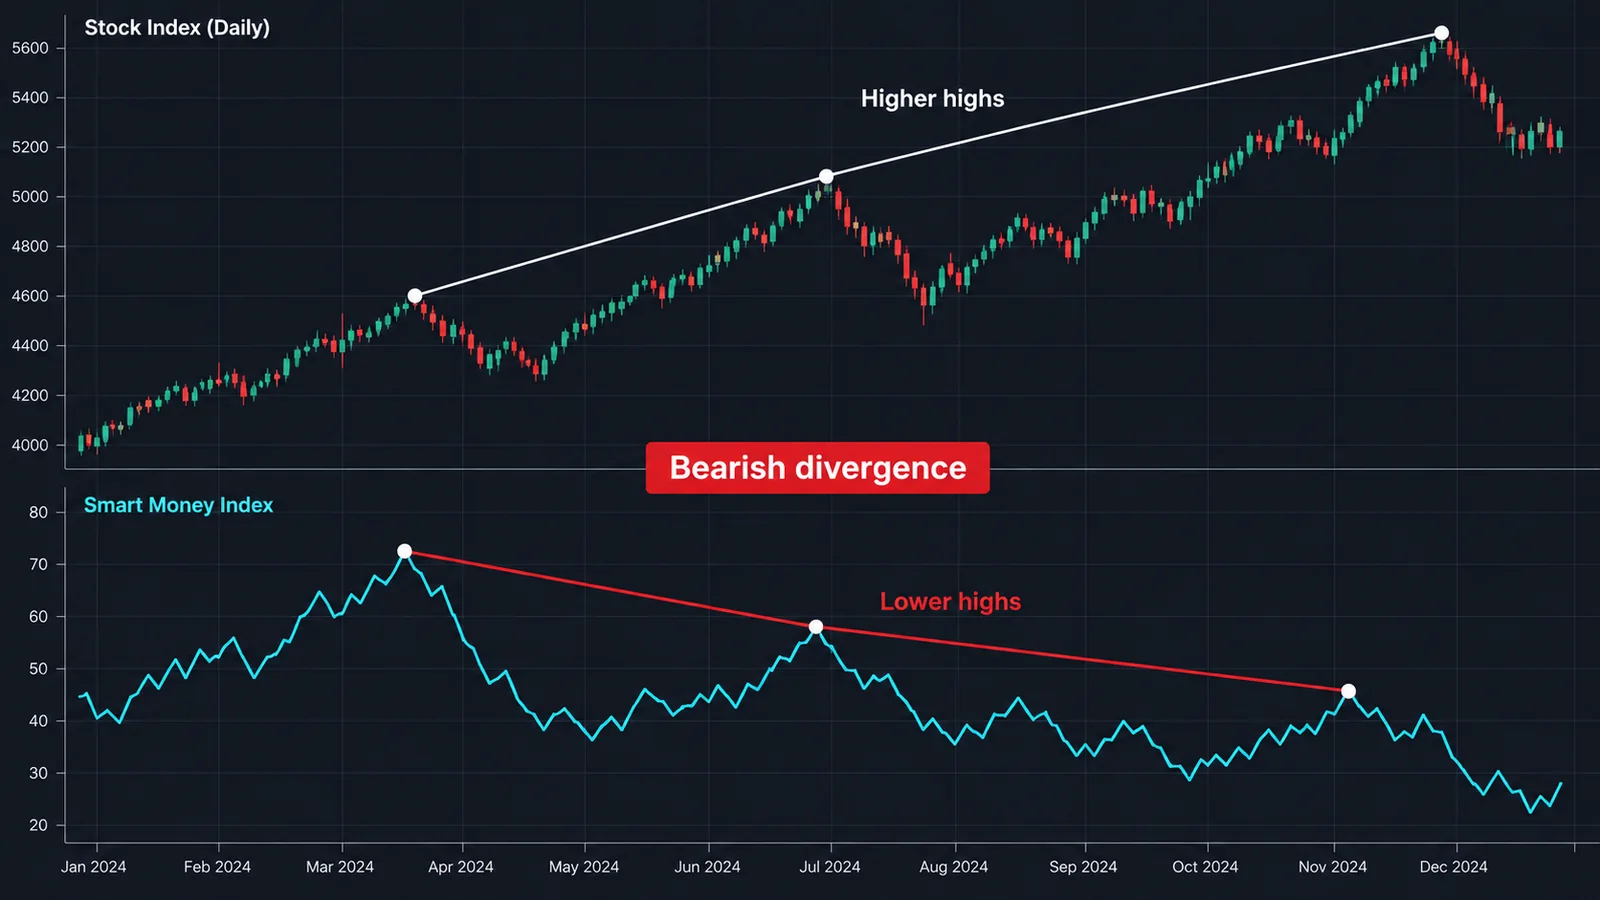
The indicator is read almost entirely through divergence with the market:
- Bearish divergence: the stock market makes higher highs while the Smart Money Index makes lower highs or trends down. The rally is happening in the morning and fading into the close; the theory says professionals are using the strength to sell.
- Bullish divergence: the market makes lower lows while the Smart Money Index rises or makes higher lows. Morning panic is being bought in the last hour.
- Confirmation: both move the same way. A rising market with a rising index is a healthy trend in this framework.
Divergences are meant to be read over weeks, not days. A single strong close or weak open changes little; what the indicator tries to capture is a persistent habit of the market over a stretch of sessions. Hays and later writers mostly used it to frame the bigger picture before major tops and bottoms, not to time trades.
The same idea can be applied without the index itself: compare the average performance of the first half hour with the last hour over the past month. If one keeps winning and the other keeps losing, you are looking at the same information.
Smart Money Index calculator
Enter one line per trading day with four prices for the index or ETF you follow: the open, the level 30 minutes after the open, the level one hour before the close and the close. You can read them off a 30-minute chart. The calculator builds the running index, compares its direction with the market over the same days and tells you whether it confirms or diverges.
Does the Smart Money Index still work?
The open-versus-close logic made more sense in the 1990s than it does today. Several things have changed:
- The closing auction has grown. Index funds, ETFs and many institutional benchmarks trade at the closing price, so a large share of daily volume now goes through market-on-close orders. That flow is mechanical, not "smart": it reflects fund inflows and index rebalancing, not anyone's view of the market.
- Overnight trading matters more. Futures trade almost around the clock, and a large share of the stock market's long-term return has come overnight rather than during the session. Where the index measures the morning move from changes how much of that gap it captures.
- Professionals trade all day. Algorithms split large orders across the whole session using VWAP and TWAP schedules, so the last hour is no longer a clean window for institutional decisions.
- Retail is not only at the open. Options activity, especially very short-dated options, and retail order flow are spread through the day.
Research on the indicator is thin, and published claims about its record mostly come from its promoters. Treat it as a sentiment overlay with a sensible story behind it, not a tested edge. It is most useful when it agrees with other evidence, such as market breadth, volume and price structure.

Automate your trades. Let Quantum Algo trade for you.
Every signal executed on your own account — on your account, with the plan you define.
How do you use the Smart Money Index in practice?
- Use it on a broad US index: the Dow, the S&P 500 or SPY. It was not designed for single stocks, forex or crypto, which do not have the same open and close structure.
- Look for divergences lasting weeks, at the same time the market is stretched or testing a major level.
- Confirm with price: a bearish divergence matters when the market also breaks a rising trendline or its last higher low; a bullish one matters when price reclaims a level. On its own, the index can diverge for months.
- Cross-check with volume-based tools such as On-Balance Volume or the Accumulation/Distribution line. If they tell the same story, the case is stronger.
- Watch the calendar: index rebalancing days, options expiration and quarter-end produce huge closing-auction volume that has nothing to do with sentiment. Discount readings on those days.
For day traders there is a simpler takeaway hiding in the indicator: the first 30 minutes are often noisy and the last hour often shows where institutions want to finish the day. Many intraday traders avoid trading the open's first swing and pay close attention to the final hour for that reason.
Smart Money Index vs other "smart money" indicators
| Indicator | What it measures | Data needed | Main use |
|---|---|---|---|
| Smart Money Index | Market move in the first 30 minutes vs the last hour | Intraday index prices | Sentiment divergence on US indices |
| Commitments of Traders | Positions of commercials, large speculators and small traders in futures | Weekly CFTC report | Positioning extremes |
| On-Balance Volume | Volume added on up days and subtracted on down days | Daily price and volume | Volume confirming or diverging from price |
| Accumulation/Distribution line | Where the close falls within the day's range, weighted by volume | Daily OHLC and volume | Buying or selling pressure |
| Smart Money Concepts (SMC) | Liquidity, order blocks and structure on the chart | Price only | Entries and levels for any market |
The Smart Money Index and the Commitments of Traders report both try to separate informed from uninformed money, one by time of day, the other by type of trader. SMC uses the same phrase for something different: the footprints that large orders leave on a price chart.
Smart Money Index and Quantum Algo
The Smart Money Index tells you whether the close has been stronger or weaker than the open over recent weeks. It does not tell you where to enter, where to place a stop or when a trend has actually turned on your chart.
The free Quantum Algo indicators mark structure, liquidity sweeps and order blocks on TradingView, which is where a sentiment backdrop becomes a trade plan. Zeno, the premium engine from Quantum Algo (QuantumAlgo), prints signals with an entry, a stop and two targets on indices, stocks, gold, forex and crypto, and every call is on the public track record.
The Smart Money Index subtracts the market's move in the first 30 minutes and adds its move in the last hour, building a running total that is read through divergence with the index. Rising while the market falls is bullish; falling while it rises is bearish. Closing-auction flows, overnight trading and algorithmic execution have weakened its logic, so use it as a slow sentiment backdrop on US indices, confirmed by breadth, volume and price structure.
◆ Interactive check
How well do you know the Smart Money Index?
Questions traders ask about the Smart Money Index
A US stock market sentiment indicator that subtracts the index move in the first 30 minutes of each session and adds the move in the last hour, building a running total read through divergence with the market.
Today's value equals yesterday's value minus the change in the first 30 minutes plus the change in the last hour. The starting level is arbitrary; only the direction matters.
It was popularised by strategist Don Hays of Hays Advisory in the 1990s. A closely related series is published as the Smart Money Flow Index.
Look for divergences lasting weeks between the index and the market, then wait for price to confirm, for example by breaking a trendline or a recent swing. It is a backdrop, not an entry trigger.
Usually not. On TradingView "SMI" normally means the Stochastic Momentum Index, a momentum oscillator. The Smart Money Index is a different indicator built from intraday prices.
Not as designed. It depends on the US stock market's open and close; forex and crypto trade around the clock without the same structure.
Independent evidence is limited, and large closing-auction flows from index funds have weakened its premise. Use it alongside breadth, volume and price structure rather than on its own.
Some data vendors and sentiment services publish a version, and TradingView has community scripts that build it from intraday data. You can also calculate it yourself from a 30-minute chart.
References & Related Guides
Read next
- Advance/Decline Line
- On-Balance Volume
- Accumulation/Distribution Line
- Commitments of Traders report
- Stochastic Momentum Index
- Smart Money Concepts
- Wyckoff Method
- VWAP
- Institutional Trading Strategy
- Money Flow Index
- Free TradingView indicators
- Zeno — the premium engine