TRIX Indicator: Formula, Settings and How to Trade It
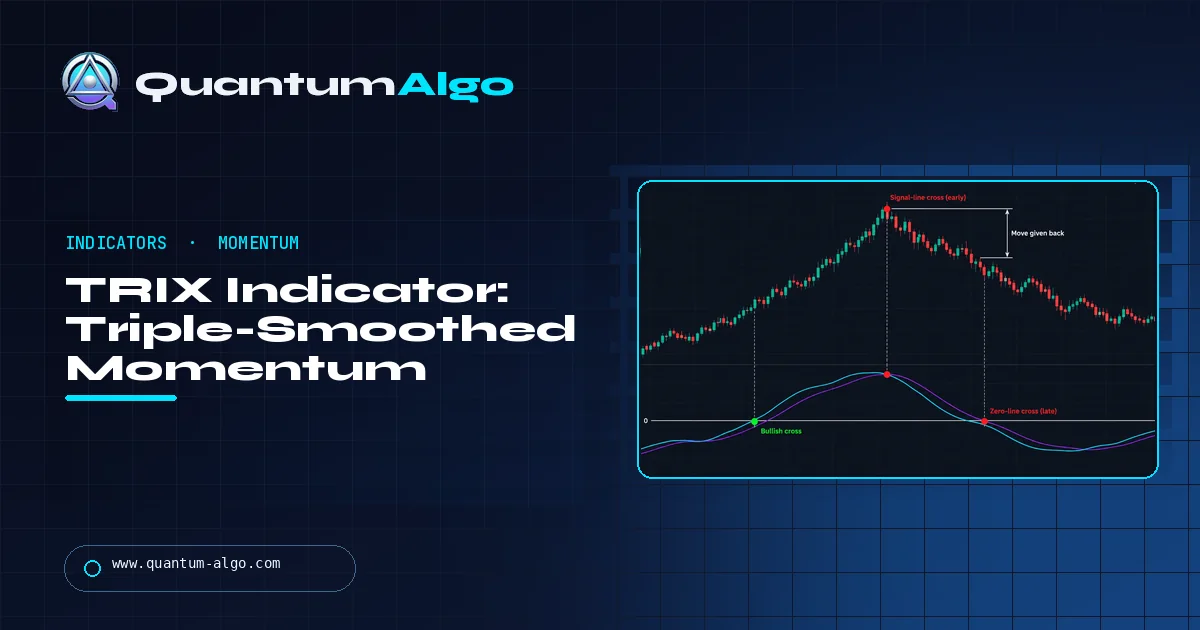
The TRIX indicator is the one-bar percentage change of a price series smoothed by three exponential moving averages, usually 15 periods each, plotted with a 9-period EMA signal line. Above zero means the smoothed trend is rising. Signal-line crosses give earlier timing, zero-line crosses confirm direction, and the triple smoothing filters noise at the cost of lag.
Three moving averages stacked on top of each other sounds like overkill, and for some jobs it is. TRIX smooths price three times and then measures the slope, which makes it one of the cleanest trend-momentum lines you can plot and one of the slowest to admit a trend has turned. Quantum Algo walks through Jack Hutson's original idea, the exact formula and its built-in lag, a bar-by-bar worked example, why TradingView's numbers look 100 times bigger, settings by timeframe, and the specific situations where TRIX costs you money.
Indicators that prove themselves in public.
One engine, four precision tools — the Gold (XAU) Scalper, the institutional Gravity Zone, the Zeno momentum Oscillator, and Zeno Stocks for equities.
Who created TRIX, and what problem was it solving?
TRIX comes from Jack K. Hutson, who had started publishing Technical Analysis of Stocks & Commodities only months before he introduced it. The magazine's own bibliography lists his article "Good Trix" in Volume 1 (July/August 1983), followed by "TRIX: Triple Exponential Smoothing Oscillator" in Volume 2 (March 1984). His colleague Anthony W. Warren added "Further Analysis Of Triple Exponential Smoothing" in Volume 1 (September/October 1983). The name is simply short for triple exponential smoothing.
The problem Hutson was attacking is the one every oscillator user still has: raw price is noisy, and a momentum line built on raw price flips direction on every minor wiggle. His answer was blunt. Smooth the price with an exponential moving average, smooth that average again, smooth it a third time, and only then measure how fast the result is changing. Three passes strip out most of the short cycles, so what remains is the slope of the underlying trend.
That design choice explains both what TRIX is good at and where it lets you down. It is excellent at telling you whether the trend's slope is rising or falling and at ignoring one-bar noise. It is late, by design, at telling you when a trend has turned. Keep both halves of that sentence in mind for the rest of this guide.
A naming warning before we go further. "TRIX" is not the same thing as "TEMA," the triple exponential moving average Patrick Mulloy published later, which is a lag-reduced moving average plotted on price. TRIX is an oscillator plotted in its own pane. Search results mix the two up constantly.
How is the TRIX indicator calculated?
For a lookback length n and closing prices C:
EMA1 = EMA(C, n)
EMA2 = EMA(EMA1, n)
EMA3 = EMA(EMA2, n)
TRIX = 100 × (EMA3[t] − EMA3[t−1]) / EMA3[t−1]
Signal = EMA(TRIX, s)
Each EMA uses the standard smoothing factor α = 2 / (n + 1), so a 15-period EMA weights the newest value by 0.125. TRIX itself is the one-bar percentage change of the triple-smoothed line, and the signal line is an EMA of TRIX. StockCharts uses 15 for n and 9 for the signal by default.
How much lag do three EMAs add?
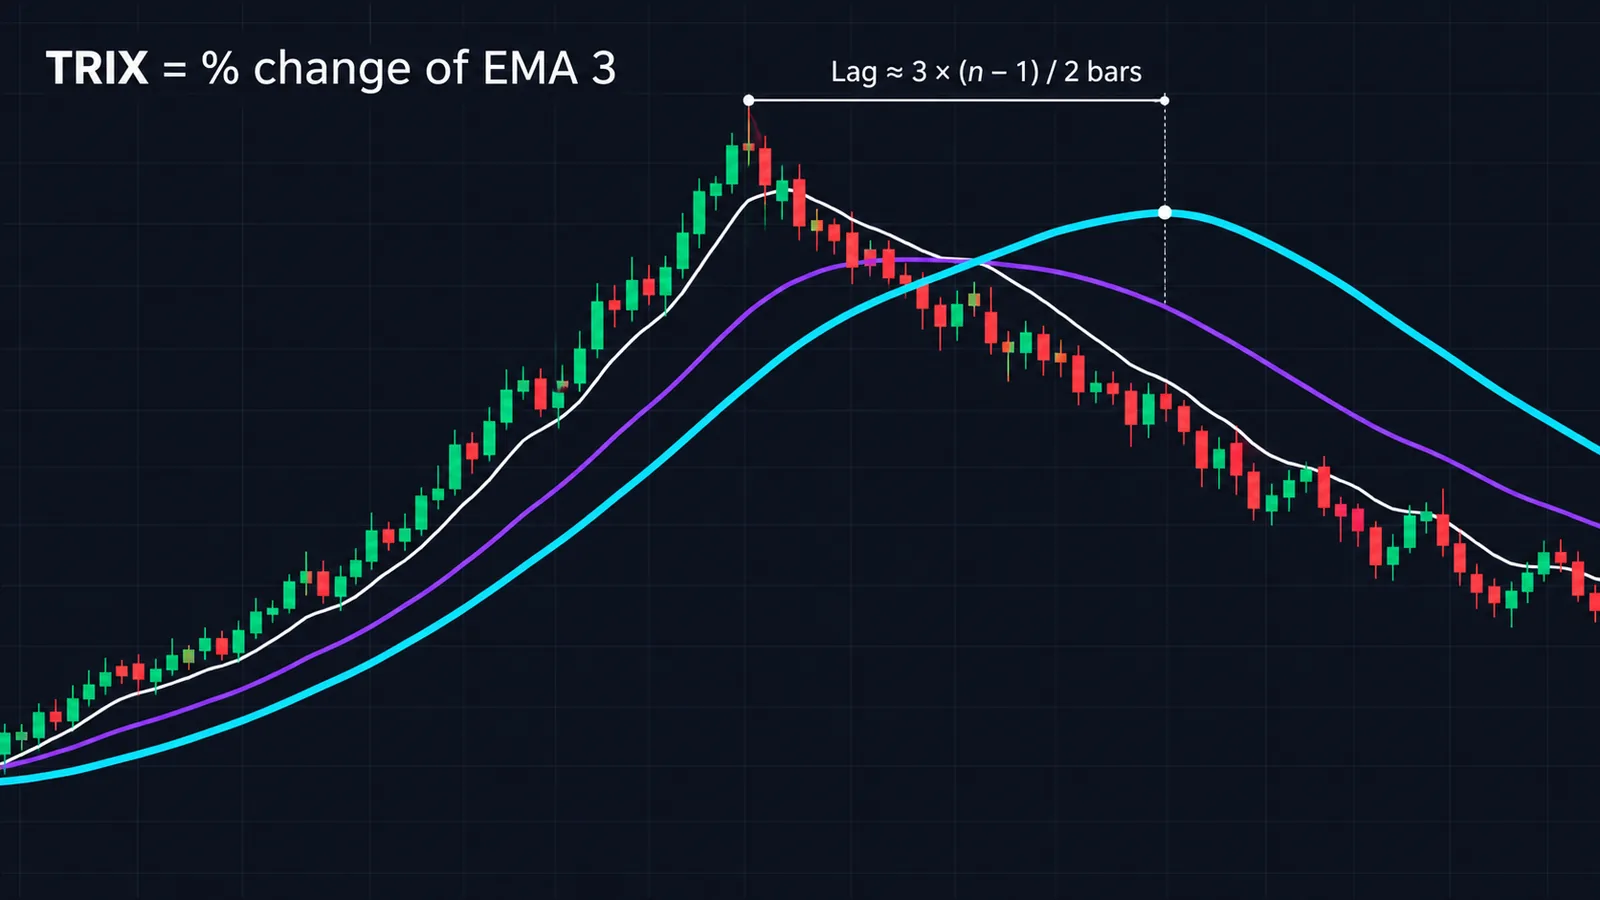
The average age of the data inside one EMA is (n − 1) / 2 bars. Stack three of them and the lag adds up to about 3 × (n − 1) / 2 bars. For the standard 15-period TRIX that is about 21 bars. On a daily chart, TRIX is effectively describing the slope of the trend as it was roughly a month earlier, smoothed. That is not a flaw to fix with clever settings; it is the price of the smoothness.
Two scalings you will run into
- Percent TRIX (StockCharts, most textbooks, the R package TTR): values like +0.05 mean the triple-smoothed line rose 0.05% on the last bar.
- TradingView's built-in TRIX: an open-source port of it describes the calculation as 10,000 times the one-bar change of a triple EMA of the logarithm of the close, with a default length of 18. Because a small change in a log equals a percentage divided by 100, the TradingView number is about 100 times the percent version. A TradingView reading of +5 is roughly a +0.05% TRIX elsewhere.
The shape and the zero crossings are effectively the same. Only the axis changes, which is why thresholds copied from one platform look absurd on another.
Warm-up
The first TRIX value needs three seeded EMAs plus one bar for the change, which is 3 × (n − 1) + 2 bars, or 44 bars for n = 15. The signal needs a further s − 1 bars. Early values also depend on how each EMA is seeded (some platforms start with the first price, others with a simple average), so give the indicator a few hundred bars of history before trusting the exact numbers. Our calculator below uses an SMA seed for each pass.
A worked TRIX example, bar by bar
To keep the arithmetic followable, here is TRIX with n = 3 and a 3-bar signal on fifteen closes. The rally runs to 107.50 on bar 9, then rolls over. Every number below was computed with the formula above (SMA seed for each EMA, α = 0.5).
| Bar | Close | EMA3 (triple) | TRIX % | Signal % |
|---|---|---|---|---|
| 7 | 104.00 | 102.6192 | — | — |
| 8 | 106.00 | 103.3769 | +0.7383 | — |
| 9 | 107.50 | 104.2774 | +0.8711 | — |
| 10 | 107.00 | 105.0859 | +0.7753 | +0.7949 |
| 11 | 106.00 | 105.5928 | +0.4824 | +0.6387 |
| 12 | 104.50 | 105.6720 | +0.0750 | +0.3568 |
| 13 | 103.00 | 105.3242 | −0.3292 | +0.0138 |
| 14 | 102.50 | 104.7438 | −0.5510 | −0.2686 |
| 15 | 101.00 | 103.9566 | −0.7516 | −0.5101 |
The full close series was 100, 101, 102.5, 102, 103.5, 105, 104, 106, 107.5, 107, 106, 104.5, 103, 102.5, 101. Bar 8's TRIX, for instance, is 100 × (103.3769 − 102.6192) / 102.6192 = +0.7383%.
What the table teaches:
- TRIX peaked with price here, but only because n = 3. With such a short length, the lag is about 3 bars. With n = 15 the peak in TRIX would trail the price peak by much more.
- The signal line flagged the turn first. From bar 10, TRIX is below its signal while the close is only 0.5% under the high.
- The zero-line cross came late. TRIX turns negative on bar 13, with the close at 103.00, about 4.2% below the 107.50 high. The triple EMA itself peaked on bar 12 at 105.6720, which is what a zero cross really marks: the turning point of the smoothed line, not of price.
Paste those closes into the calculator below with length 3 and signal 3 and you will get the bar-15 values: TRIX −0.7516%, signal −0.5101%. The calculator also shows the TradingView-scale value for the same data, about −75.9, which illustrates the roughly 100× scaling difference.
How to read TRIX: signal crosses, zero line and divergences
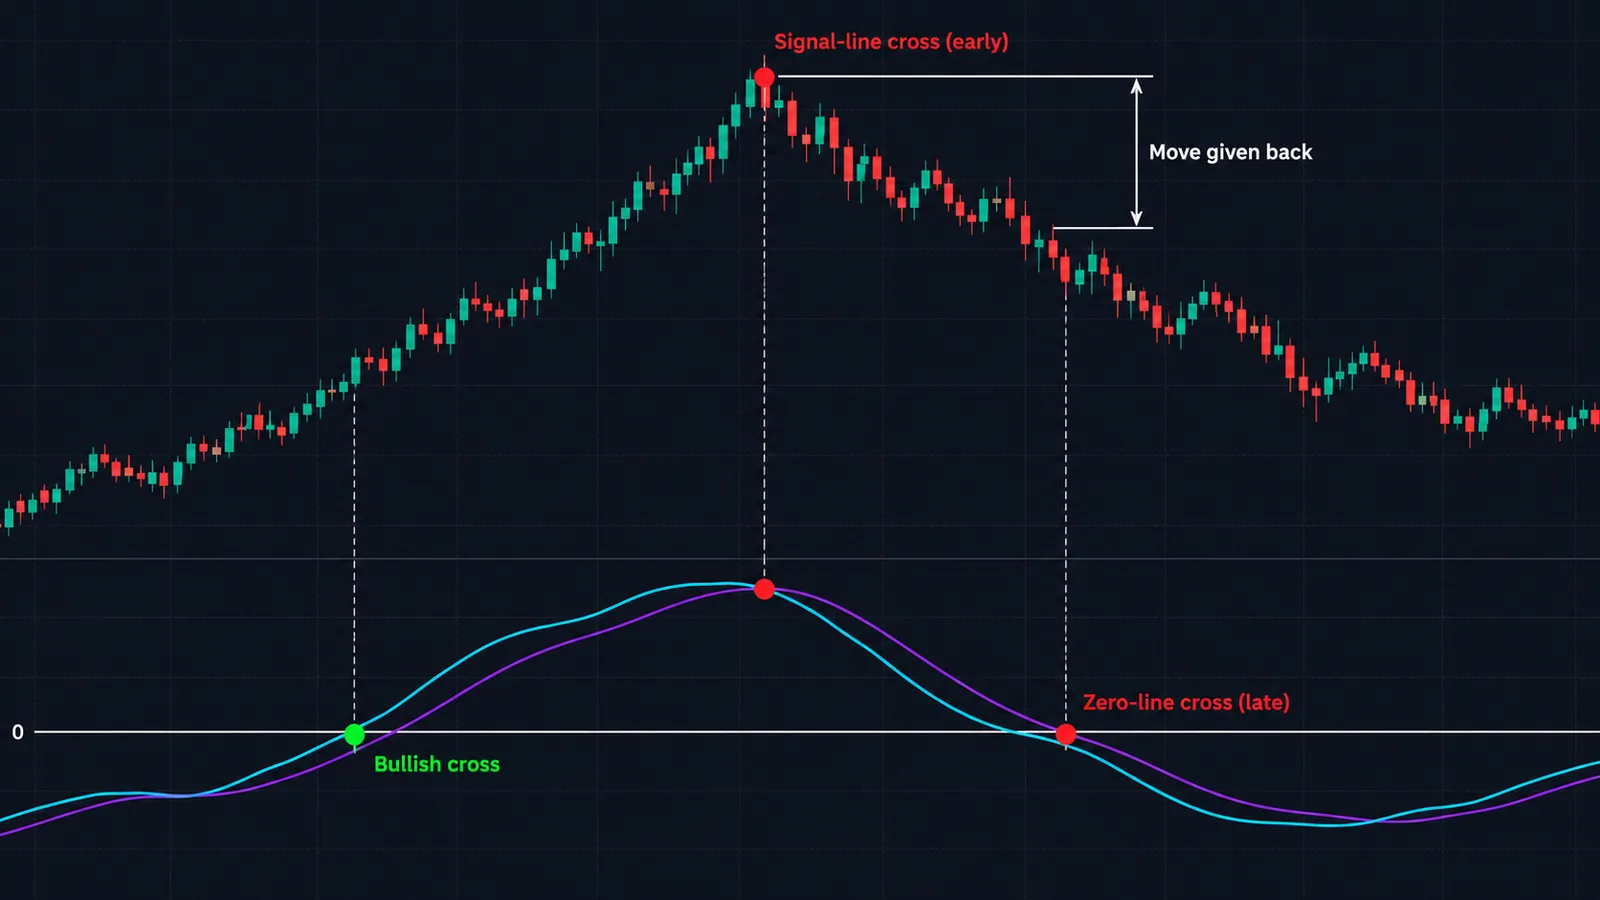
TRIX gives three kinds of information. They are not equally reliable, and they work best on different settings.
Signal-line crossovers
StockCharts calls these the most common TRIX signal: bullish when TRIX turns up and crosses above its signal, bearish when it crosses below. They come earliest, which makes them the most useful for timing and the most prone to whipsaw. In StockCharts' own Intel example, six signal-line crosses over seven months produced three good signals and three whipsaws. That 50% hit rate is honest and typical. Crossovers need a filter.
Zero-line crossovers
TRIX above zero means the triple-smoothed line is rising; below zero, falling. Treat the zero line as a trend-bias switch rather than an entry trigger. StockCharts' Raytheon example shows five centerline signals over 16 months, including a November 2009 buy before a roughly 20% advance and a May 2010 sell before a decline of around 20%. Few signals, large moves, late entries.
Divergences
Bullish divergence: price makes a lower low while TRIX makes a higher low. Bearish divergence: price makes a higher high while TRIX makes a lower high. Because TRIX is so smooth, its divergences are easy to see and draw. StockCharts warns that they do not work well against strong trends: bearish divergences in strong uptrends and bullish ones in strong downtrends tend to fail. A slowing uptrend still produces lower TRIX highs, because TRIX measures slope, and a trend that keeps rising at a slower pace is still a trend.
If divergence trading is your main interest, compare TRIX divergences with those on the RSI, which turns faster and gives more, noisier divergences, and our Relative Vigor Index guide, which looks at where closes sit within each bar.
Best TRIX settings by timeframe
There is no consensus default. Here is what the major references actually use:
| Source | TRIX length | Signal | Scale |
|---|---|---|---|
| StockCharts ChartSchool | 15 | 9 (EMA) | Percent |
| TradingView built-in | 18 | None | 10,000 × change of log triple EMA |
| R package TTR | 20 | 9 | Percent |
| Incredible Charts | 12 | 9 (EMA) | Percent |
The lag formula gives a more useful way to choose. Pick the length whose built-in lag you can live with on your timeframe:
| Use case | Starting length / signal | Approx. lag in bars | Notes |
|---|---|---|---|
| Intraday, 5- to 15-minute | 9 / 5 | 12 | Use only signal crosses in the direction of a higher-timeframe trend |
| Intraday, 1-hour | 12 / 7 | 16.5 | Roughly two to three stock-market sessions of lag |
| Swing, daily | 15 / 9 | 21 | The StockCharts default; about one trading month |
| Position, daily | 30 / 9 | 43.5 | Zero-line as a trend filter |
| Position, weekly | 12 to 15 / 9 | 16.5 to 21 | Four to five months of lag; very few signals |
The lengths in the second table are our starting points, not tested optima. StockCharts' own guidance matches the logic: shorter lengths such as 5 make TRIX more sensitive and better for centerline crossovers, longer lengths such as 45 make it smoother and better suited to signal-line crossovers. Whatever you pick, test it on the instrument you trade. For a list of indicators that pair well on daily charts, see our best indicators for swing trading.
TRIX vs MACD and PPO: what is actually different?
All three are built from exponential moving averages, so traders often ask whether TRIX adds anything. Mechanically:
| Indicator | Calculation | Units | Character |
|---|---|---|---|
| MACD (12, 26, 9) | EMA12 − EMA26, signal = EMA9 | Price points | Faster, noisier; values not comparable across instruments |
| PPO (12, 26, 9) | (EMA12 − EMA26) / EMA26 × 100 | Percent | MACD in percentage terms; comparable across instruments |
| TRIX (15, 9) | 1-bar % change of triple EMA | Percent per bar | Smoother, later; slope of a heavily smoothed trend |
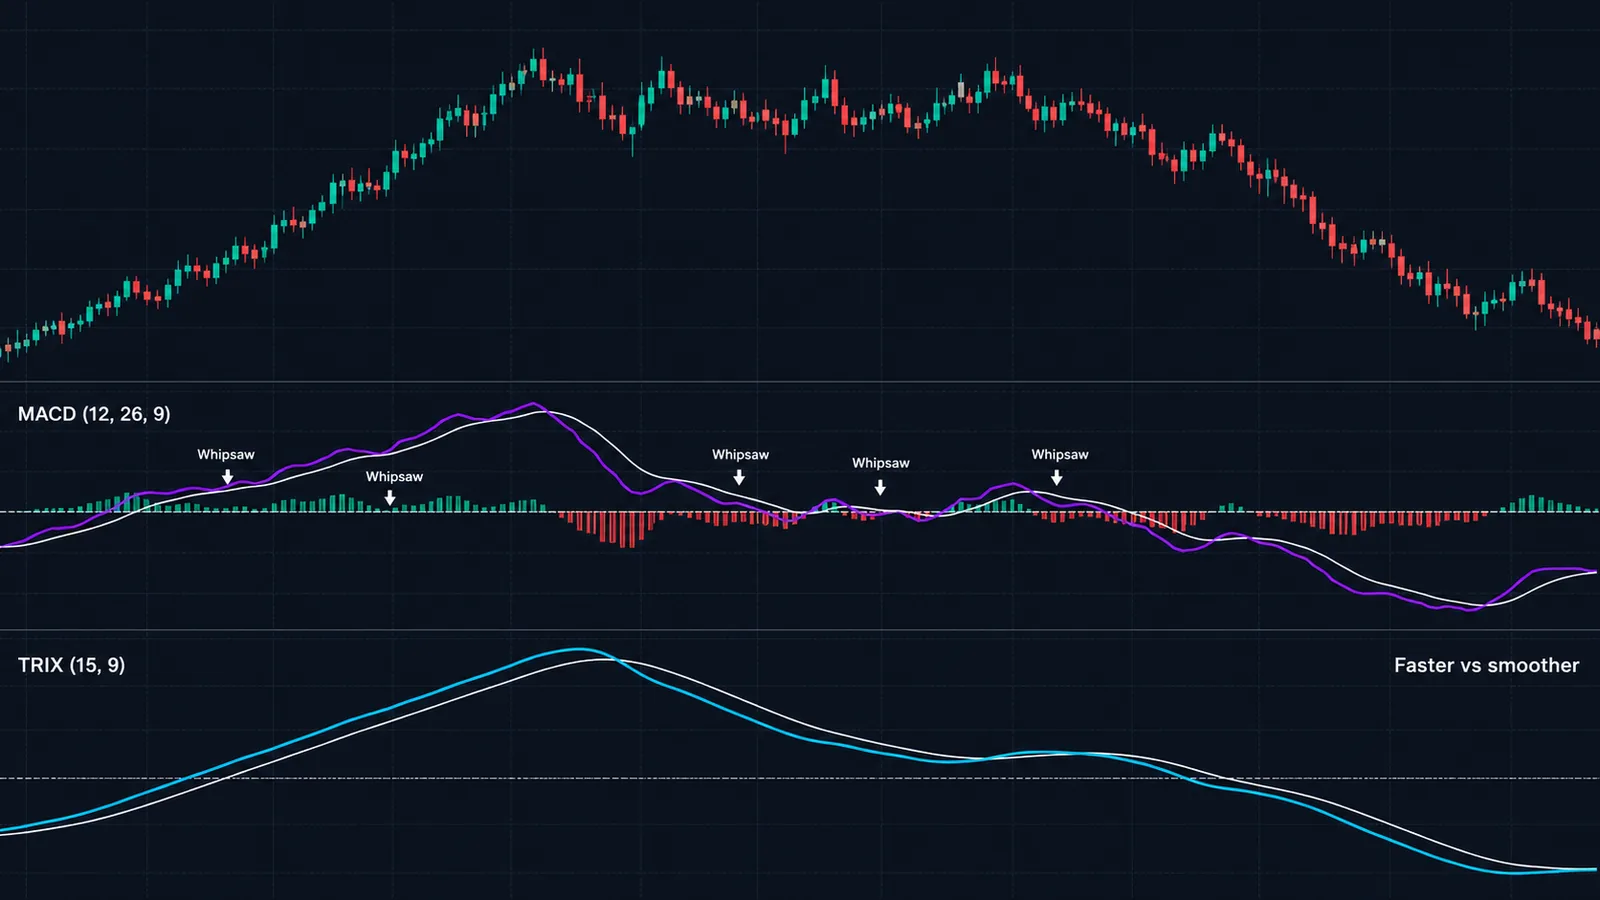
MACD measures the gap between a fast and slow average. TRIX measures the slope of one heavily smoothed average. In practice they often cross zero in similar places on trending charts, and StockCharts notes that TRIX lines are smoother and tend to turn a bit later than MACD.
When to prefer which:
- Choose MACD for faster momentum shifts and a huge base of published examples. Our MACD guide covers the histogram, which has no standard TRIX equivalent.
- Choose PPO or TRIX when you compare momentum across instruments with very different prices, such as a $20 stock and a $900 stock, or one stock across a decade of price growth.
- Choose TRIX when MACD whipsaws too much on your market and you accept later signals in return for fewer of them.
Running both on the same chart is mostly redundant. Pairing TRIX with a different kind of input, such as trend strength from the ADX, gives you more independent information. Other ways of attacking the same lag-versus-noise trade-off include adaptive averages like the Kaufman Adaptive Moving Average, the McGinley Dynamic and the ALMA, plus the Hull Moving Average.
How to add TRIX with a signal line on TradingView
TradingView ships TRIX as a built-in indicator, but the built-in version plots a single line with a zero level and no signal line, and it uses the log-based, 10,000× scale. Two ways to set it up:
Option 1: built-in plus a moving average on it
- Open Indicators, search "TRIX," and add it. Set Length to 15 if you want to match StockCharts-style examples (the default is 18).
- Open Indicators again, add "Moving Average Exponential," then in its settings set Source to the TRIX output and Length to 9. Move it into the TRIX pane if TradingView places it on the price chart.
- Remember the axis: a reading of 5 on TradingView is about 0.05% on StockCharts.
Option 2: a short Pine Script v6 indicator
This version matches the textbook percent formula and adds a signal line and alerts:
//@version=6
indicator("TRIX + Signal", format = format.price, precision = 4)
len = input.int(15, "TRIX length", minval = 1)
sigLen = input.int(9, "Signal length", minval = 1)
e3 = ta.ema(ta.ema(ta.ema(close, len), len), len)
trix = 100 * (e3 - e3[1]) / e3[1]
sig = ta.ema(trix, sigLen)
plot(trix, "TRIX", color.aqua)
plot(sig, "Signal", color.purple)
hline(0, "Zero")
alertcondition(ta.crossover(trix, sig), "TRIX bull cross", "TRIX crossed above signal")
alertcondition(ta.crossunder(trix, sig), "TRIX bear cross", "TRIX crossed below signal")
Because every input is a completed bar's close, the line does not change once a bar closes, so it does not repaint on historical bars. The current, unfinished bar will move until it closes, which is why alerts should be set to fire once per bar close. Our non-repaint indicators guide explains why that setting matters. New to the platform? Our TradingView platform guide covers panes, alerts and templates.
A TRIX trend-pullback rule set you can test
TRIX on its own trades too late on zero crosses and too often on signal crosses. The fix most practitioners use is to let a slower filter set the direction and use TRIX only for timing. StockCharts' suggested scans follow exactly this logic, and here is a version you can backtest on a daily chart:
- Trend filter: close above its 200-day simple moving average for longs, below it for shorts. Our moving averages guide covers the 200-day in depth.
- Pullback condition: TRIX(15) below zero in an uptrend, meaning the smoothed slope has dipped during a pullback. Mirror for shorts.
- Trigger: TRIX crosses above its 9-period signal line.
- Participation check: volume on the trigger bar above its average. StockCharts uses a 250-day volume average in its scan.
- Exit: a fixed stop below the pullback low and either a trailing stop or a TRIX cross back below its signal once TRIX is above zero.
A numeric sanity check on risk. Suppose a stock in an uptrend closes at $84.20 on the trigger bar, the pullback low was $80.90 and you risk 1% of a $30,000 account, $300. The stop distance is $3.30, so the position is 90 shares ($300 / $3.30 = 90.9, rounded down). If the stock regains its prior swing high at $91.10, the gain is $6.90 a share, or $621 on 90 shares, a 2.1 to 1 reward-to-risk.
What we can and cannot say about results: we found no peer-reviewed study showing a durable edge for TRIX crossovers on modern data, and StockCharts' own examples show both clean wins and whipsaws. Treat this as a hypothesis. Run it through TradingView's Strategy Tester or your own code, include commissions and slippage, and compare it with a plain 200-day filter with no TRIX at all. If TRIX does not beat the filter alone, it is adding complexity, not edge.
Does TRIX behave differently in stocks, forex, futures and crypto?
Because TRIX is a percentage rate of change, the same settings produce readings on a similar scale across instruments, which is one of its real advantages over MACD. The data feeding it still differs by market, and those differences show up in the line.
- Stocks: overnight gaps are the main issue. An earnings gap of 8% enters all three EMAs at once and keeps TRIX inflated for weeks on a daily chart, even if price goes nowhere afterward. On intraday charts, each session's opening gap does the same thing on a smaller scale.
- Forex: major pairs move only fractions of a percent per day, so percent TRIX values are tiny, often in the hundredths or thousandths of a percent. The signals are fine; the axis just looks empty. Do not mistake small numbers for weak momentum, and compare a pair only with its own history.
- Futures: continuous contracts roll from one expiry to the next. If your chart is not back-adjusted, the roll can insert an artificial jump that TRIX treats as a real move. Use a back-adjusted continuous series for anything longer than a few weeks of history.
- Crypto: markets trade around the clock, so there are no session gaps and daily bars are cleaner for TRIX. The higher volatility means more signal-line crosses at the same length; many traders lengthen TRIX on crypto to keep the cross count manageable.
Across all four, the rule is the same: calibrate on the instrument and timeframe you trade, and judge a reading against that instrument's own range rather than a universal number. If you want an indicator built around long-horizon momentum turns on indexes, the Coppock Curve solves a related problem with a different construction.
When TRIX fails: common mistakes
- Trading zero crosses as reversals. In the worked example the zero cross came with price already 4.2% off the high at n = 3. At n = 15 on a daily chart, the zero cross routinely gives back a large share of the move. Use it as a bias switch, not a reversal signal.
- Using signal crosses in sideways markets. When price chops in a range, TRIX hovers near zero and crosses its signal repeatedly. StockCharts notes that volatility increases the number of crossovers. Check trend strength first; an ADX below roughly 20 is a common "stand aside" filter.
- Copying thresholds across platforms. A "+0.1 is overbought" rule from a percent-scale chart means nothing on TradingView's 10,000× log scale, where the same move reads about +10.
- Treating TRIX as overbought/oversold. TRIX is unbounded. A high reading means a steep trend, not an exhausted one. If you want bounded readings, the Stochastic RSI and similar tools are designed for that.
- Too little history. With n = 15, the first value appears after 44 bars and seeding effects linger longer. Short histories on new listings or freshly loaded intraday charts give unreliable values.
- Gaps and thin markets. One large overnight gap feeds all three EMAs and lingers in TRIX for weeks on a daily chart. Thinly traded instruments produce erratic closes that the smoothing hides rather than fixes.
- Fading divergences in strong trends. As covered above, a decelerating trend makes lower TRIX highs while price still climbs. Divergence is a reason to tighten stops, not to short.
- Stacking near-identical oscillators. TRIX, MACD, PPO and the Awesome Oscillator are all moving-average derived. Agreement among them is not independent confirmation.
TRIX Indicator and Quantum Algo
TRIX is at its best as a slow, clean read of trend slope, which makes it a natural filter rather than an entry engine. That is the role we would give it alongside Quantum Algo tools.
- TRIX as the filter, Zeno for timing. Zeno's buy and sell signals come with a stop and targets built in. On a daily chart, taking only the Zeno signals that agree with the side of zero TRIX is on is a simple rule to test, and Zeno Oscillator can add a second view of momentum on the trading timeframe.
- Free tools for the momentum side. If you want the faster MACD-family view next to TRIX, our free open-source MACD Matrix covers it, and the Multi-Oscillator Divergence Scanner helps check whether a TRIX divergence is showing up on other oscillators too.
- Learn the price side. The free QuantumAlgo Academy covers the structure and levels that tell you where a TRIX signal is worth taking.
You can see how Zeno signals have actually played out on the public track record. TRIX will not make a weak setup good, but it is very good at keeping you on the right side of the trend.
◆ Interactive check
How well do you know TRIX?
Questions traders ask about TRIX
TRIX is a momentum oscillator that shows the one-bar percentage change of a price series smoothed three times by exponential moving averages. Positive values mean the smoothed trend is rising, negative values mean it is falling.
StockCharts uses 15 for the TRIX length and 9 for the signal line, TradingView's built-in defaults to 18 with no signal, and the R package TTR uses 20 and 9. Choose by lag: each length adds about 1.5 × (n − 1) bars of delay, so shorter lengths suit intraday timing and longer lengths suit trend filtering.
Neither is better in general. MACD turns sooner and suits faster momentum reads, while TRIX is smoother, percentage-based and later, which cuts whipsaws in choppy markets. See our MACD guide for the comparison side.
The most common approach uses the zero line for direction and signal-line crosses for timing in that direction, with a slower trend filter such as the 200-day moving average. Divergences are better used as a reason to tighten stops than as reversal entries.
It means the triple-smoothed moving average has changed direction. Because of the smoothing, that turn usually happens well after price has turned, so a zero cross confirms a trend change rather than catching it early.
TradingView's built-in TRIX multiplies the change of a triple EMA of the log of price by 10,000, while most other sources plot a plain percentage change. The result is roughly 100 times larger on TradingView, with the same shape and zero crosses.
The built-in TRIX plots a single line with a zero level. Add an EMA of the TRIX output as a second indicator, or use a short Pine Script that plots both lines and sets alerts.
It is a lagging indicator. Triple smoothing adds roughly 3 × (n − 1) / 2 bars of delay, about 21 bars at the common 15 setting. Its signal-line crosses are the earliest part of the indicator, and divergences can hint at slowing momentum before the zero cross.
No. TRIX is an oscillator showing the rate of change of a triple-smoothed EMA, plotted in its own pane. TEMA is a lag-reduced moving average plotted on the price chart, built from a different combination of EMAs.
A TRIX built on closing prices does not change once a bar closes. The value on the current, unfinished bar moves until the close, so set alerts to trigger once per bar close.
References & Related Guides
Read next
- MACD Indicator
- Moving Averages
- RSI Indicator
- ADX Indicator (Average Directional Index)
- Hull Moving Average
- Coppock Curve
- Relative Vigor Index
- What Are the Best Indicators for Swing Trading?
- Kaufman Adaptive Moving Average (KAMA)
- McGinley Dynamic
- Free TradingView indicators
- Zeno — the premium engine
Primary sources
- Technical Analysis of Stocks & Commodities — Charting The Market (TRIX and Jack Hutson bibliography)
- StockCharts ChartSchool — TRIX
- TradingView Help Center — TRIX
- Indie Script — TRIX built-in port (log close, 10000× scaling, length 18)
- CRAN TTR documentation — TRIX
- Incredible Charts — TRIX Indicator
- Wikipedia — Trix (technical analysis)