Dealing Range
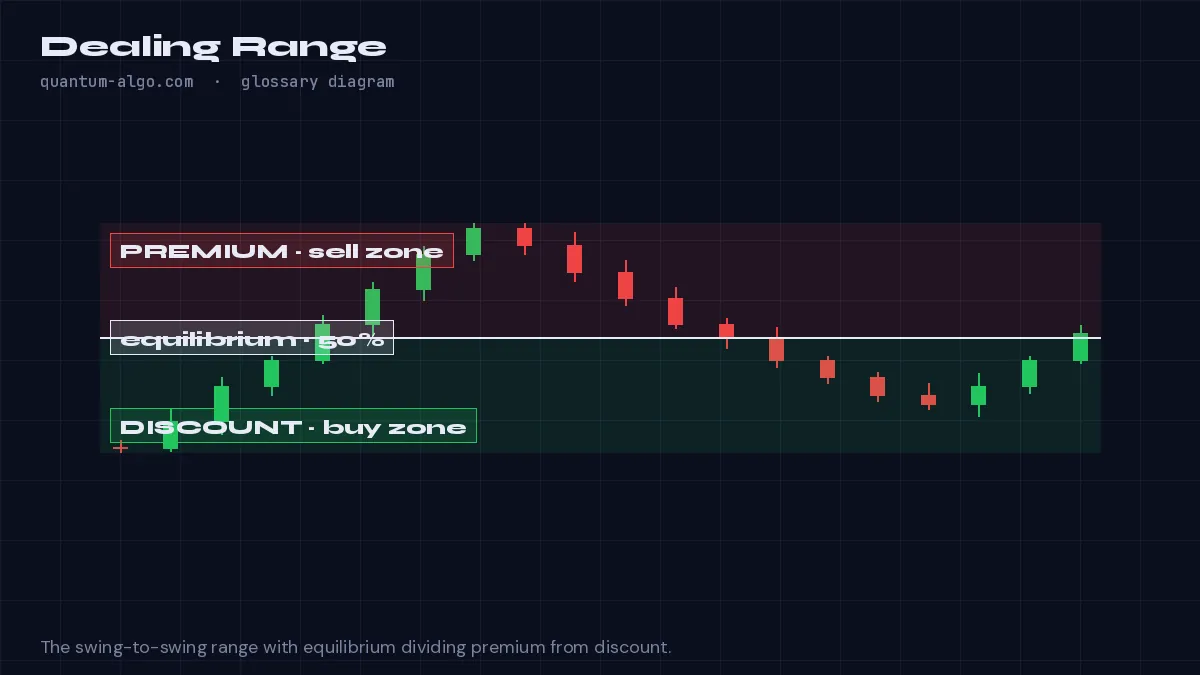
A dealing range is the price range between the most recent significant swing low and swing high — the frame within which premium and discount, equilibrium and the next liquidity targets are measured.
What it means
In Smart Money analysis every zone is judged relative to a dealing range: the distance between the last meaningful swing low and swing high on the timeframe you trade. Its midpoint is equilibrium; above it is premium, below it discount. Longs are sought in discount, shorts in premium, and the range extremes are where liquidity rests.
The range is redrawn each time structure changes. A break of structure to the upside sets a new swing high and the range expands; a change of character resets it in the other direction. Traders often keep two dealing ranges — the higher-timeframe one for bias and the lower-timeframe one for entries.
Choosing the wrong range is the most common error: a range drawn from an insignificant swing gives a meaningless equilibrium. Use the swings that produced displacement and broke structure.
How to identify it on a chart
- Mark the last swing low and swing high that produced a break of structure.
- Draw the range between them and its 50% line.
- Locate order blocks and gaps relative to the range: discount for longs, premium for shorts.
Worked example
On the 4-hour, BTC swung from 58,200 to 66,800; that is the dealing range. Equilibrium is 62,500, so the order block at 60,900 is a discount long location, while the one at 64,800 is only valid for shorts.
See it on the chart, read it in depth
Frequently asked questions
How do I pick the swing points for a dealing range?
Use the swings that created displacement and broke structure on your timeframe, not every minor pullback.
When does a dealing range change?
On a body close beyond either end — a new swing high extends it upward; a change of character can reset it downward.
Is a dealing range the same as a consolidation?
No. A consolidation is sideways price; a dealing range is any swing-to-swing frame, including one inside a trend.
Which indicator draws it?
The Smart Money Concepts Engine plots the active range with premium and discount shading and equilibrium.
Related terms
See Dealing Range on your TradingView chart
Zeno reads Smart Money structure across timeframes and prints the entry, stop and targets — with a public record of every posted trade. The free indicators draw the concepts this page defines.