Unicorn Model
The Unicorn model is an ICT setup where a breaker block and a fair value gap overlap at the same price — two independent institutional references stacked — giving one of the highest-probability entries in the methodology.
What it means
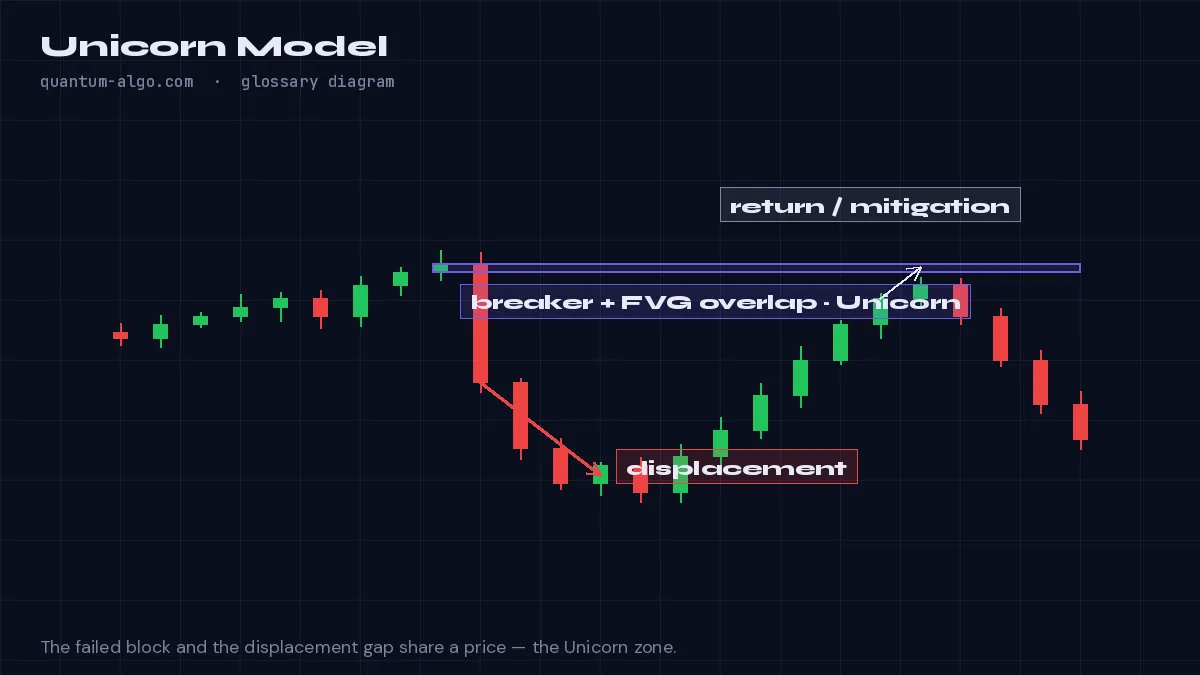
The Unicorn is a confluence setup: after a liquidity sweep and a change of character, the failed order block (now a breaker) is overlapped by a fair value gap created by the displacement. That overlap zone is the Unicorn. Two reasons for price to react at one level make it rarer and more reliable than either alone — hence the name.
The sequence is strict: liquidity taken, structure broken with displacement, a breaker formed from the swept side, and the FVG from the displacement leg sitting inside or touching the breaker. The entry is the return to the overlap; the stop is beyond the breaker; the target is the opposite liquidity.
Because the model demands so much, it appears infrequently — a few times a week on intraday index and forex charts. Traders who wait for it accept fewer trades in exchange for a setup where the failure cases are well defined.
How to identify it on a chart
- Find a liquidity sweep followed by a change of character with displacement.
- Mark the breaker block from the swept side and the fair value gap from the displacement.
- If the two overlap, the overlap is the Unicorn zone — enter on the return to it.
Worked example
EURUSD sweeps the London high, displaces down through the last higher low and leaves a bearish FVG at 1.0872–1.0866. The failed bullish order block sits at 1.0875–1.0868 — overlap at 1.0872–1.0868 is the Unicorn; price returns, rejects, and runs the session low.
See it on the chart, read it in depth
Frequently asked questions
Why is it called the Unicorn?
Because the strict overlap of a breaker and an FVG is rare — and when it appears it is one of the cleanest entries in the ICT toolkit.
Does the FVG need to be fully inside the breaker?
Overlap is enough; the zone traded is the intersection of the two.
Which timeframe?
1–15 minute for the setup inside a 15-minute to 1-hour bias; the concept scales.
Can indicators find it?
The Fair Value Gaps + Inversion and Order Blocks with Volume scripts draw the two pieces; the overlap is read from the chart.
Related terms
See Unicorn Model on your TradingView chart
Zeno reads Smart Money structure across timeframes and prints the entry, stop and targets — with a public record of every posted trade. The free indicators draw the concepts this page defines.