Rejection Block
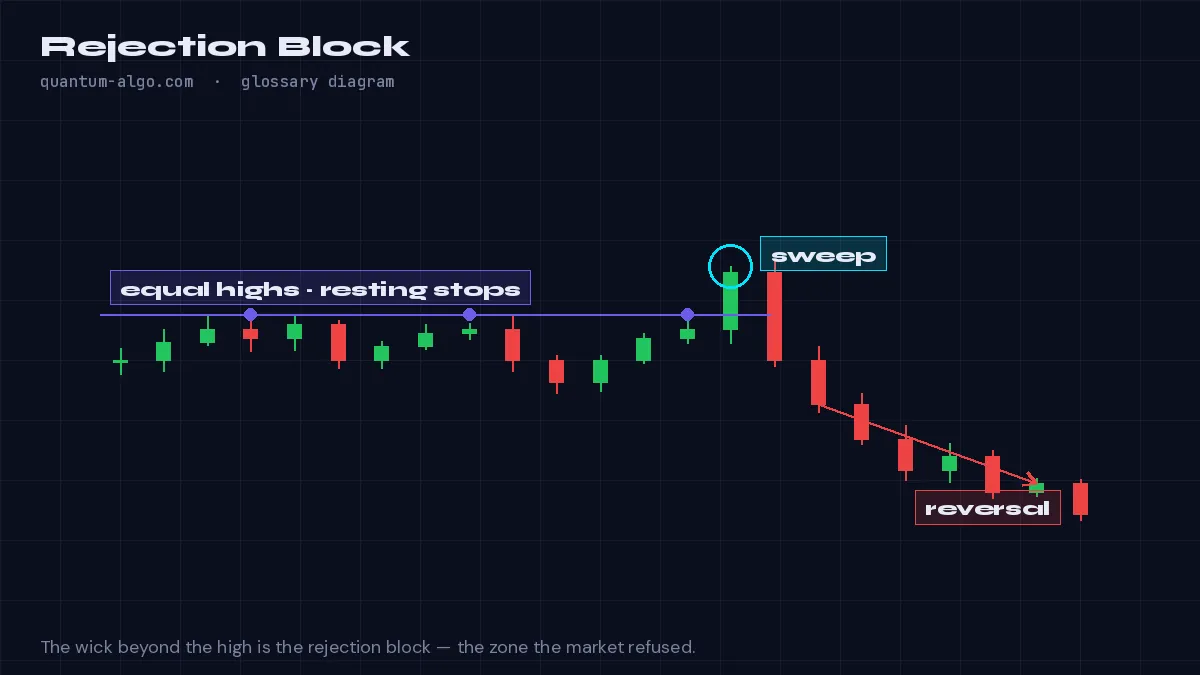
A rejection block is the wick zone of a candle that swept a high or low and closed back inside — the price region rejected by the market, which then acts as a point of interest on the next visit.
What it means
When a candle sweeps liquidity and closes back inside, its wick marks where the market said no. The rejection block is that wick: from the candle's close (or body edge) to the wick extreme. On a bearish rejection block price rallied into it and was sold; on a bullish one price dipped into it and was bought. The next return to the wick region often meets the same participants.
It is a smaller and more precise array than an order block. Where an order block uses a candle body before displacement, the rejection block uses a wick after a sweep. Both are PD arrays; the rejection block is favoured when the sweep candle has a very long wick and the body is small.
The rejection block is also the SMC reading of a pin bar: the wick is not the signal, the rejected price range is the zone.
How to identify it on a chart
- Find a candle that swept a high or low and closed back inside.
- Mark the zone from the body edge to the wick extreme.
- On the next visit into that zone, expect a reaction in the direction of the original rejection.
Worked example
A daily candle on gold wicks to 2,431 and closes at 2,404. The rejection block is 2,404–2,431. Three days later price rallies to 2,418, sells off, and the block has done its work.
See it on the chart, read it in depth
Frequently asked questions
How is a rejection block different from an order block?
An order block is the candle body before displacement; a rejection block is the wick left by a liquidity sweep. Different origins, same use as a point of interest.
Do I trade the whole wick?
The upper (or lower) portion of the wick is the higher-probability part; many traders use the 50% of the wick as the entry level.
Which timeframe?
Daily and 4-hour rejection blocks carry the most weight; intraday ones work but are less durable.
Is a pin bar a rejection block?
The same candle read differently: the pin bar is a pattern to trade immediately; the rejection block is the zone to trade on return.
Related terms
See Rejection Block on your TradingView chart
Zeno reads Smart Money structure across timeframes and prints the entry, stop and targets — with a public record of every posted trade. The free indicators draw the concepts this page defines.