Sortino Ratio: What It Measures, How It Differs From Sharpe, and What a Good Sortino Ratio Is
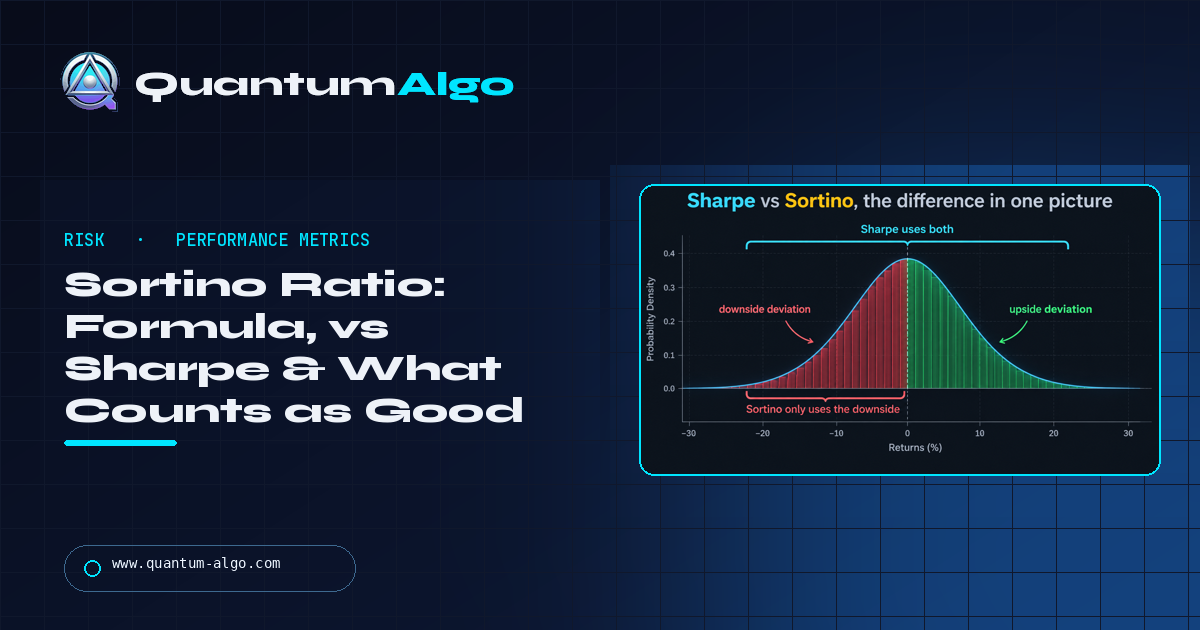
The Sortino ratio measures a strategy's return per unit of downside risk: the excess return over a target divided by the standard deviation of only the negative returns. It is the Sharpe ratio with the penalty for upside volatility removed, so it rewards strategies whose volatility comes from the good side — many small losses and occasional large wins, the profile of trend and structure strategies. Above 2 is good for a retail strategy, above 3 on a small sample is a warning, and the number means nothing without enough periods behind it.
Sharpe asks how bumpy the ride was; Sortino asks how bad the bad months were relative to what you earned, which is the question a trader actually cares about. This page is the difference in one picture, two strategies with the same Sharpe and different Sortinos, the formula with downside deviation step by step, the scale of what counts as good, the comparison with Calmar and profit factor, a worked twelve-month example and the checklist. The calculator below takes a return series and returns Sortino and Sharpe side by side.
Indicators that prove themselves in public.
One engine, four precision tools — the Gold (XAU) Scalper, the institutional Gravity Zone, the Zeno momentum Oscillator, and Zeno Stocks for equities.



What is the Sortino ratio?
The Sortino ratio measures a strategy's return per unit of downside risk: the excess return over a target (usually the risk-free rate or zero) divided by the standard deviation of only the negative returns. It is the Sharpe ratio with the penalty for upside volatility removed — Sharpe divides by all volatility, up and down alike, so a strategy with big winning months looks riskier than it is; Sortino divides by downside deviation only, so it rewards strategies whose volatility comes from the good side. For a trader, that is the right question: not how bumpy the ride was, but how bad the bad months were relative to what you earned. A Sortino above 2 is good for a retail strategy, above 3 on a small sample is a warning, and the number only means anything with enough trades behind it.
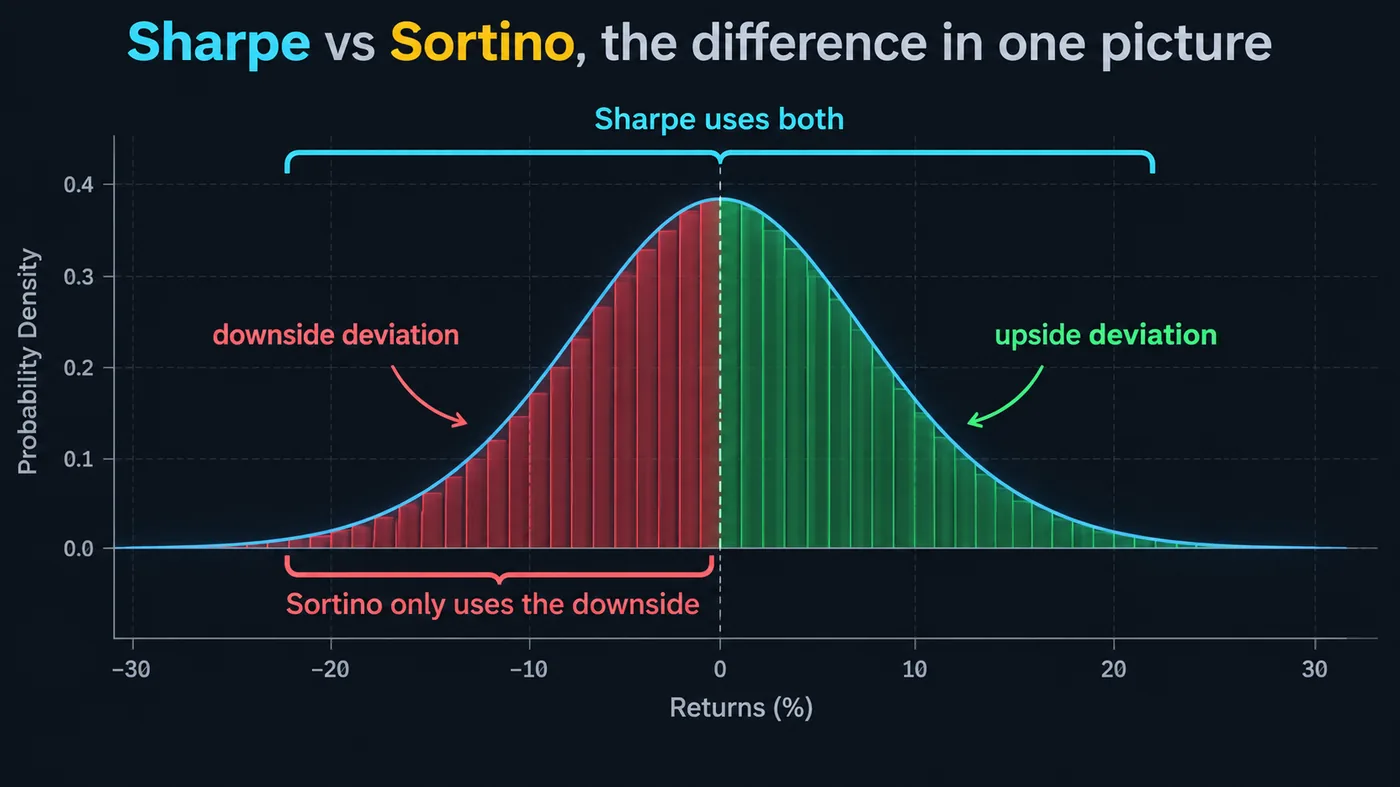
Sharpe versus Sortino, the difference in one picture
The distribution illustration in this guide shows a strategy's monthly returns as a bell-ish curve with the upside and downside halves shaded differently. Sharpe's denominator is the whole spread — the standard deviation of every return, including the large positive ones. Sortino's denominator is the shaded downside only — the deviation of returns below the target. Two strategies with the same average return and the same total spread can therefore have very different Sortino ratios if one gets its spread from big winners and the other from big losers.
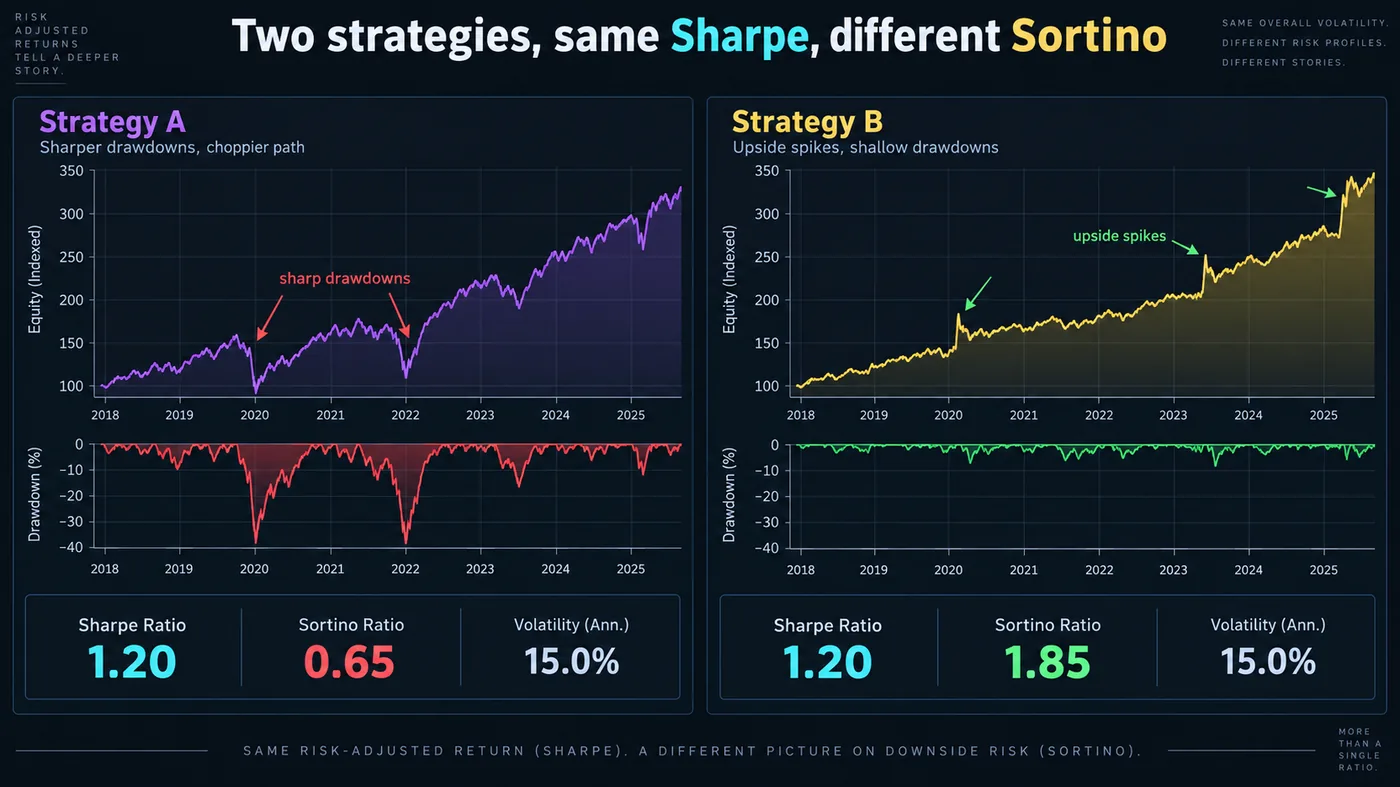
Two strategies, same Sharpe, different Sortino
The two-curve illustration in this guide makes the point concrete. Strategy A and Strategy B have identical average returns and identical overall volatility, so identical Sharpe ratios. But A's volatility comes from sharp drawdowns — a few months of −8% — while B's comes from sharp upside spikes — a few months of +12% — with small, consistent losses otherwise. A investor would clearly prefer B; Sharpe cannot tell them apart; Sortino ranks B far above A. Trend-following and structure-based strategies — many small losses, occasional large wins — are exactly the B profile, which is why Sortino describes them more fairly than Sharpe.

Automate your trades. Let Quantum Algo trade for you.
Every signal executed on your own account — on your account, with the plan you define.
The formula
Sortino = (R − T) ÷ DD, where R is the strategy's average return over the period, T is the target return (the risk-free rate, or zero for a simpler version), and DD is the downside deviation — the square root of the mean of the squared shortfalls below T, with returns above T counted as zero shortfall. Annualise by multiplying a monthly ratio by √12 or a daily one by √252, the same way as Sharpe. The calculator on this page takes a list of periodic returns and a target and returns Sortino, Sharpe and the downside deviation together, because reading the two ratios side by side is the point.
Three details that change the number: the target — zero flatters every strategy compared with the risk-free rate; the period — monthly returns hide intraday drawdowns that daily returns show; and the sample — under a hundred periods the downside deviation is estimated from a handful of bad months and swings wildly.
What is a good Sortino ratio?
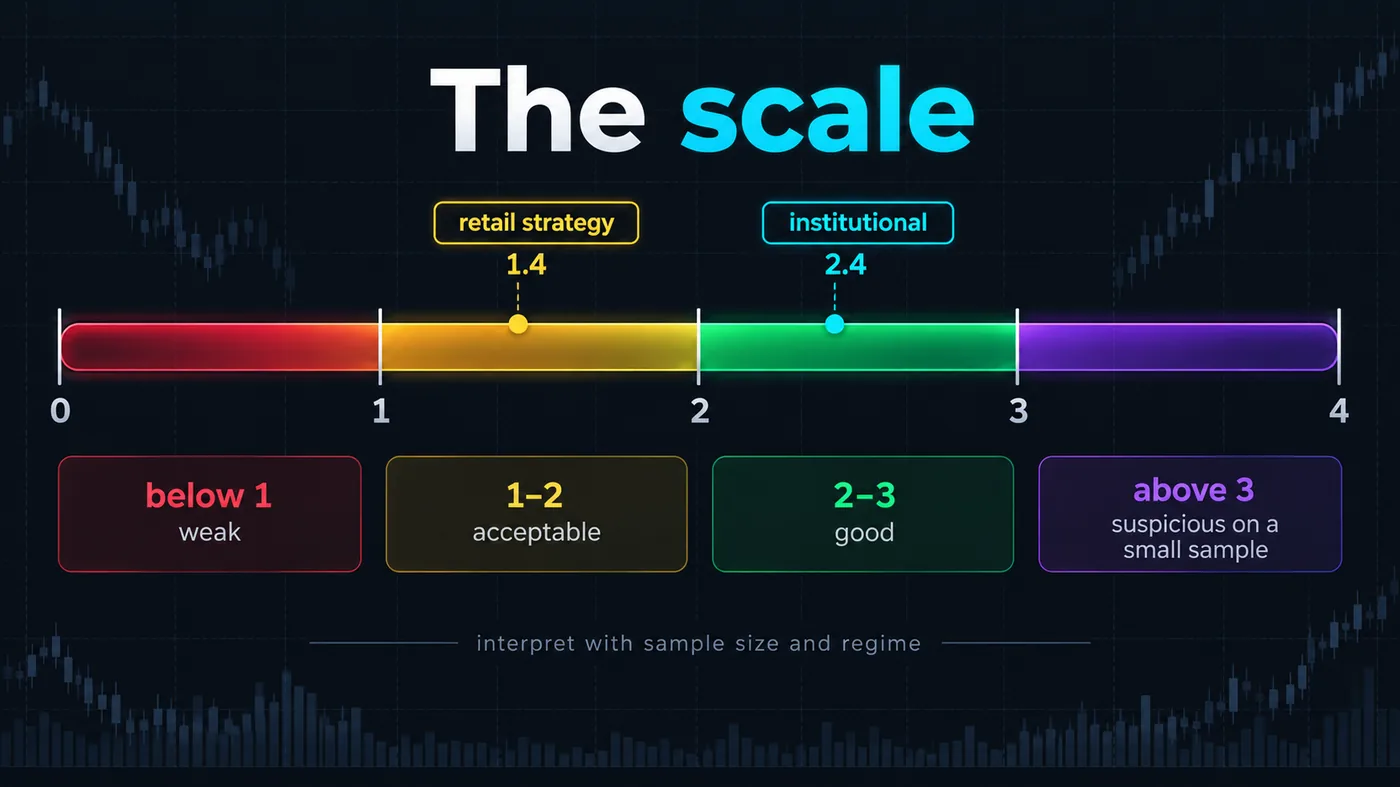
The gauge illustration in this guide is the honest scale:
| Sortino (annualised) | Read |
|---|---|
| Below 1 | Weak — the downside is large relative to the excess return |
| 1 – 2 | Acceptable for a retail strategy; most real, sustainable systems live here |
| 2 – 3 | Good — strong return for the pain taken; institutional-grade if the sample is large |
| Above 3 | Suspicious on a small sample; usually overfitting, a short bull-market window, or a strategy that has not yet met its bad regime |
The benchmark comparison: the S&P 500's long-run Sortino is roughly 1.0–1.3 depending on the window; a strategy that cannot beat that after costs is not worth its hours. And Sortino should be read beside the maximum drawdown and the trade count — a 2.5 on forty trades is a coincidence, on four hundred a result. Our quantitative trading guide covers reading a backtest's statistics together.
Sortino, Sharpe, Calmar, profit factor
| Ratio | Numerator | Denominator | Best for |
|---|---|---|---|
| Sharpe | Excess return | All volatility | Comparing smooth, symmetric strategies |
| Sortino | Excess return | Downside deviation | Asymmetric strategies (trend, structure) — the trader's ratio |
| Calmar | Annual return | Maximum drawdown | The worst-case question: how much pain for the return |
| Profit factor | Gross profit | Gross loss | Per-trade quality; 1.5–2 healthy |
Use Sortino and Calmar together for a trading strategy: Sortino for the typical bad month, Calmar for the worst stretch. Sharpe remains the number institutions quote, so know yours, but do not optimise for it if your strategy's spikes are on the right side.
Using it in practice
- Export returns from the journal or backtest — monthly for swing, daily for intraday.
- Choose the target — the risk-free rate for an honest number, zero for a quick read.
- Compute Sortino and Sharpe together — the gap between them tells you which side your volatility is on.
- Compare with the benchmark and with your own maximum drawdown.
- Re-run quarterly — a falling Sortino with a stable Sharpe means the losses are getting larger relative to the wins, which is the earliest statistical sign of an edge decaying; the Monte Carlo guide covers what "normal" variation looks like.
A worked example
A structure strategy on gold, twelve months of monthly returns after costs: +4.1, −1.8, +6.3, +0.9, −2.4, +3.7, −1.1, +8.2, +2.0, −2.9, +5.4, +1.6 (percent). Mean monthly return 2.0%; target the risk-free rate at 0.4% a month. Shortfalls below the target: the five negative months plus none of the positives, squared and averaged over all twelve months, square-rooted: downside deviation ≈ 1.1%. Sortino = (2.0 − 0.4) ÷ 1.1 ≈ 1.45 monthly, ≈ 5.0 annualised. Sharpe on the same series: total standard deviation ≈ 3.4%, Sharpe ≈ 0.47 monthly, ≈ 1.6 annualised. The gap between 5.0 and 1.6 is the strategy's asymmetry — the +8.2 and +6.3 months inflate Sharpe's denominator and leave Sortino's untouched. And the honest footnote: twelve months is far too few; the 5.0 is a number to re-compute after thirty-six, not to quote.
Downside deviation, step by step
- Choose the target T (the risk-free rate per period, or zero).
- For each period, compute the shortfall: max(0, T − return). Periods above the target contribute zero.
- Square each shortfall.
- Average the squares over all periods — including the zeros — not just the losing ones; this is the convention that makes Sortino comparable across strategies.
- Take the square root. That is the downside deviation.
Averaging over losing periods only, which some spreadsheets do, roughly doubles the deviation and halves the ratio; state which convention you used when quoting a number.
The Sortino checklist
- Returns per period after all costs — spread, commission, funding, financing.
- A stated target, ideally the risk-free rate.
- At least a hundred periods, or several hundred trades.
- Sharpe beside it — the gap is the asymmetry.
- Maximum drawdown and Calmar beside both — the worst stretch, not just the typical bad month.
- Re-computed quarterly; a falling Sortino with a stable Sharpe is the earliest sign of decay.
Sortino is the trader's ratio because it asks the trader's question: how bad were the bad months relative to what you earned. Compute it beside Sharpe — the gap is your asymmetry — and beside Calmar and the drawdown; use the risk-free rate as the target, a hundred periods as the minimum, and re-run it quarterly, because a falling Sortino is the first number that notices an edge decaying.
◆ Interactive check
Do you know what it divides by?
Questions traders ask about the Sortino ratio
Yes, within reason: above 2 is good for a retail strategy. Above 3 on a small sample is usually a sign the strategy has not yet met its bad regime rather than a sign of genius.
Sharpe divides excess return by total volatility; Sortino divides it by downside deviation only. Sortino does not penalise upside volatility, so it describes asymmetric strategies more fairly.
The risk-free rate (a short-term Treasury yield) for a number comparable with published ratios; zero for a quick internal read. State which you used.
Enough periods that the downside deviation is estimated from more than a handful of bad ones — a hundred periods at minimum; several hundred trades if you compute it per trade.
Roughly 1.0–1.3 annualised over long windows, varying with the period; it is the benchmark a strategy has to beat after costs.
The track record publishes the trades and the R-multiples; the calculator on this page computes Sortino from any return series, including that one, so you can run it yourself rather than take a quoted number.
Average the returns (R), choose a target (T), compute each period's shortfall as MAX(0, T − return), square them, average over all periods, take the square root (downside deviation), then (R − T) ÷ DD, times the square root of periods per year to annualise.
Reported figures for well-regarded funds cluster around 1.5–3 over long windows; anything much higher over a short window is usually a strategy that has not met its bad regime.
Yes — when the average return is below the target. A negative Sortino means the strategy did not earn its target, whatever its downside.
Because the downside deviation is estimated from the few losing periods; with under a hundred periods, one bad month moves it a lot. Report it with the sample size.
For asymmetric strategies — trend, structure, options selling — it is the fairer measure; for smooth, symmetric strategies the two agree. Institutions still quote Sharpe, so know both.
The track record publishes the trades and R-multiples; the calculator here computes Sortino from any return series, including that one, so you can run it rather than take a number.
References & Related Guides
Read next
- What Is Quantitative Trading?
- Monte Carlo Simulation for Trading
- Backtesting Trading Strategies
- Swing Trading vs Buy-and-Hold
- Position Sizing: The Complete Guide
- Trading Journal: Complete Guide
- Is Day Trading Worth It?
- Quantum Algo Track Record