Best Indicator for Silver (XAGUSD): ATR, Sessions and the Smart Money Set That Reads a Market Twice as Wild as Gold
The best indicator for silver is not one indicator but a small set that answers silver's three problems. Silver moves about twice as much as gold in percentage terms, so the first tool is the ATR — for sizing and for stops placed beyond the noise. Silver makes its moves in London and New York after building a range in Asia, so the second is a session indicator that draws the Asian range and the killzones. And silver respects structure violently — equal lows get swept hard before reversing — so the third is the Smart Money set: order blocks, liquidity sweeps and key levels. Add the gold/silver ratio to know when silver is in its fast phase and the dollar index for the tailwind, halve the size you would use on gold, and treat RSI extremes as information, not signals. Zeno prints the signals on XAGUSD the same way it does on gold.
Silver is the metal traders arrive at from gold with gold's habits, and it punishes every one of them: the stop that was fine on XAUUSD is inside silver's noise, the size that was fine is twice too large, and the oscillator that turned on gold stays pinned for a week. This page is the indicator set that fits the market as it is — the ATR to size it, the sessions to time it, the Smart Money structure to read it, and the ratio and the dollar to know which phase it is in — with a real Zeno chart on the 4-hour, a London-sweep trade worked through in dollars per ounce, a sizer for lots and contracts, and the mistakes that separate silver traders from ex-silver traders.
Indicators that prove themselves in public.
One engine, four precision tools — the Gold (XAU) Scalper, the institutional Gravity Zone, the Zeno momentum Oscillator, and Zeno Stocks for equities.



What makes silver different from gold
Silver trades on the same three drivers as gold — the dollar, real yields and risk appetite — and then adds two of its own: industrial demand, which is roughly half of consumption and rising with solar and electronics, and a much smaller market, which means the same flow moves the price further. The result is the first thing any silver trader learns the expensive way: XAGUSD moves about twice as much as XAUUSD in percentage terms, day after day. The best indicator for gold is mostly the best indicator for silver too; what changes is the size, the stop and the patience.
Two more differences matter for indicator choice. Silver's correlation with gold is high but not stable — the gold–dollar relationship holds for both, but silver lags gold at turns and then overshoots, which is what the gold/silver ratio measures and why it is worth a pane on the chart. And silver keeps stricter hours than gold: the Asian session is thin, London expands, and the real range is made when COMEX opens in New York. Session tools earn their place on silver in a way they do not always on forex majors.
So the answer to "best indicator for silver" has three parts: something that measures the volatility so you can size (ATR), something that reads the structure and the liquidity (the Smart Money set — order blocks, sweeps, levels), and something that tells you when silver is doing its own thing versus following gold (the ratio and the sessions). No single indicator does all three; a small set does.
Volatility first: ATR and sizing
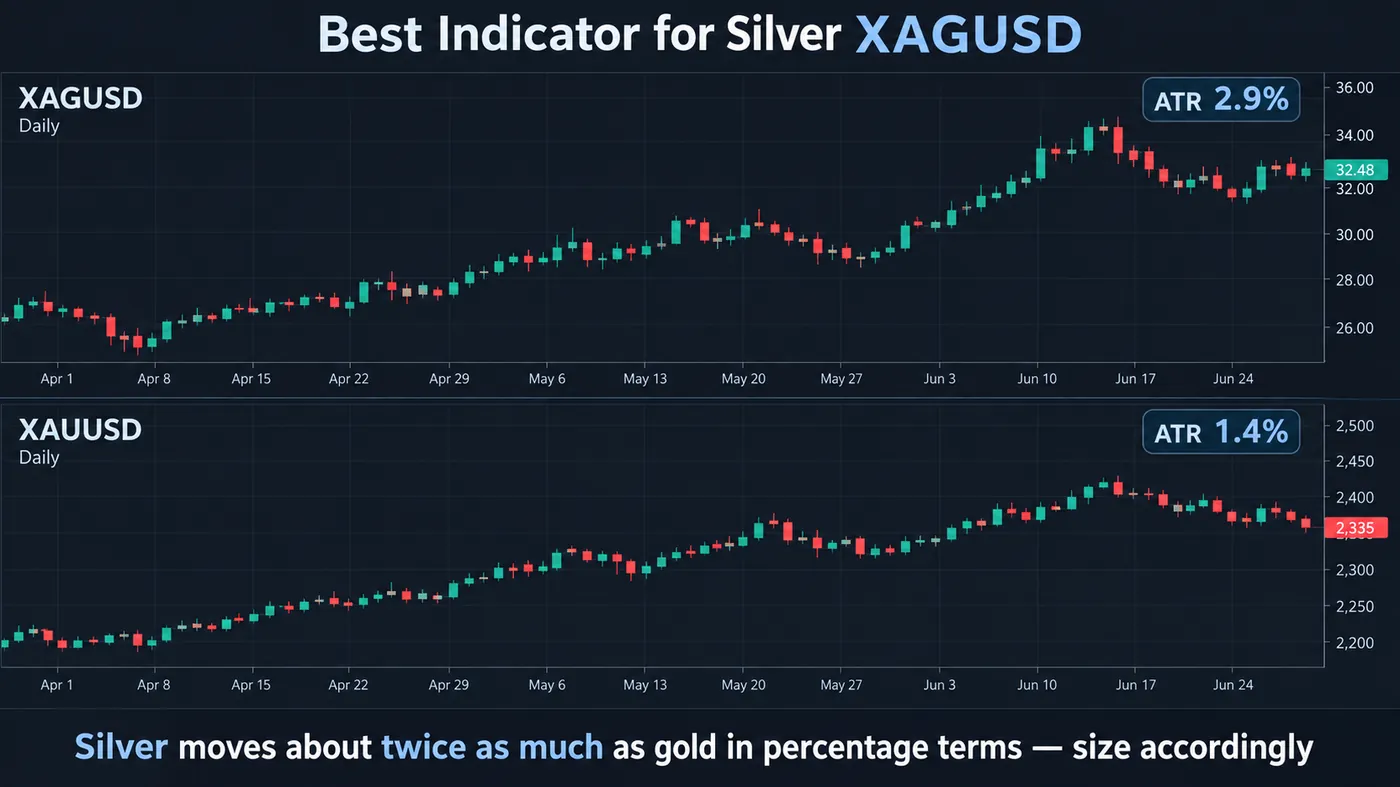
The Average True Range is not a signal on silver; it is a survival tool. A daily ATR of $1.80 an ounce on a $64 silver price is 2.8%; the same day gold might show 1.4%. Every stop on silver needs to be placed in ATR terms — a stop inside a third of the daily ATR on a 4-hour setup is inside the noise and will be hit by the ordinary wobble of the London open — and every position needs to be sized from that stop, which the sizer below does in lots and contracts. Traders who come to silver from gold and keep gold's size are the ones who describe silver as "manipulated"; it is simply twice as wide.
The practical rules: read the daily ATR before the session; put the stop beyond the level by at least a quarter of it on intraday trades and half of it on 4-hour and daily trades; and halve the size you would use on gold for the same dollar risk. The position sizing guide covers the arithmetic in full and the lot size calculator handles gold; the tool on this page handles silver's contract sizes.
Sessions: when silver actually moves
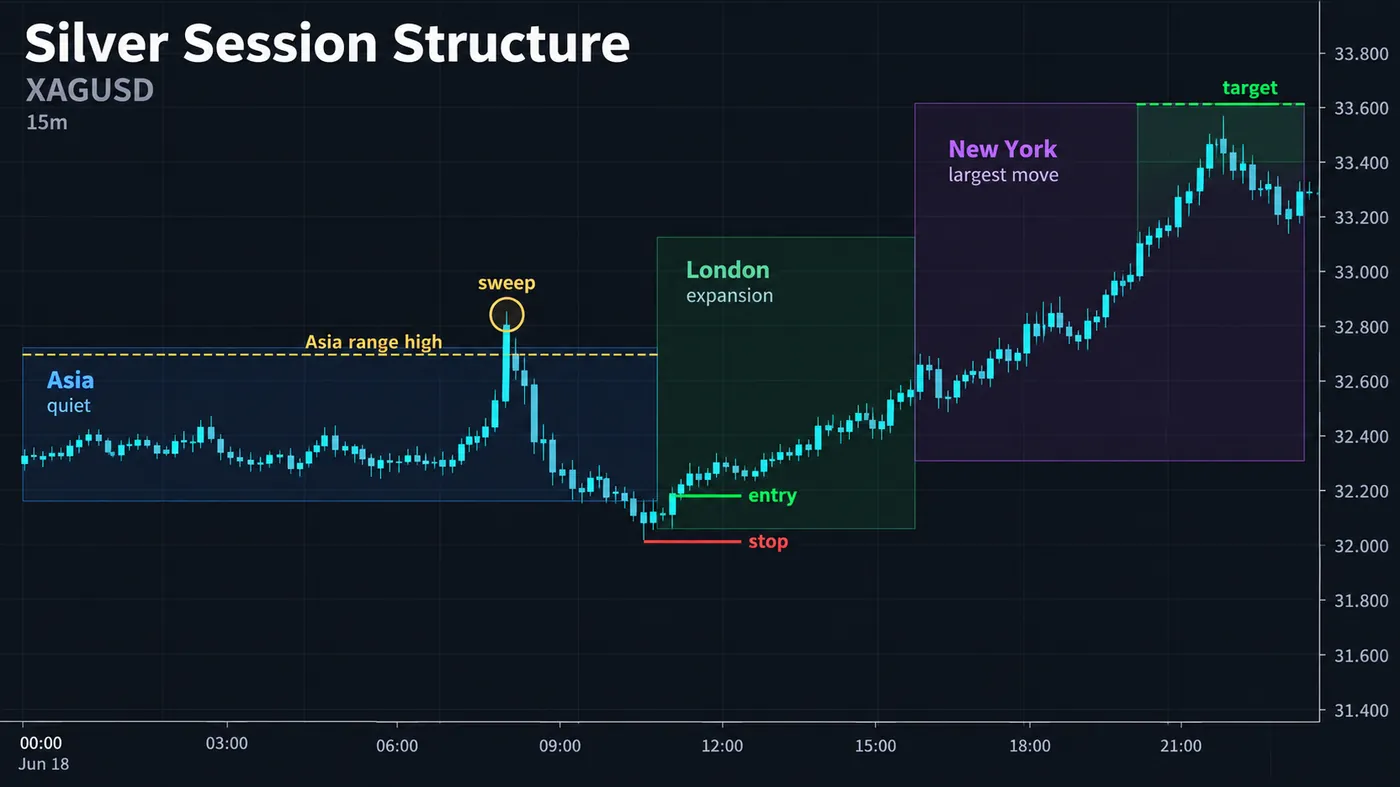
Silver's day has a shape you can trade around. Asia builds a tight range; London — around the fix and the European open — breaks one side of it, often to sweep the stops above the Asian high or below the low; New York, when COMEX opens, makes the move that lasts, and the biggest single candles of the day cluster in the first two hours of the US session. A session indicator that draws the Asian range and marks the killzones is the second-best indicator for silver after ATR, because it tells you when a sweep is a sweep and when it is just the afternoon drift. The SessionScope script does exactly that; the trading sessions guide and the session-based trading lesson cover the logic.
The setup that falls out of it is the one on the chart above: the Asian range high is swept in London, the 15-minute candle closes back inside, and the long is taken on the return with the stop under the sweep and the target at the New York expansion. It is the same liquidity sweep trade used on every market here; silver just makes the sweep larger and the follow-through faster.

Automate your trades. Let Quantum Algo trade for you.
Every signal executed on your own account — on your account, with the plan you define.
Structure: the Smart Money set on silver
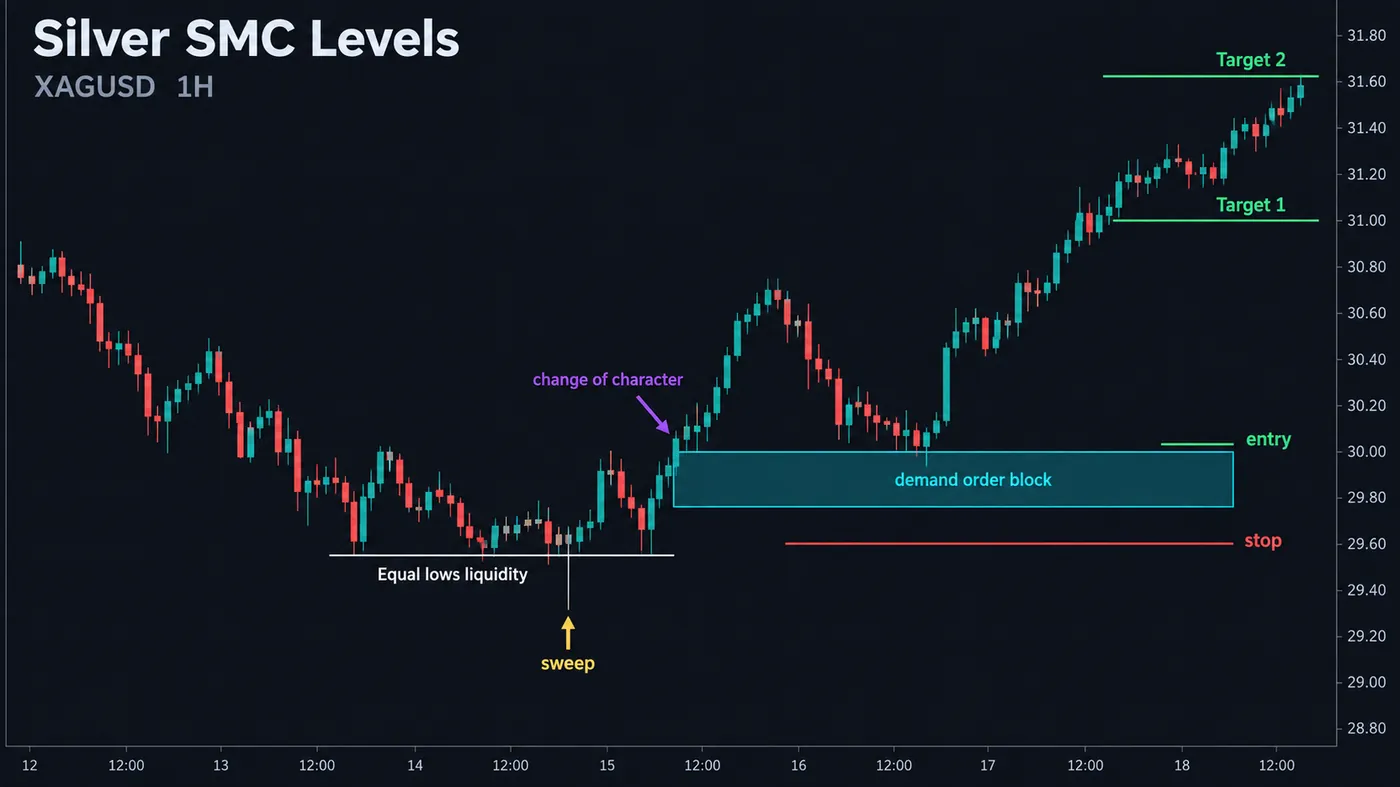
Silver respects structure the way thin markets do — violently. Equal lows on the 1-hour chart are a liquidity pool, and silver sweeps them harder than gold before reversing; the sweep is followed by a change of character and a return to the demand order block that started the move, which is the entry. The Smart Money Concepts Engine marks the structure and the blocks, the Liquidity Sweeps script flags the sweep, and the Institutional Key Levels script keeps the daily and weekly levels on the chart — on silver those levels are round numbers more often than not, because a large share of the retail order book sits at whole dollars.
The one adjustment from gold: the stop goes further under the sweep, because silver's second sweep is common. A stop a few cents under the wick on gold works; on silver, place it a quarter-ATR under, or wait for the change of character before entering at all. The gold SMC strategy in the academy translates almost line for line; the most accurate indicator for gold page covers the confluence approach that carries over.
Silver-specific reads: the ratio and the dollar
| Tool | What it tells you on silver | How to use it |
|---|---|---|
| Gold/silver ratio | Whether silver is lagging or leading gold; historically mean-reverting over months | Ratio at multi-year highs = silver cheap relative to gold and prone to catch-up rallies; falling ratio in a gold uptrend = silver in its fast phase |
| DXY | The dollar; inverse to both metals, silver more so | A dollar breakdown is the tailwind for silver's biggest moves; a dollar squeeze is when silver falls twice as fast as gold |
| Real yields (TIPS) | The cost of holding a non-yielding metal | Falling real yields support both; silver responds with more amplitude |
| ATR (14, daily) | The day's expected range in dollars | Stop and size; never enter without reading it |
| Session boxes | Asia range, London expansion, New York move | Trade the London sweep of the Asian range into the New York expansion |
| Anchored VWAP | Fair value from a swing or the COMEX open | Silver mean-reverts to the session VWAP hard after the New York spike; the Anchored VWAP Engine draws it |
| Volume profile | Where the day's business was done | The value-area edges are silver's intraday targets; the Institutional Volume Profile marks them |
| RSI / oscillators | Momentum extremes | Weak on silver alone — it stays extreme for days in a run; use only with structure |
The ratio deserves the extra sentence. When gold makes a new high and silver does not, the ratio rises and silver is the laggard; that is usually the setup for silver's catch-up phase, when it can gain three or four times what gold does in a few weeks — and the same phase in reverse when gold turns. A trader who watches the ratio knows which of the two metals is in its fast phase, and trades that one.
Silver position sizer
Enter the account, the risk per trade, the stop in dollars per ounce and the daily ATR, then pick the instrument — XAGUSD CFD, COMEX SI or micro SIL. The tool returns the size in lots or contracts, the dollar value of a $1 move at that size, and whether the stop is inside silver's noise.
Zeno on silver
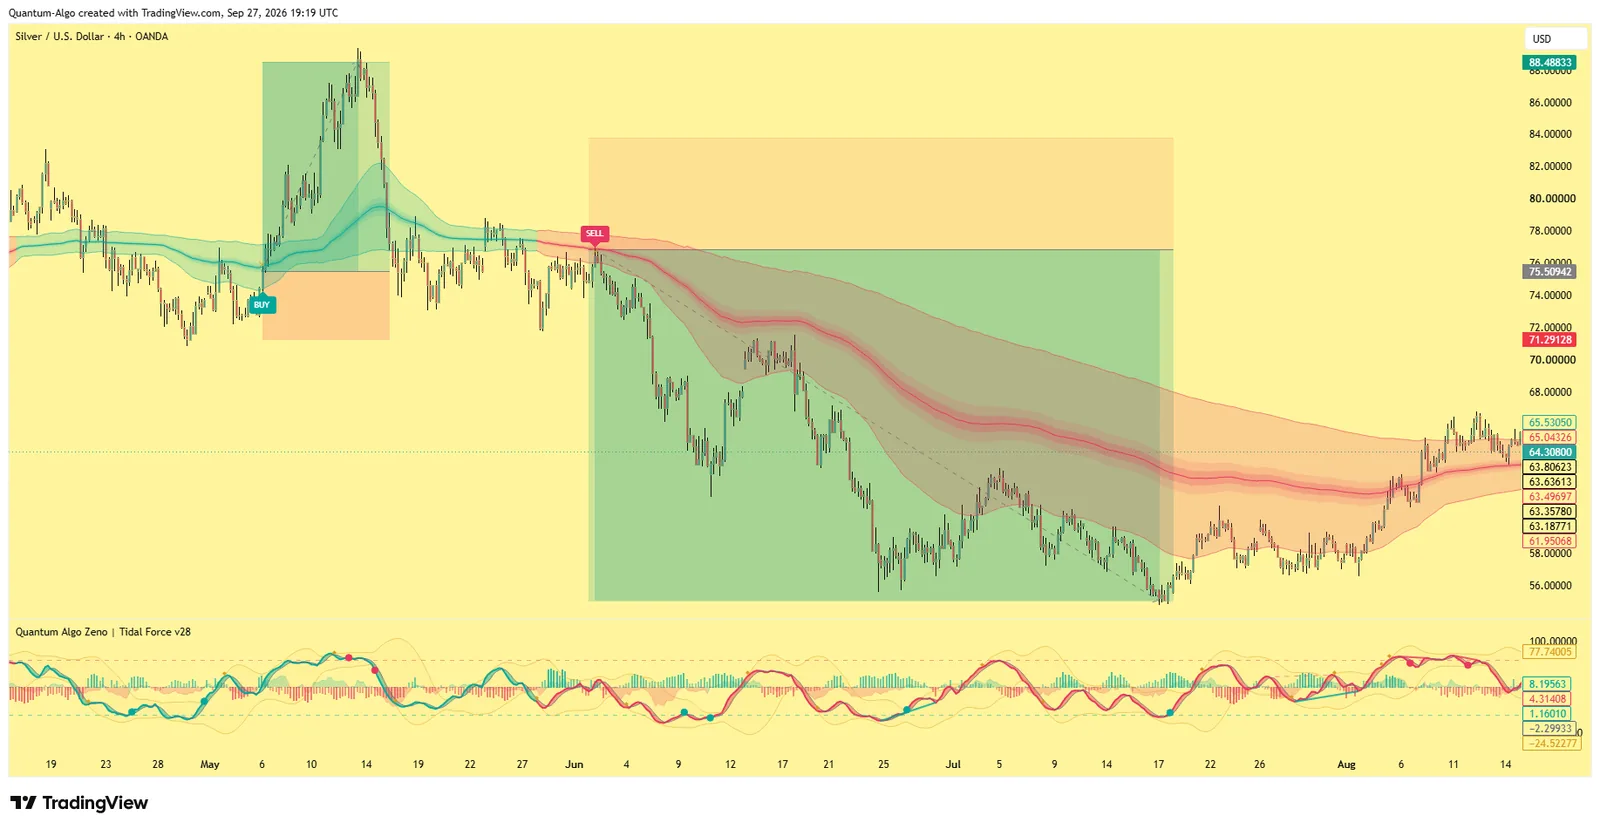
The chart above is the premium engine on the 4-hour silver chart as it printed, not a reconstruction. A buy signal near $74 at the start of May, with the target zone shaded at the time, ran to a high near $88.50 two weeks later; a sell signal near $77.50 at the end of May, again with its zone drawn in advance, ran to a low near $56 by mid-July — a 28% decline that silver made while gold fell a fraction of that. The Tidal Force pane underneath is the momentum read that gates the signals. Both trades had the stop printed on the chart when the signal fired; the run in each case was several times the stop, which is what silver's volatility gives you when the structure is read correctly and takes from you when it is not.
The point of showing a real chart is the same as on the track record page: the signal, the stop and the target zones are timestamped, and the silver page makes no claim the chart does not. Zeno runs on XAGUSD the way it runs on gold, and the sizing rules above are the difference between the two.
Reference data
| Item | Value |
|---|---|
| Symbol | XAGUSD (spot silver in US dollars); COMEX SI futures (5,000 oz); micro SIL (1,000 oz) |
| CFD lot | 5,000 oz; a $1 move = $5,000 per lot; 0.01 lot = 50 oz |
| Volatility | Roughly twice gold's daily range in percentage terms |
| Drivers | Dollar, real yields, risk appetite — plus industrial demand (about half of consumption) and a small market |
| Sessions | Asia thin; London expands and sweeps the Asian range; New York (COMEX) makes the day's range |
| Core indicators | ATR (size and stop), session boxes, Smart Money structure (order blocks, sweeps, key levels), anchored VWAP, volume profile |
| Silver-specific | Gold/silver ratio for the fast-phase read; DXY for the tailwind |
| Weak alone | RSI and momentum oscillators — silver stays extreme for days |
| Stop rule | At least a quarter of the daily ATR beyond the level intraday; half on 4-hour and daily; a quarter-ATR under a sweep |
| Size rule | Half the size you would use on gold for the same dollar risk |
Worked example: a London sweep into the New York move
XAGUSD at $64.30, daily ATR $1.80. Asia builds a range from $63.95 to $64.40. At 08:10 London the price spikes to $64.52, twelve cents through the Asian high, on the kind of candle the Liquidity Sweeps script flags, and the 15-minute candle closes at $64.28, back inside. Short on the next candle at $64.25, stop at $64.62 — ten cents above the sweep, which is 20% of the ATR on top of the wick — for $0.37 of risk per ounce. Target the Asian low at $63.95 first, then the prior day's value-area low at $63.60 marked by the volume profile.
On a $10,000 account risking 1% ($100), the sizer gives 270 oz — 0.05 lots on a CFD, or too small for even a micro contract, which is itself a lesson about silver and small accounts. The first target fills at 09:40 London for 0.8R; New York opens, the dollar bid extends, and the second target fills at 14:05 for 1.75R on the remainder. Blended 1.3R for a trade that lasted six hours and never moved more than $0.14 against the entry. The same trade on gold would have needed a stop a third the size in percentage terms and would have paid a third as much; the same trade with gold's size would have risked three times the plan.
Mistakes traders make on silver
- Sizing like gold. Silver moves twice as much; halve the size for the same dollar risk.
- Stops inside the noise. Under a quarter of the daily ATR intraday, or under half on the 4-hour, the stop is a donation.
- Trading Asia. The range is built there; the moves are made in London and New York.
- Reading RSI extremes as reversals. Silver stays overbought for a week in a run.
- Ignoring the ratio. When gold makes a high and silver does not, the catch-up phase is the trade, not the lag.
- Entering the first sweep. Silver often sweeps twice; wait for the change of character or place the stop for the second one.
- Forgetting the contract size. One lot is 5,000 oz; a $1 move is $5,000.
Silver and the free indicators
The library covers the three parts of the answer. For volatility and sessions, the SessionScope script draws the Asian range and the killzones and the Volatility Storm Tracker reads the regime. For structure, the Smart Money Concepts Engine, the Liquidity Sweeps script, the Order Blocks with Volume script and the Institutional Key Levels script. For fair value and targets, the Anchored VWAP Engine and the Institutional Volume Profile. The premium engine, Zeno, prints the signal with a stop and targets on XAGUSD as shown above; the gold market page and the gold trading guide are the sister reads for the metal silver follows.
Read the ATR before every silver trade and size from it — half of what you would use on gold. Trade the London sweep of the Asian range into the New York expansion, enter at the order block after the change of character, and put the stop a quarter-ATR beyond the sweep because silver sweeps twice. Watch the ratio to know whether silver is lagging or in its fast phase, and let the oscillators describe rather than decide.
◆ Interactive check
Do you know how silver differs from gold?
Questions traders ask about silver indicators
A set rather than one: the ATR to size a market that moves about twice as much as gold, a session indicator to time the London sweep of the Asian range into the New York move, and the Smart Money structure set — order blocks, liquidity sweeps, key levels — to read the entries. The gold/silver ratio and the dollar index add the silver-specific context.
A much smaller market, so the same flow moves price further, plus an industrial demand component — about half of consumption — that gold lacks. Silver therefore follows gold's drivers (the dollar, real yields, risk appetite) with roughly twice the amplitude, lagging at turns and then overshooting.
The London session, around the fix and the European open, when the Asian range is broken — usually by a sweep of its high or low — and the first two hours after COMEX opens in New York, when the day's largest candles cluster. Asia is for building the range, not trading it.
In ATR terms. Read the daily ATR, then place the stop at least a quarter of it beyond the level on intraday trades and half of it on 4-hour and daily trades; under a sweep, a quarter-ATR below the wick, because silver often sweeps twice. Size the position from that stop, not the other way round.
Poorly on its own. Silver stays overbought or oversold for days in a run, so RSI extremes describe the move rather than predict its end. Use it only with structure — a divergence at a swept level is information; an extreme reading alone is not a signal.
It shows which metal is in its fast phase. When gold makes a new high and silver does not, the ratio rises and silver is lagging — historically the setup for a catch-up rally where silver gains several times what gold does; when the ratio falls in a gold uptrend, silver is leading. Trade the metal in its fast phase and size for silver's amplitude.
On most CFD brokers one XAGUSD lot is 5,000 oz, so a $1 move is worth $5,000 and a 0.01 micro lot is 50 oz. COMEX SI futures are also 5,000 oz with a $0.005 tick worth $25; micro SIL contracts are 1,000 oz.
Yes — the Smart Money sweep-and-order-block setup translates almost line for line — with two changes: halve the size for the same dollar risk, and place the stop further beyond the sweep because silver's second sweep is common. The gold strategy guides on this site are the starting point.
Yes. The chart on this page is Zeno on the 4-hour XAGUSD chart as it printed — a buy near $74 into a run to about $88.50 and a sell near $77.50 into a decline to about $56, each with the stop and target zones drawn at the time. The signals are timestamped on the track record page.
SessionScope for the Asian range and killzones, the Volatility Storm Tracker for the regime, the Smart Money Concepts Engine, Liquidity Sweeps, Order Blocks with Volume and Institutional Key Levels for structure, and the Anchored VWAP Engine and Institutional Volume Profile for fair value and intraday targets.
References & Related Guides
Read next
- Best Indicator for Gold (XAUUSD)
- Gold Trading (XAUUSD) Complete Guide
- Gold–DXY Correlation
- Most Accurate Indicator for Gold
- ATR: Average True Range
- Position Sizing
- Lot Size Calculator (Forex & Gold)
- Gold XAUUSD SMC Strategy (academy)
- Trading Sessions Guide (academy)
- SessionScope (free indicator)
- Anchored VWAP Engine (free indicator)
- Gold market page