Bollinger Bands + RSI Strategy: The Mean-Reversion Setup and the Filter That Makes It Work
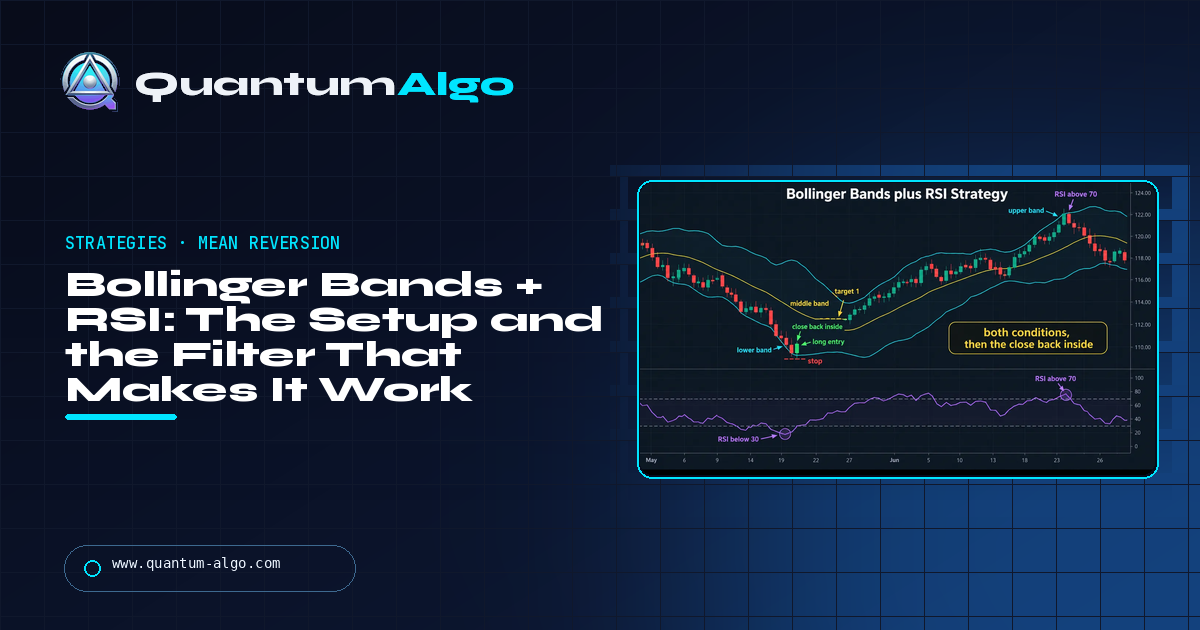
The Bollinger Bands + RSI strategy is a mean-reversion setup with two conditions on the same candle: price at or beyond a Bollinger Band (20-period, 2 standard deviations) and RSI (14) beyond 30 or 70. The trigger is the next candle closing back inside the band; the trade is toward the middle band, with the stop a little beyond the band touch. Requiring both indicators removes most of the false signals each gives alone — but the strategy only works in a range, so the regime filter (Choppiness Index above 61.8, ADX below 20, bands not expanding) is not an option, it is the strategy. In a trend the setup appears on every candle of a band walk and every one loses.
This is the strategy everyone learns second, after moving-average crosses, and abandons third, after it loses a month of range profits in one trend. It does not deserve the abandonment; it deserves the one condition its usual description leaves out. This page is the setup stated precisely, the close-back-inside trigger, the band walk and the three filters that catch it, the settings that matter and the ones that do not, a EURUSD 1-hour range trade beside the identical setup that was skipped a week later, and the mistakes that turn a decent range system into a losing one. The checker refuses the trade when the regime is wrong.
Indicators that prove themselves in public.
One engine, four precision tools — the Gold (XAU) Scalper, the institutional Gravity Zone, the Zeno momentum Oscillator, and Zeno Stocks for equities.



What the Bollinger Bands + RSI strategy is
It is a mean-reversion strategy with two conditions. Price touches or closes beyond a Bollinger Band — two standard deviations from a 20-period average — and at the same time the 14-period RSI is beyond 30 or 70. When both are true and the next candle closes back inside the band, you trade back toward the middle band: long from the lower band with RSI under 30, short from the upper band with RSI over 70. The stop sits a little beyond the band; the first target is the 20-period average.
The logic is that the two indicators fail in different ways and cover each other. Bollinger Bands measure distance from the mean in units of recent volatility, so a band touch says price is statistically stretched — but in a trend price walks the band for days and every touch is a continuation. RSI measures the speed of the move, so an extreme RSI says momentum is stretched — but RSI reaches 30 in a downtrend and stays there. Requiring both cuts the signals by two-thirds and removes many of the band walks, because a band walk that is slowing will show RSI easing off 70 before price leaves the band.
What it is not: a trend strategy, and not a strategy at all without a regime filter. Both indicators are mean-reversion tools, and mean reversion pays only when the market is in a range. The single largest improvement anyone makes to this system is adding the one thing it lacks — a way to know whether the market is in a box.
The setup, precisely
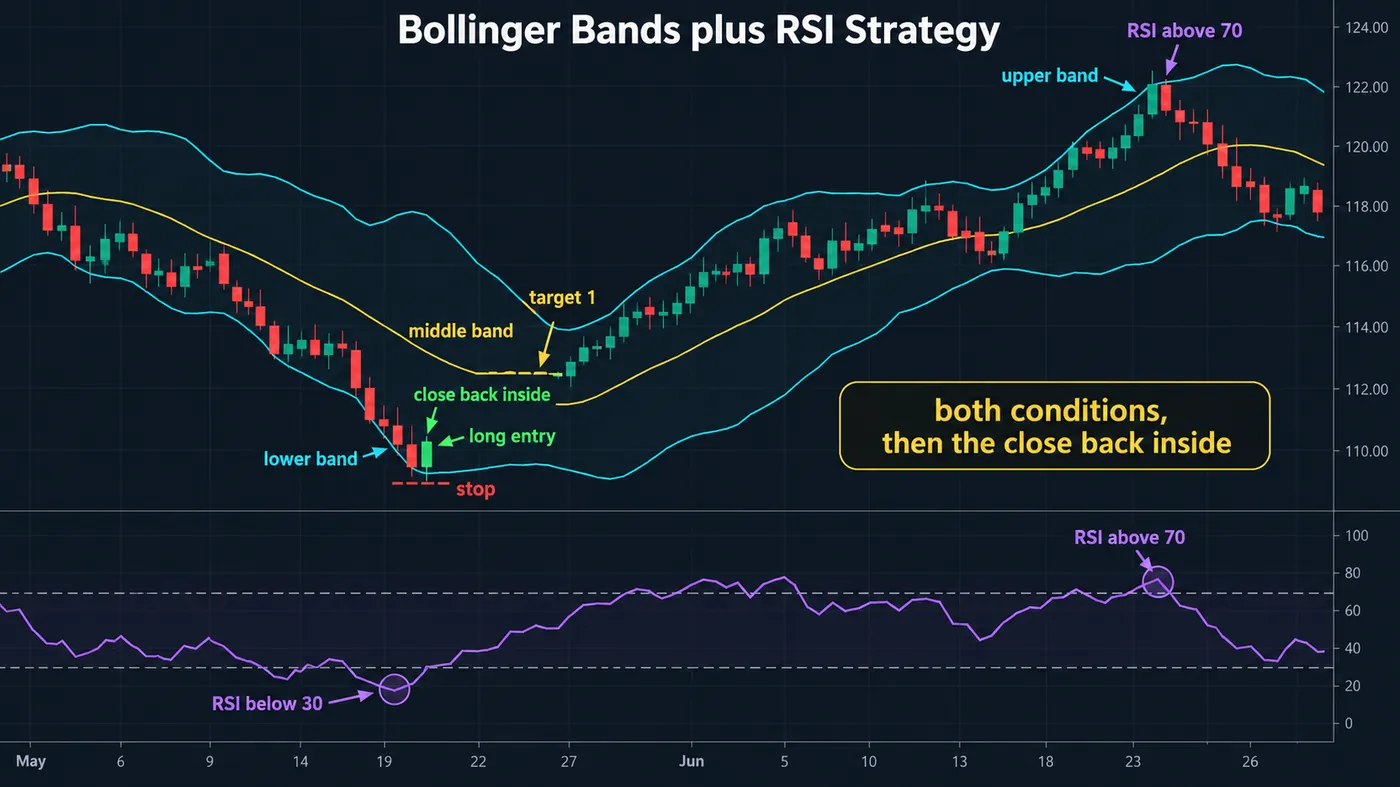
| Condition | Long | Short | Why it is there |
|---|---|---|---|
| 1. Band | Close or wick at or below the lower band (%B ≤ 0.05) | Close or wick at or above the upper band (%B ≥ 0.95) | Price is two standard deviations from its 20-bar mean |
| 2. RSI | RSI(14) ≤ 30 | RSI(14) ≥ 70 | Momentum is stretched as well as price |
| 3. Trigger | Next candle closes back inside the lower band | Next candle closes back inside the upper band | Separates a reversal from the start of a band walk |
| 4. Regime | Bands flat or contracting; Choppiness Index above 61.8 or ADX below 20 | Same | Mean reversion needs a range; this is the filter the strategy lacks on its own |
| Stop | A fraction of the band width below the band touch | The mirror above | Beyond the extreme, not at it |
| Target 1 | The middle band (SMA 20) | The middle band | Where a mean-reversion trade is paid |
| Target 2 | The upper band | The lower band | Only in a clean range; take most off at the middle |
Condition 3 is the one most versions leave out and the one that matters most. A candle that closes below the lower band with RSI at 24 is either the end of a move or the beginning of a band walk, and there is no way to tell from that candle. The next one tells you: back inside, reversal; still outside, walk. Waiting one candle costs a few ticks and removes half the losing trades.
Where it fails: the band walk
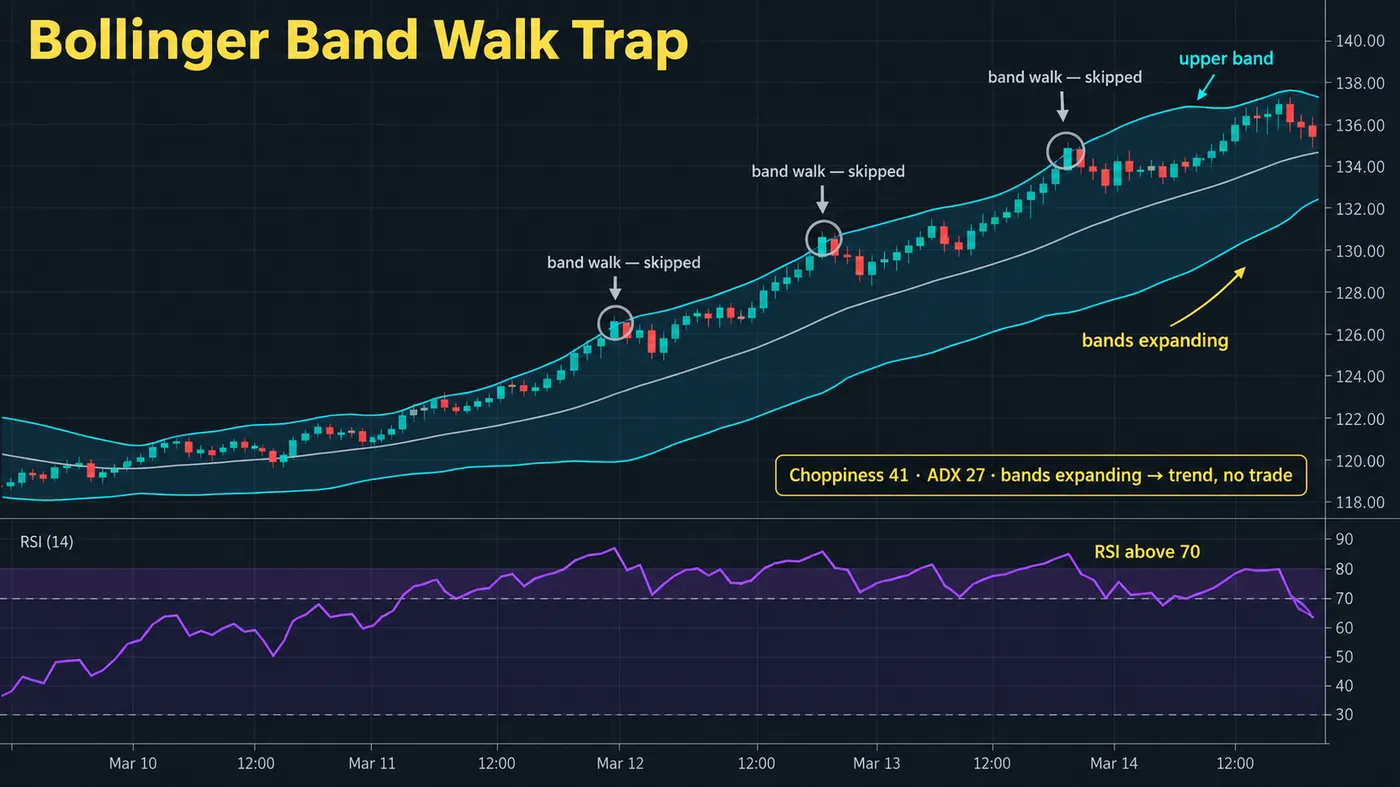
A band walk is price riding the upper or lower band for many candles while the bands expand. Every candle in it satisfies conditions 1 and 2 — price at the band, RSI beyond 70 — and every short taken on that basis is stopped. This is where the strategy loses everything it made in the ranges, and it is why the regime filter is not an addition to the system but the system.
Three filters work. The Choppiness Index above 61.8 says the market is in a box; below 38.2 it is trending and the strategy is off. ADX below 20 says the same thing from the other side. And band width itself — the distance between the bands as a percentage of price — contracting or flat says volatility is stable, which is what a range looks like; expanding says a trend is under way. Any one of the three, checked before the entry, removes most band walks. Two of them is safer.
The second failure is the squeeze. When the bands have contracted to their narrowest in months, the next move is usually an expansion — a breakout — and a band touch at the end of a squeeze is the first candle of the trend, not a reversal. Band width near a multi-month low is a reason to stand aside from mean reversion, whatever RSI says. The squeeze is a different trade.

Automate your trades. Let Quantum Algo trade for you.
Every signal executed on your own account — on your account, with the plan you define.
How to trade it
- Confirm the regime first. Bands flat, Choppiness above 61.8 or ADX below 20, band width not at a multi-month low. If the market is trending or squeezing, there is no trade today.
- Wait for both conditions. Price at the band and RSI at the extreme on the same candle. One without the other is not the setup.
- Wait for the close back inside. The next candle closes inside the band. If it closes outside again, the walk has started — stand aside until the bands flatten.
- Enter on that close, stop beyond the band touch. About 15% of the band width beyond the extreme of the touch candle. Not at the band; price often re-tests it.
- Take most off at the middle band. The 20-period average is where a mean-reversion trade is paid. Hold a small remainder for the opposite band only if the range is clean.
- If RSI leaves the extreme but price does not leave the band, exit. Momentum has reset without price moving; the band is holding. That is a walk forming.
Setup checker
Put in the close, the three bands, the RSI and your regime read. The tool checks both conditions, insists on the close back inside the band, refuses the trade in a trend, and returns the stop and both targets with their R multiples — plus a warning when the bands are tight enough that a squeeze breakout is the likelier outcome.
Settings and variants
| Variant | Bands | RSI | Regime filter | Note |
|---|---|---|---|---|
| Classic | 20, 2.0 | 14, 30 / 70 | None | Profitable in ranges, ruined by trends; the version most backtests show |
| Filtered (recommended) | 20, 2.0 | 14, 30 / 70 | Choppiness > 61.8 or ADX < 20; band width not at a low | The same entries with the trend days removed |
| Tighter | 20, 2.5 | 14, 25 / 75 | Same | Fewer, better setups; suits crypto's wider swings |
| Intraday | 20, 2.0 on 15M | 14, 30 / 70 | Session filter + ADX | Range-bound sessions only — lunch, Asia |
| Aggressive | 20, 2.0 | 7, 20 / 80 | Same | Faster RSI, more signals, more noise; not recommended |
Leave the bands at 20 and 2. Every other combination has been tested to death and the 20/2 pair is standard for a reason: it makes a band touch a two-sigma event on a stable 20-bar window. The RSI length and levels can be tightened for volatile instruments; the regime filter is where the work goes.
Reference data
| Item | Value |
|---|---|
| Type | Mean reversion, two-condition, range-only |
| Bollinger Bands | SMA 20 ± 2 standard deviations (John Bollinger, 1980s) |
| RSI | 14-period, 30 / 70 (Wilder, 1978) |
| Entry | Both conditions on one candle, then a close back inside the band |
| Stop | ~15% of the band width beyond the touch extreme |
| Targets | Middle band first; opposite band second, only in a clean range |
| Regime filter | Choppiness Index > 61.8, ADX < 20, band width flat — at least one, better two |
| Do not trade | Band walks (bands expanding, price riding a band), squeezes (band width at a low), news candles |
| Best markets | Ranging forex majors on 1H–4H; index futures in lunch and overnight sessions; crypto 4H inside a defined range |
| TradingView | Built-in Bollinger Bands and RSI; the combination is a two-indicator layout, not a script |
Worked example: EURUSD 1-hour, a range trade and a walk avoided
EURUSD, 1-hour chart, a Tuesday with no scheduled data. The pair had been in a box between 1.0790 and 1.0940 for four days; the Choppiness Index (14) read 68, ADX (14) read 14, band width was 1.0% of price and flat. Regime: range. At 09:00 London a candle closed at 1.0812 with a low of 1.0808, the lower band at 1.0811 — %B 0.01 — and RSI at 27. Both conditions. The 10:00 candle closed at 1.0827, inside the band. Long at 1.0827, stop at 1.0791 (fifteen per cent of the 110-pip band width below the touch), 36 pips of risk. Target 1 the middle band at 1.0866, 39 pips, 1.1R; target 2 the upper band at 1.0921.
The middle band filled at 15:00 the same day; two-thirds off. The remainder reached 1.0908 the next morning, thirteen pips short of the upper band, before RSI rolled over at 64 and the position was closed at 1.0902 — 75 pips, 2.1R on the runner. Blended 1.4R for a trade that took eighteen hours and was decided by two indicators agreeing inside a box the regime filter had already confirmed.
The walk avoided, same pair, the following week: an ECB press conference, a close at 1.0752 through the lower band with RSI at 22. Both conditions. But band width had jumped from 1.0% to 1.9% in three candles, ADX had crossed above 25, and the Choppiness Index had dropped to 41. Regime: trend. No trade. The pair walked the lower band to 1.0640 over the next two sessions; every long taken on the "signal" was stopped. The setup was identical to the one that paid; the filter was the difference.
Mistakes traders make with Bollinger + RSI
- Trading it in a trend. It is a range strategy. The regime check comes first, and it is the strategy.
- Entering on the band touch. The trigger is the close back inside; the touch is the setup.
- Taking one condition. A band touch with RSI at 45, or RSI at 25 with price mid-band, is not the setup.
- Placing the stop at the band. Price re-tests the band constantly; the stop goes beyond the touch extreme.
- Holding for the opposite band every time. The middle band is where the trade is paid; the far band is a bonus in clean ranges.
- Trading it at the end of a squeeze. Narrow bands precede breakouts, not reversals.
- Tuning the bands. 20/2 is the standard; the work is in the filter, not the settings.
Bollinger + RSI and the free indicators
Both indicators are TradingView built-ins and need nothing else. The library supplies the regime filter that turns the pair into a strategy: the Keltner Rings script reads band walks and squeezes directly, the Adaptive Trend Sentinel gives a regime line that says whether the market is in a box, and the Volatility Storm Tracker flags the squeezes to stand aside from. The Multi-Oscillator Divergence Scanner adds the RSI divergence that makes a band-touch reversal more likely. The premium engine, Zeno, prints buy and sell signals with a stop and targets and carries its own regime filter; a Zeno buy signal at the lower band with RSI under 30 inside a confirmed range is this strategy with the filter already applied.
Two mean-reversion indicators agreeing, inside a range, with a one-candle confirmation. Check the regime first — Choppiness, ADX, band width — then wait for price at the band and RSI at the extreme together, enter on the close back inside, stop beyond the touch, and take most of it at the middle band. Skip band walks, skip squeezes, keep 20/2, and put the effort into the filter.
◆ Interactive check
Do you know when the setup is a trap?
Questions traders ask about the Bollinger Bands + RSI strategy
A mean-reversion setup that requires two things on the same candle — price at or beyond a Bollinger Band (20 periods, 2 standard deviations) and RSI (14) beyond 30 or 70 — then a close back inside the band as the trigger. Long from the lower band toward the middle band, short from the upper band, with the stop just beyond the band touch.
Each fails differently. Bands say price is stretched but walk the band in trends; RSI says momentum is stretched but stays extreme in trends. Requiring both removes roughly two-thirds of the signals, including many band walks where RSI has already eased off the extreme.
Bollinger 20 and 2.0, RSI 14 with 30/70. For volatile instruments such as crypto, 2.5 deviations and 25/75 give fewer, better setups. Do not shorten the RSI to 7; the improvement comes from adding a regime filter, not from faster settings.
No. In a trend price walks the band and RSI stays beyond 70 or 30 for many candles, so the setup appears constantly and every trade against the trend is stopped. The strategy is range-only, and a filter — Choppiness Index above 61.8, ADX below 20, band width not expanding — is what keeps it out of trends.
A little beyond the extreme of the candle that touched the band — about 15% of the band width — not at the band itself, because price re-tests the band often before reverting. If price closes beyond the band again after entry, the walk has started and the stop is doing its job.
The middle band — the 20-period average — for most of the position; that is where a mean-reversion trade is paid. The opposite band is a second target only in a clean, well-defined range, and only for a small remainder.
Price riding the upper or lower band for many consecutive candles while the bands expand, which is what a strong trend looks like on Bollinger Bands. Every candle in a walk satisfies the strategy's conditions and every counter-trend trade loses. Expanding band width and rising ADX are the tells.
On 4-hour BTCUSDT and ETHUSDT inside a defined range, with 2.5-deviation bands and a regime filter, yes. Crypto trends hard and walks bands for days, so the filter matters more than on forex. On low timeframes of thin altcoins the bands are noise.
Opposite trades. The squeeze looks for bands at their narrowest and trades the breakout that follows — a trend entry. This strategy looks for a band touch in a stable range and trades the reversion. Narrow bands at a multi-month low are a reason not to take the mean-reversion trade.
Both are TradingView built-ins. The library supplies the regime filter: Keltner Rings reads band walks and squeezes, the Adaptive Trend Sentinel gives the regime line, the Volatility Storm Tracker flags squeezes, and the Multi-Oscillator Divergence Scanner adds RSI divergence. Zeno, the premium engine, prints signals with stops and targets and carries its own regime filter.
References & Related Guides
Read next
- Bollinger Bands: Complete Guide
- RSI Indicator: Complete Guide
- Mean Reversion Trading
- Choppiness Index
- ADX Indicator: Complete Guide
- Squeeze Momentum Indicator
- Keltner Channels
- Fibonacci Bollinger Bands
- Keltner Rings (free indicator)
- Volatility Storm Tracker (free indicator)
- Squeeze — glossary
- Zeno — the premium engine