Aroon Indicator: Aroon Up, Aroon Down and the Oscillator, Explained for Traders
The Aroon indicator measures how recently a market made its highest high and lowest low over a lookback, usually 25 bars. Aroon Up = ((25 − bars since the 25-bar high) ÷ 25) × 100; Aroon Down is the same for the low; the Aroon Oscillator is Up minus Down. Up above 70 with Down below 30 is a trend; both lines below 50 is consolidation; both above 50 is a volatile range. The tradable signal is the cross with one line reaching 70+ at a break of structure, entered on the pullback — Aroon measures time, not distance, so it needs the chart to say whether the new high mattered.
Aroon is the indicator I recommend to people who want to understand what "trend" means to a computer, because it strips the idea down to one question: when did the last new high print? That question is answered fast and honestly, which makes Aroon an early trend detector and a relentless range whipsaw. This page is the two lines and the oscillator, the formula, the settings by timeframe, the cross-with-structure method, a BTCUSDT daily trend and the range trap that preceded it, and the comparison with ADX and Donchian. The calculator turns bar counts into readings.
Indicators that prove themselves in public.
One engine, four precision tools — the Gold (XAU) Scalper, the institutional Gravity Zone, the Zeno momentum Oscillator, and Zeno Stocks for equities.



What the Aroon indicator measures
Aroon measures time, not price. Aroon Up asks: how many bars ago did the highest high of the last 25 bars print? If it was this bar, Aroon Up is 100; if it was 25 bars ago, Aroon Up is 0. Aroon Down asks the same about the lowest low. That is the whole indicator — two lines between 0 and 100 that say how recently the market made a new high and a new low — and the Aroon Oscillator is simply Up minus Down, running from −100 to +100.
Tushar Chande published it in 1995 (the name is Sanskrit for "dawn's early light") as a way to detect the start of a trend earlier than moving averages can. The logic is that a market beginning an uptrend prints new highs often, so Aroon Up stays near 100 while Aroon Down, with no new lows, drifts toward 0. In a range neither line stays high; in a reversal the lines cross.
What it does not measure: the size of the move. A market that made its 25-bar high one bar ago by one tick and a market that made it by 5% both read Aroon Up 96. That is the indicator's strength — it is unbothered by volatility — and the reason it needs a structure filter before it is tradable. Aroon tells you the market has been making highs; the chart tells you whether those highs matter.
The two lines and the oscillator
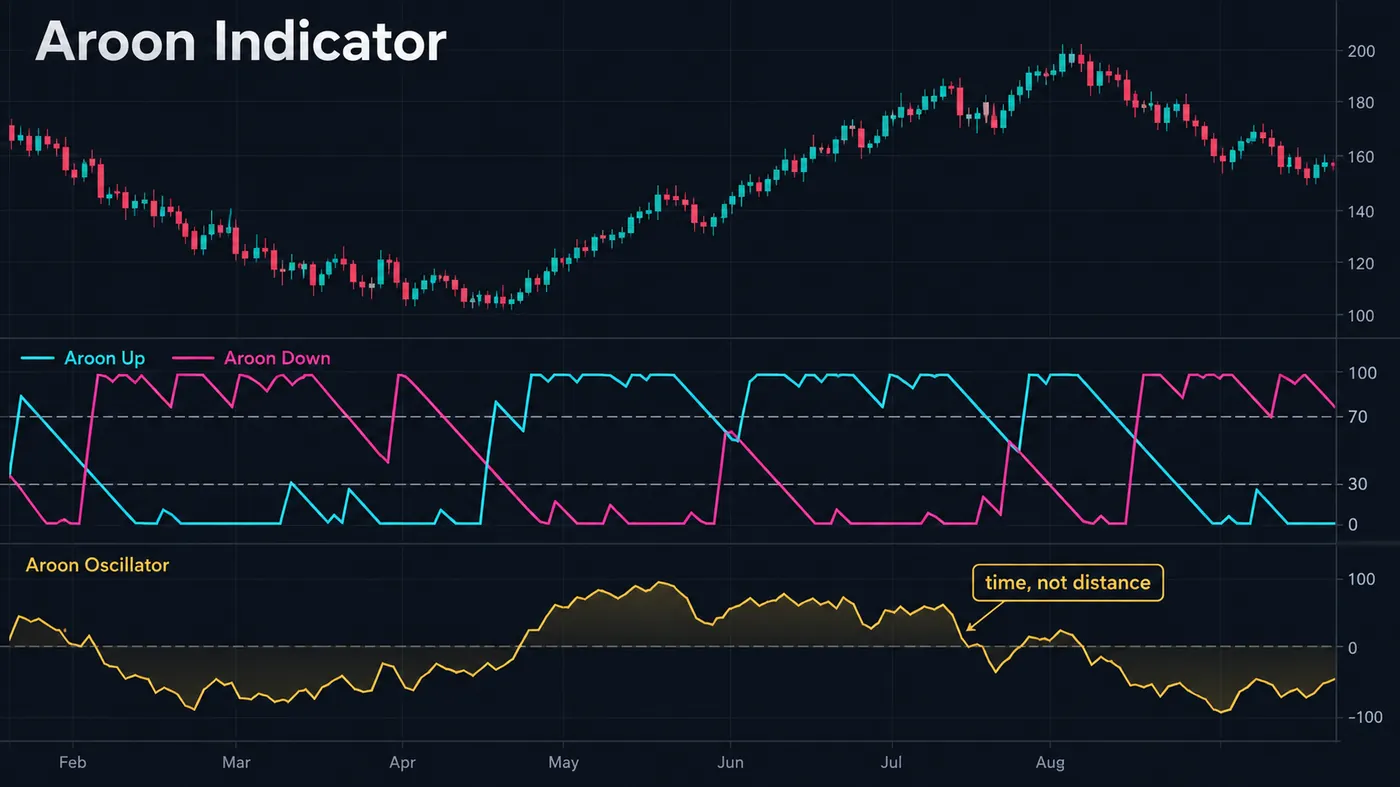
| Reading | Aroon Up | Aroon Down | Oscillator | What it usually means |
|---|---|---|---|---|
| Strong uptrend | Above 70 | Below 30 | Above +40 | New highs keep printing, no new lows for weeks |
| Strong downtrend | Below 30 | Above 70 | Below −40 | The mirror |
| Emerging uptrend | Crosses above Down and rises through 50–70 | Falling | Crosses zero upward | The signal most traders use; confirm with a structure break |
| Consolidation | Below 50 | Below 50 | Near zero | No recent extreme either side; a breakout is pending |
| Volatile range | Above 50 | Above 50 | Near zero | A new high and a new low both inside the window — whipsaw territory |
| Parallel lines | Both moving together | Both moving together | Flat | No information; wait |
The 70/30 levels are Chande's suggestion and hold up well on daily charts. The cross is what generates trades, and the cross is also what generates most of the losses, because in a range the lines cross every few bars. The oscillator condenses the two lines into one and is easier to read but hides the "both high" case, which is the one that tells you not to trade.
The formula
| Quantity | Formula | Default |
|---|---|---|
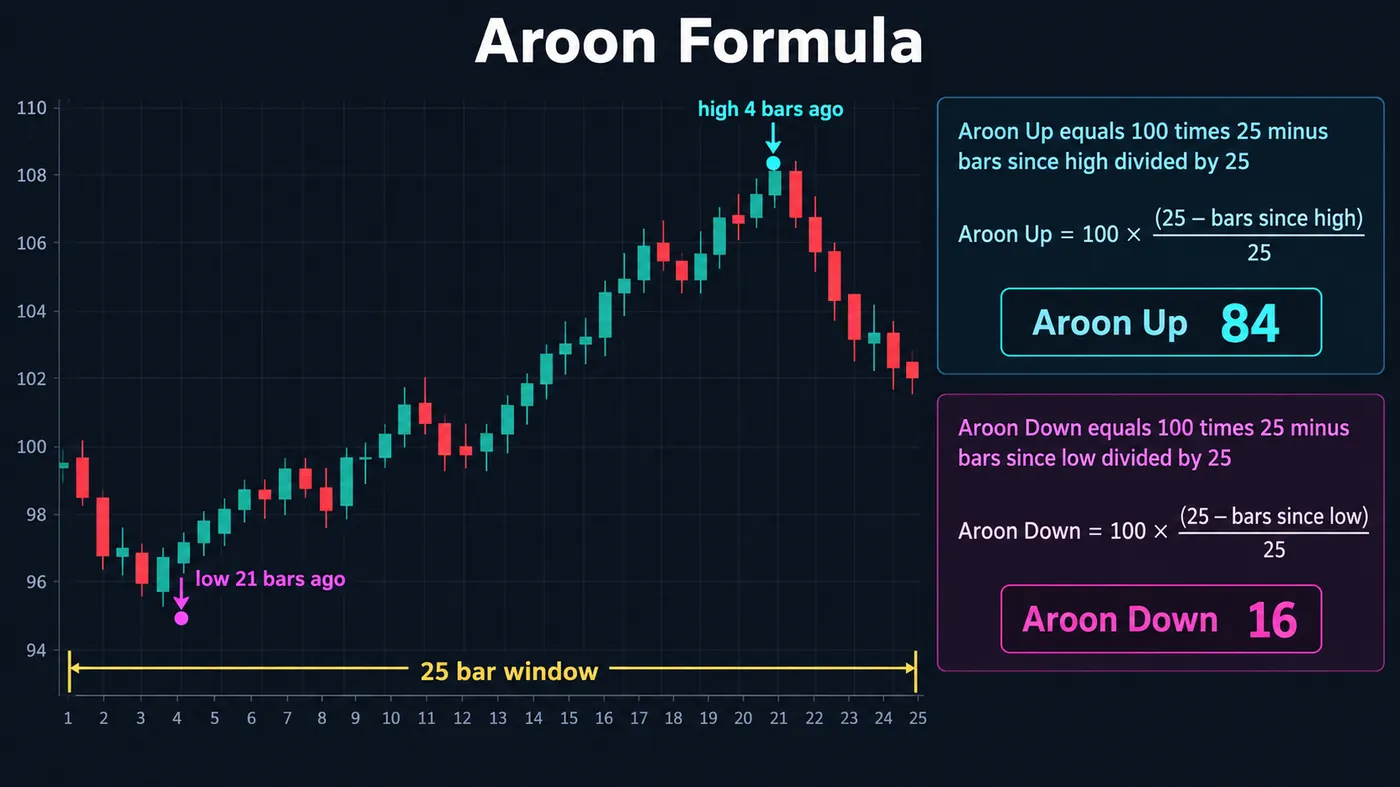
| Aroon Up | ((n − bars since the n-period high) ÷ n) × 100 | n = 25 |
| Aroon Down | ((n − bars since the n-period low) ÷ n) × 100 | n = 25 |
| Aroon Oscillator | Aroon Up − Aroon Down | −100 to +100 |
| Signal levels | 70 and 30 on the lines; zero on the oscillator | Chande (1995) |
Two details matter. First, TradingView's built-in uses the high and low of each bar, not the close, so an intrabar spike resets Aroon Up to 100 even if the bar closed lower — which is correct for what the indicator measures but surprises people who expect close-based behaviour. Second, the count is bars, so on a 4-hour chart a 25-period Aroon looks back about four days and on a daily chart about five weeks; the same setting is a different indicator on each timeframe.
| Use | Period | Levels | Note |
|---|---|---|---|
| Default (Chande) | 25 | 70 / 30 | Daily charts; the setting most research uses |
| Swing, daily | 25 | 70 / 30 | Keep it; shorter periods add crosses, not information |
| 4H crypto and indices | 25–40 | 70 / 30 | Longer lookback offsets 24-hour noise on 4H |
| Intraday 15M | 14 | 80 / 20 | Only with a session or VWAP filter; crosses are constant |
| Weekly | 13–25 | 70 / 30 | Regime read; a 25-week Aroon is a half-year clock |

Automate your trades. Let Quantum Algo trade for you.
Every signal executed on your own account — on your account, with the plan you define.
How to trade it
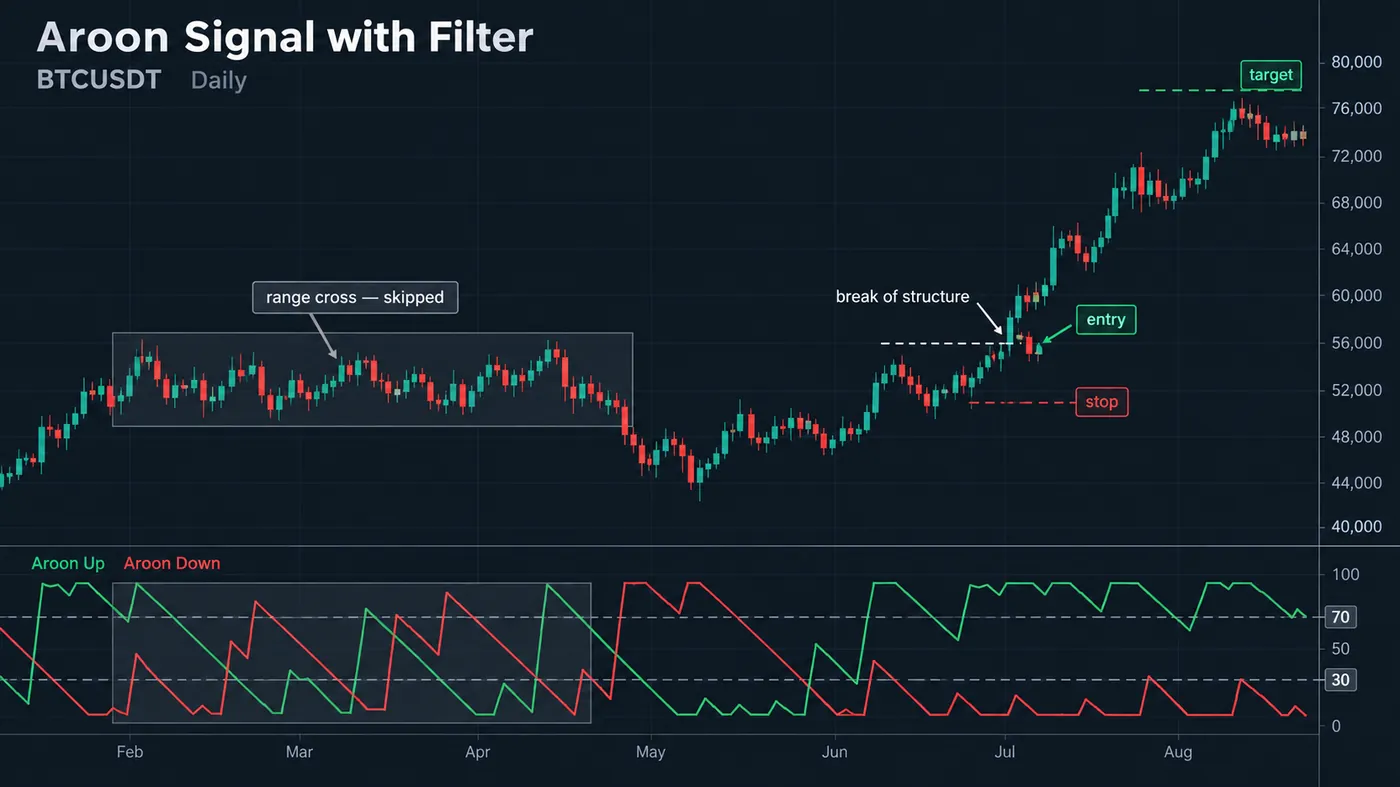
- Read the regime first. If both lines are below 50 the market is consolidating; if both are above 50 it is a volatile range. Neither is a trade. The cross only means something when one line goes to 100 on a fresh extreme and the other is falling.
- Wait for the cross with a level above 70. Aroon Up crossing above Aroon Down and reaching 70 or more within a few bars, while Aroon Down drops under 30. A cross where both lines sit at 55 is a range cross.
- Require a structure break. The new 25-bar high that sent Aroon Up to 100 should also be a break of structure — a close above the last swing high — not a wick. Aroon on its own cannot tell a break from a sweep; the chart can.
- Enter on the pullback, not the cross bar. By the time Aroon reads 100/16 the breakout bar is done. The entry is the first pullback that holds — a retest of the broken swing, an order block, or the last higher low — while Aroon Up stays above 70.
- Stop under the last higher low. Not under an Aroon reading. The indicator has no idea where support is.
- Exit when Aroon Down rises above 50, or on structure. Aroon Down climbing means a new 25-bar low is getting recent, which is the trend losing its clock. The cleaner exit is the chart: a close below the last higher low.
Aroon calculator
Set the lookback and enter how many bars ago the highest high and the lowest low printed. The tool returns Aroon Up, Aroon Down, the oscillator and the regime — including the two readings (both high, both low) that mean stand aside.
Aroon versus ADX, DMI and moving-average crosses
| Indicator | Measures | Speed | Range behaviour | Where Aroon differs |
|---|---|---|---|---|
| Aroon | How recently the n-bar high and low printed | Fast — one bar to reach 100 | Constant crosses | — |
| ADX / DMI | Trend strength from directional movement | Slow — smoothed over 14 | Stays low, which is useful | ADX says how strong; Aroon says how recent. ADX filters ranges better |
| MA cross | Average price over two windows | Slow — lags by half the window | Whipsaws | Aroon triggers on the first new high; an MA cross needs price to pull the averages |
| Donchian channel | The n-bar high and low themselves | Same event as Aroon 100 | Same whipsaws | Aroon is a Donchian breakout counted in bars; they fire together |
The most useful pairing is Aroon with ADX: Aroon for the early signal, ADX above 20 or 25 as the filter that removes the range crosses. On its own Aroon is a Donchian breakout system with a time decay, and Donchian systems are profitable only with a filter and a wide stop.
Reference data
| Item | Value |
|---|---|
| Origin | Tushar Chande, Technical Analysis of Stocks & Commodities, September 1995 |
| Aroon Up | ((n − bars since n-bar high) ÷ n) × 100 |
| Aroon Down | ((n − bars since n-bar low) ÷ n) × 100 |
| Oscillator | Up − Down, −100 to +100 |
| Default period | 25 |
| Levels | 70 (strong) and 30 (weak) on the lines; zero on the oscillator |
| Input | Bar highs and lows (not closes) in the TradingView built-in |
| Reads as | Recency of extremes — time, not distance |
| Primary signal | Cross with one line above 70 and the other below 30, confirmed by a structure break |
| Stand-aside readings | Both lines below 50 (consolidation) or both above 50 (volatile range) |
| Best pairing | ADX above 20–25 as a range filter |
| TradingView | Built-in "Aroon" (length 25); "Aroon Oscillator" separately |
Worked example: BTCUSDT daily, a trend start and a range trap
BTCUSDT daily, after a six-week range between 58,200 and 64,900. On day 1 of the move price closes at 65,340, above the range high: Aroon Up jumps from 28 to 100, Aroon Down sits at 12 (the range low was 22 days back), the oscillator prints +88. The close above 64,900 is a break of structure on the daily. That is the setup — but not the entry; the breakout bar has already happened.
Day 4, price pulls back to 64,600 and closes at 65,050, retesting the range high from above and holding it. Aroon Up has decayed to 88, still far above 70; Aroon Down is 0 — no new low in 25 bars. Long at 65,050, stop at 63,400 under the last higher low inside the range, 1,650 of risk. Target the measured move of the range: 6,700 points above the breakout, 71,600, 4R.
The trend ran nineteen days. Aroon Up stayed above 70 throughout — every few days a new high reset it to 100 — and Aroon Down never exceeded 24. Price reached 71,800 on day 23 and closed the target for 4R. Aroon Down rose to 56 on day 27 when a five-day pullback printed a 25-bar low; a trader still holding would have exited there at roughly 3.4R.
The trap, same chart, five weeks earlier inside the range. Aroon Up crossed above Aroon Down on a push to 63,900 — Up 100, Down 40 — and reversed two days later. No structure break (the range high held), Aroon Down never dropped under 30, and a trader taking the cross alone was stopped in three days. The indicator did nothing wrong; it reported a recent high. The chart said it was a high inside a box.
Where Aroon fails
Ranges. The lines cross constantly and both often sit above 50. This is where most of Aroon's losing trades come from and why the both-high reading matters more than the cross.
Spikes and sweeps. A one-bar wick to a new high sends Aroon Up to 100 and it takes 25 bars to decay. A liquidity sweep that reverses the same bar reads exactly like a breakout. The structure filter exists for this.
Late in a trend. Aroon Up at 100 on the twentieth new high looks the same as on the first. It cannot tell early from late; the distance from the last higher low and the size of recent candles can.
Distance blindness. Aroon reads the same for a new high by one tick and by 5%. Pair it with ATR or with the size of the breakout bar before sizing the trade.
Short periods. A 7- or 10-bar Aroon is a coin flip with a chart under it. Keep 25 and change the timeframe instead.
Mistakes traders make with Aroon
- Trading every cross. A cross with both lines around 50 is a range, not a signal.
- Reading 100 as "strong". It means a new high printed this bar; strength is a separate question.
- Entering on the cross bar. The breakout has happened; enter on the pullback that holds.
- Stopping out on an Aroon reading. The stop belongs under structure.
- Shortening the period to get more signals. You get more crosses, which is the problem, not the solution.
- Skipping the both-high check on the oscillator. The oscillator near zero can be a dead range or a violent one; the two lines tell you which.
Aroon and the free indicators
TradingView's built-in Aroon is exactly Chande's and does not need a replacement. What it lacks is the filter, and the library supplies two: the Smart Money Concepts Engine marks the break of structure that turns an Aroon 100 into a trend start rather than a sweep, and the Directional Strength Index is the ADX-style strength read that keeps you out of the both-high ranges. The Adaptive Trend Sentinel answers the regime question Aroon cannot. The premium engine, Zeno, prints buy and sell signals with a stop and targets and carries its own regime filter; a Zeno buy signal on the first pullback after Aroon Up hits 100 at a structure break is one of the cleanest continuation contexts it has.
A clock for extremes. Aroon Up at 100 means a new high printed this bar; it says nothing about how big. Trade the cross only when one line reaches 70 and the other drops under 30 at a structure break, enter on the pullback, stop under the last higher low, and stand aside when both lines sit below 50 or both above 50. Keep the period at 25 and pair it with ADX or structure for the range filter Aroon does not have.
◆ Interactive check
Do you know what Aroon counts?
Questions traders ask about the Aroon indicator
A pair of lines from 0 to 100 that measure how recently a market made its highest high (Aroon Up) and lowest low (Aroon Down) over a lookback, usually 25 bars. It was published by Tushar Chande in 1995 to detect trend starts earlier than moving averages.
Aroon Up = ((n − bars since the n-period high) ÷ n) × 100 and Aroon Down = ((n − bars since the n-period low) ÷ n) × 100, with n usually 25. A high printed this bar gives 100; one printed 25 bars ago gives 0. The Aroon Oscillator is Up minus Down.
Keep the period at 25 with 70 and 30 as the levels on daily charts. On 4-hour crypto or index charts 25 to 40 works; on 15-minute charts use 14 with 80/20 and a session filter. Shortening the period adds crosses, not information — change the timeframe instead.
Read the regime first: both lines under 50 is consolidation, both over 50 is a volatile range, and neither is a trade. Take the cross only when one line reaches 70 and the other drops under 30 at a break of structure, enter on the first pullback that holds, stop under the last higher low, and exit when Aroon Down rises above 50 or price closes below structure.
That the highest high of the lookback printed on the current bar. It does not say how large the move was; a one-tick wick and a 5% breakout both read 100. Check the chart for a structure break before treating it as a trend start.
Aroon measures how recently extremes printed (time); ADX measures directional movement strength (magnitude), smoothed over 14 bars. Aroon is faster and whipsaws in ranges; ADX is slower and stays low in ranges. Together — Aroon for the trigger, ADX above 20–25 as the filter — they cover each other's weakness.
It is easier to read but hides the "both high" case, where a new high and a new low both printed recently and the oscillator sits near zero. That is the reading that says stand aside, and only the two lines show it.
On daily and 4-hour BTCUSDT and ETHUSDT charts, with a structure or ADX filter, yes; the worked example on this page is one. On low timeframes the 24-hour noise produces constant crosses. Use 25 to 40 on 4H.
No. It depends only on completed bars' highs and lows and the bar count; a value never changes once its bar closes. Intrabar it can move on the current bar, like any indicator.
The TradingView built-in is exact and does not need replacing. The library supplies the filters Aroon lacks: the Smart Money Concepts Engine for the structure break, the Directional Strength Index for an ADX-style strength read, and the Adaptive Trend Sentinel for regime. Zeno, the premium engine, prints signals with stops and targets and has its own regime filter.
References & Related Guides
Read next
- ADX Indicator: Complete Guide
- Donchian Channels
- Moving Averages: Complete Guide
- BOS & CHoCH: Market Structure
- Williams Alligator
- Breakout Trading Strategy
- Choppiness Index
- Momentum Trading Strategy
- Directional Strength Index (free indicator)
- Adaptive Trend Sentinel (free indicator)
- Smart Money Concepts Engine (free indicator)
- Zeno — the premium engine