Bitcoin Dominance Explained: What BTC.D Means and How to Use It
What is Bitcoin dominance and how do you use it?
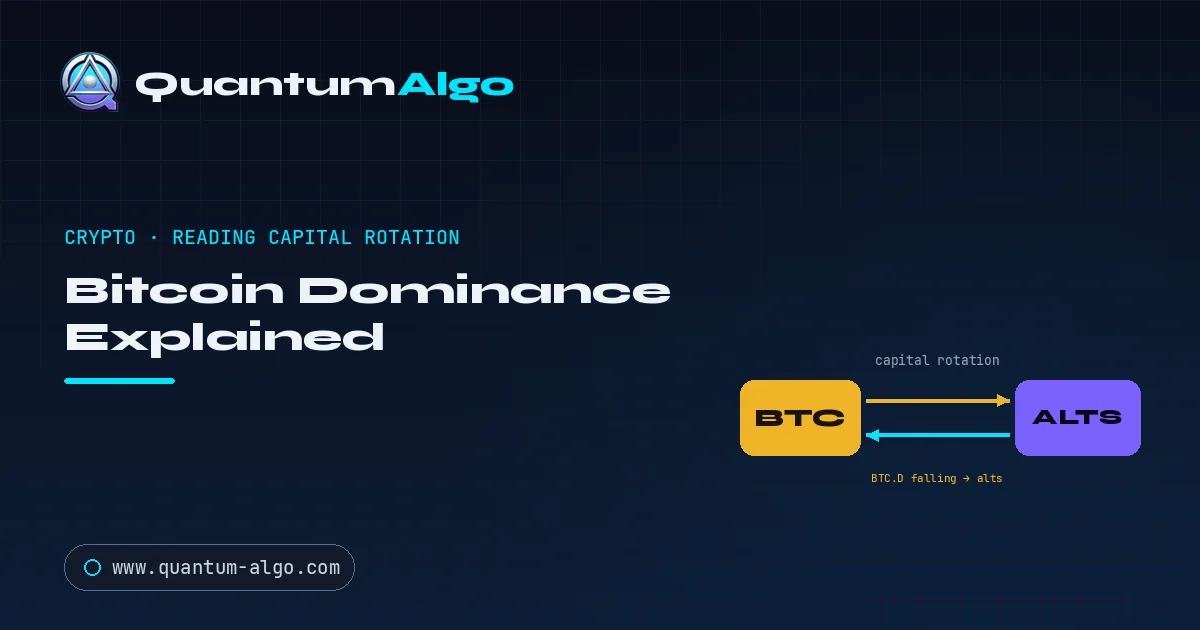
Bitcoin dominance (BTC.D) is Bitcoin's market capitalization as a percentage of the total crypto market, a capital-rotation gauge rather than a price gauge. Rising dominance means money is flowing into Bitcoin relative to altcoins; falling dominance means it is rotating into alts. Read it against total market cap: falling dominance while the market rises is the classic altcoin-season signal.
Bitcoin dominance (BTC.D) is Bitcoin’s share of the total crypto market capitalisation — and it’s used as a capital-rotation gauge. Rising dominance means money is flowing into Bitcoin relative to altcoins; falling dominance means money is rotating out of BTC into alts. The key is to read it against the total market: falling dominance while the market rises is the classic altcoin-season signal, while rising dominance in a falling market is a flight to Bitcoin where altcoins bleed hardest. It’s a regime and timing tool for rotation — pair it with structure for the actual entries.
Indicators that prove themselves in public.
One engine, four precision tools — the Gold (XAU) Scalper, the institutional Gravity Zone, the Zeno momentum Oscillator, and Zeno Stocks for equities.
Bitcoin dominance is one of the most quoted numbers in crypto and one of the most misunderstood. Traders see it tick up and assume "Bitcoin is winning," or see it fall and assume "alts are pumping" — but dominance in isolation means almost nothing. Its power comes from reading it against the total market, because that combination tells you where capital is rotating and which part of the cycle you're in. This guide explains exactly what dominance measures, what rising and falling readings mean, the four-quadrant framework professionals use, how to time altcoin exposure with it, and the caveats that trip most people up.
| What it is | Bitcoin's market cap as a percentage of total crypto market cap |
| Rising BTC.D | Capital rotating into Bitcoin relative to altcoins |
| Falling BTC.D | Capital rotating out of Bitcoin into altcoins |
| The key | Read it against the total market — direction of both matters |
| Best use | Timing altcoin exposure and reading cycle position |
| The caveat | Stablecoins and ETH distort the raw number — read the trend, not the digit |
| Pair with | Fear & Greed, altcoin season, and chart structure |
What does Bitcoin dominance actually measure?
Bitcoin dominance is simply Bitcoin's market capitalisation expressed as a percentage of the entire crypto market's capitalisation. If the total crypto market is worth one trillion dollars and Bitcoin accounts for half of it, dominance is 50%. It's a relative measure — it can rise because Bitcoin gains value, or because altcoins lose value faster than Bitcoin, or both. That's the first thing most people get wrong: dominance rising does not automatically mean Bitcoin's price is up. It means Bitcoin is outperforming the rest of the market, whichever direction price is moving. Because it's a share-of-market number, it's a rotation gauge, not a price gauge.
What do rising and falling Bitcoin dominance signal?
Read directionally, dominance tracks the market's risk appetite. Rising dominance usually reflects capital seeking the relative safety of Bitcoin — either early in a bull run when Bitcoin leads, or during fear when traders flee volatile altcoins for the "blue chip" of crypto. Falling dominance means capital is rotating down the risk curve into altcoins, which typically happens once Bitcoin's move matures and traders reach for higher beta. This is why dominance is the backbone of altcoin timing: alts tend to underperform while dominance rises and outperform while it falls. But "rising" and "falling" only make sense alongside what the total market is doing — which is where the quadrant framework comes in.
How does the four-quadrant dominance framework work?
Combining the direction of dominance with the direction of the total market gives four regimes, each with a clear implication for how to position. Falling dominance + rising market = alt season: the total pie is growing and Bitcoin's slice is shrinking, so capital is flooding into alts — the best environment for altcoin longs. Rising dominance + rising market = Bitcoin-led bull: money is entering crypto but concentrating in Bitcoin; alts lag, so favour BTC and majors. Rising dominance + falling market = flight to Bitcoin: the market is contracting and traders are hiding in BTC — alts bleed hardest here, so reduce altcoin exposure. Falling dominance + falling market = alt capitulation: both are falling and alts are losing even against a falling Bitcoin — the deepest-risk zone, and historically where the most washed-out entries eventually form.
How do you time altcoin exposure with dominance?
The practical playbook follows the quadrants. When dominance is high and rising, keep exposure concentrated in Bitcoin and majors and be patient with alts — they'll underperform. When dominance stalls at a high level and begins to roll over while the market holds up, that shift is the earliest tell that rotation into altcoins is starting; it's the cue to build alt exposure selectively. As dominance falls through a full alt season, capital rotates progressively into higher-risk coins — but that same rotation is a warning that the cycle is maturing. When dominance carves out a bottom and starts to climb again, it's the signal to rotate profits back into Bitcoin or stablecoins before alts give back their gains. Dominance won't give you the exact top or bottom, but it maps the tide you're swimming in.
What distorts the Bitcoin dominance number?
Three things make the raw dominance figure less clean than it looks. First, stablecoins are part of total market cap, so a flight to stablecoins during fear can move dominance in ways that don't reflect a pure BTC-versus-alts rotation. Second, Ethereum is large enough that "ETH dominance" and BTC/ETH rotation can drive the number independently of the broader alt market — many traders watch dominance excluding the top few coins for a cleaner altcoin read. Third, the metric is relative: a rising figure during a market-wide crash simply means Bitcoin is falling less, which is defensive, not bullish. The fix for all three is the same — read the trend and the quadrant, never the isolated digit.
| Isolated number | Directional + quadrant | |
|---|---|---|
| Question asked | Is BTC.D up or down? | Which quadrant are we in? |
| Rising in a crash | “Bitcoin bullish” (wrong) | Flight to safety — alts bleed |
| Falling in a rally | “Alts dumping” (wrong) | Alt season — rotate into alts |
| Timing value | None | Maps capital rotation |
| Distortions | Ignored | Adjusts for stablecoins & ETH |
| Outcome | Confusion | A rotation roadmap |
Combining dominance with sentiment and altcoin season
Dominance is one of three regime gauges that are strongest together. The Fear & Greed Index tells you how the crowd feels; dominance tells you where capital is rotating; the altcoin season index tells you how far that rotation has gone. Extreme fear with rising dominance is textbook capitulation into Bitcoin — often a late-stage bottoming signal. Extreme greed with falling dominance is the frothy, late-cycle altcoin blow-off — a signal to de-risk. Reading the three as a system gives you a cycle map that no single metric provides, and it keeps you from mistaking a defensive dominance spike for genuine strength.
How does Bitcoin dominance move through a market cycle?
Over a full crypto cycle, dominance traces a recognisable arc. Early in a recovery, capital concentrates in Bitcoin as the safest way to gain crypto exposure, and dominance rises — the "Bitcoin leads" phase. As Bitcoin's trend matures and confidence grows, traders reach for higher returns and rotate into large-cap alts, then mid-caps, then speculative small-caps; dominance falls through this stretch, which is the alt season. Near the euphoric top, dominance often bottoms while the riskiest coins go parabolic — a classic late-cycle tell. Then, as the cycle turns down, capital flees back to Bitcoin (and stablecoins) faster than it left, dominance spikes, and altcoins suffer their steepest drawdowns. Knowing where dominance sits in this arc tells you whether you're early, mid, or late in the rotation — and how much altcoin risk is appropriate.
How is BTC dominance different from altcoin dominance?
Because Ethereum and the stablecoins are so large, many traders don't stop at the headline BTC.D figure. Watching "others" dominance — the market excluding Bitcoin, Ethereum and stablecoins — isolates the pure speculative-altcoin appetite, which is what actually drives an alt season. A falling BTC.D that's mostly flowing into Ethereum is a very different signal from one flowing into small-cap alts: the former is a measured rotation into the second-largest asset, the latter is late-cycle risk-seeking. Reading BTC dominance alongside ETH and "others" dominance turns a single blunt number into a layered map of exactly which part of the market capital is favouring.
A practical workflow
Establish the quadrant: note the direction of dominance and of the total market — that pair defines the regime. Set exposure: concentrate in Bitcoin when dominance rises, rotate into alts as it falls and the market holds. Cross-check sentiment and season: confirm with the Fear & Greed Index and the altcoin season index before committing to a rotation. Time the entry with structure: dominance sets the bias, but take the actual trade only when Quantum Algo confirms a change of character on the coin's chart. Rotate profits back to BTC when dominance bottoms and turns up. Size for survival — alts move violently, so keep risk small and take profit into strength.

Automate your trades. Let Quantum Algo trade for you.
Every signal executed on your own account — 24/7, hands-off.
Frequently Asked Questions
Bitcoin dominance (BTC.D) is Bitcoin's market capitalisation as a percentage of the total crypto market capitalisation. If Bitcoin is half of all crypto value, dominance is 50%. It's a relative, share-of-market measure — a rotation gauge rather than a price gauge.
It means Bitcoin is outperforming the rest of the market — capital is rotating into Bitcoin relative to altcoins. That can happen early in a bull run when Bitcoin leads, or during fear when traders flee volatile alts for the relative safety of BTC. It doesn't automatically mean Bitcoin's price is up.
Capital is rotating out of Bitcoin into altcoins — Bitcoin is underperforming the broader market. Falling dominance while the total market rises is the classic altcoin-season signal, as money moves down the risk curve into higher-beta coins.
Not necessarily. Dominance is relative, so it can rise because Bitcoin gains value or because altcoins fall faster than Bitcoin. Rising dominance during a market-wide crash just means Bitcoin is falling less — that's defensive, not bullish. Always read it against the total market.
Concentrate in Bitcoin and majors while dominance is high and rising, since alts underperform. When dominance rolls over from a high while the market holds up, that's the earliest cue to build altcoin exposure. When dominance bottoms and turns up, rotate profits back to Bitcoin before alts give back gains.
It combines the direction of dominance with the direction of the total market: falling dominance + rising market = alt season; rising dominance + rising market = Bitcoin-led bull; rising dominance + falling market = flight to Bitcoin (alts bleed); falling dominance + falling market = alt capitulation. The quadrant, not the raw number, is the signal.
Because stablecoins are part of total market cap (a flight to stables distorts it), Ethereum is large enough to move it independently of the broader alt market, and the metric is relative (a rise can just mean Bitcoin falls less). Reading the trend and quadrant, and sometimes excluding the top coins, cleans up these distortions.
There's no single magic level — what matters is the direction. Alt seasons have historically begun once dominance peaks and starts falling while the total market holds up or rises. Watch for dominance rolling over from a high, confirmed by the altcoin season index, rather than a specific percentage.
Many traders watch a version that excludes stablecoins, and sometimes the top few coins, for a cleaner Bitcoin-versus-altcoins read — because stablecoin flows and ETH can distort the standard figure. Whichever you use, be consistent and focus on the trend and quadrant, not the exact digit.
Dominance sets the rotation bias — which part of the market to favour — while Quantum Algo provides the entry. You use the quadrant to decide whether to be in Bitcoin or alts, then let Quantum Algo confirm a non-repainting change of character and mark the exact entry, stop and targets on the specific coin's chart.
References & Related Guides
More in this topic
- ADX Indicator: Complete Trading Guide
- AlphaTrend Indicator: Complete Trading Guide
- ATR (Average True Range): Complete Trading Guide
- Awesome Oscillator: Complete Indicator Guide
- What Are the Best Volume Indicators?
- Bollinger Bands — Complete Trading Indicator Guide
- CCI Indicator: Complete Guide
- Chandelier Exit: Complete Trading Guide
- Donchian Channels: Complete Indicator Guide
- Fibonacci Bollinger Bands: Complete Trading Guide
- Fibonacci Retracement — Complete Trading Guide
- Hull Moving Average (HMA): Complete Trading Guide
- Gaussian Channel Indicator Guide
- Best Buy/Sell Indicator Guide
Core reading
- BOS & CHoCH: Complete Market Structure Guide
- Order Blocks Trading: Complete Guide
- Best TradingView Indicators — Complete Guide
- Risk Management in Trading — Complete Guide
- Candlestick Patterns Guide — Engulfing, Pinbar & More
- All Premium Guides
- Quantum Algo on TradingView
- Public Track Record
Authoritative sources
For a focused comparison, read the stablecoin dominance beside BTC.D before applying the setup.
For the next decision, continue with the total crypto market-cap context and keep the execution rule separate from the context.
For the next decision, continue with breadth beside BTC dominance and keep the execution rule separate from the context.