What Is Total Crypto Market Cap (TOTAL)?
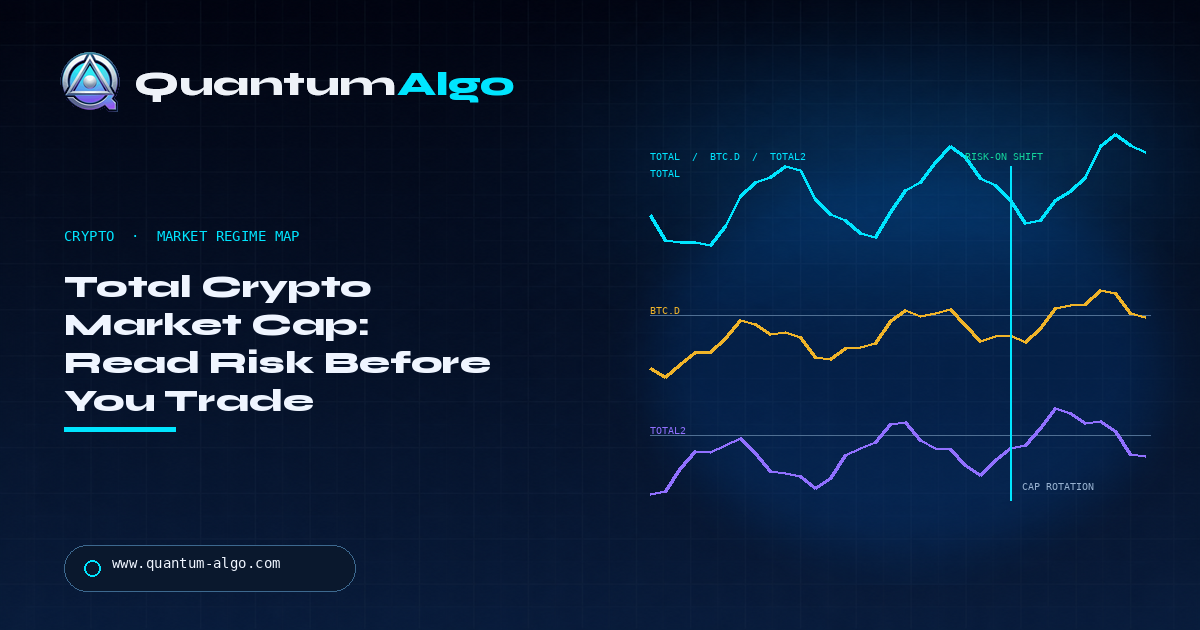
Total crypto market cap (TOTAL) is a context chart, not a buy signal. Use TOTAL to see whether the whole crypto market is expanding or contracting, compare it with BTC dominance and stablecoin dominance, then move to the coin chart for structure, entry, stop and target.
When I open a crypto chart, I do not want the first green candle to decide the story. I want to know whether market value is expanding across crypto, concentrating in Bitcoin, or moving into a defensive stablecoin bid. The TOTAL chart gives that first layer. TOTAL, TOTAL2 and TOTAL3 separate the size of the market from the part receiving attention. Quantum Algo’s free public indicators then help mark order blocks and fair value gaps on the execution chart; Zeno is the separate paid signal layer with Buy/Sell signals, SL/TP and built-in risk management.
Indicators that prove themselves in public.
One engine, four precision tools — the Gold (XAU) Scalper, the institutional Gravity Zone, the Zeno momentum Oscillator, and Zeno Stocks for equities.
Use the guide as a decision filter, not as a collection of labels. The market, the session and the invalidation still decide whether an idea deserves risk.
What does the TOTAL chart measure?
TOTAL tracks the combined market capitalization of the tracked crypto market. That makes it a breadth-of-value chart rather than a price chart for one coin. When TOTAL rises, the aggregate value assigned to the market is rising; when it falls, the market is losing value or the composition of the tracked universe has changed.
On a 4-hour TradingView layout, I use TOTAL as the first question: is the risk environment expanding enough to justify looking for long setups? A rising line under a clean weekly reclaim is a better backdrop than a rising line already pressing into a prior high. TOTAL gives context; it does not supply the invalidation.
| Chart | What it includes | Best use |
|---|---|---|
| TOTAL | All tracked cryptocurrencies | Overall risk appetite; the top-down starting point |
| TOTAL2 | Everything except Bitcoin | Whether alts as a group are following BTC |
| TOTAL3 | Everything except Bitcoin and Ether | Pure altcoin breadth; leads or lags BTC |
| BTC.D | Bitcoin share of TOTAL | Direction of rotation between BTC and alts |
| USDT.D | Tether share of TOTAL | Capital defensiveness; inverse of risk appetite |
| Symbols | CRYPTOCAP:TOTAL · CRYPTOCAP:TOTAL2 · CRYPTOCAP:TOTAL3 | Free on TradingView; apply the same structure tools as any chart |
How do TOTAL, TOTAL2 and TOTAL3 differ?
TOTAL is the broad market-cap view. TOTAL2 removes Bitcoin, while TOTAL3 removes Bitcoin and Ethereum. The trio separates a Bitcoin-led move from a wider altcoin rotation. If TOTAL rises but TOTAL3 remains flat, the market may be expanding through the largest assets while the alt basket waits.
Symbols and constituent rules can differ by data provider, so write the feed beside the chart in your journal. The practical test is comparative: does the line you chose move in a way that helps you rank setups on the execution market? A familiar label is not automatically a consistent data series.
How do you use TOTAL with BTC dominance and USDT.D?
The most useful TOTAL read comes from comparison. Rising TOTAL with falling or stable BTC.D can support a wider risk-on interpretation. Rising TOTAL with sharply rising BTC.D can still be bullish for Bitcoin while saying little about smaller altcoins. Rising USDT.D complicates the picture because stablecoin demand may reflect defensive positioning or changes in supply.
On a day when TOTAL makes a higher high but TOTAL3 rolls over and USDT.D rises, I downgrade aggressive altcoin continuations. That is not a short signal. It is a request for a better execution chart: a sweep, reclaim or break-and-retest with room to target. Disagreement prevents context from becoming a reason to chase.

Automate your trades. Let Quantum Algo trade for you.
Every signal executed on your own account — on your account, with the plan you define.
How does TOTAL change altcoin selection?
TOTAL cannot choose a coin, but it can change the standard a coin must meet. In a broad expansion, I can consider liquid altcoins that reclaim a daily level and hold above it. In a narrow Bitcoin-led move, I prefer fewer alt setups and demand cleaner liquidity, volume and structure.
On SOLUSDT, I would mark the daily low, the prior 4-hour swing and the current liquidity pool. If TOTAL3 is weak, a bullish reclaim on SOL can still work, but size and target should reflect the less supportive backdrop. Macro agreement improves selection; it does not erase a bad price location.
How do you build a TOTAL top-down trading plan?
Start on the weekly and daily TOTAL charts. Mark the current range, the last meaningful high and low, and whether value is expanding or contracting. Compare TOTAL2 and TOTAL3, then check BTC.D and USDT.D for concentration or defensive pressure. Only after that move to the execution market. Require one price event—such as a liquidity sweep and reclaim, displacement or break-and-retest—and write the invalidation before the order.
Suppose TOTAL3 reclaims a daily range high, BTC.D is flat and USDT.D is easing. On SOLUSDT, price sweeps 142.00, reclaims 143.20 and closes above it. Entry is 143.30, stop 141.90, target 146.10: a $1.40 risk for a $2.80 reward, or 2R. If account risk is $100 and the contract value is $1 per dollar move, size is about 71 units. This is a hypothetical plan, not a live call.
When does total crypto market cap give false confidence?
TOTAL can mislead when its composition changes, when one large asset dominates the move, or when the line is reacting to a rapid repricing event. A higher TOTAL print does not prove the altcoin you want has healthy liquidity. It cannot show spread, funding, exchange risk or distance to the coin’s next opposing level.
The common mistake is treating a market-cap breakout as permission to buy every dip. I prefer a two-step record: screenshot when TOTAL breaks, then another when the coin gives its trigger. If the broader chart improved but the coin never reclaimed its own level, the filter helped with selection, not timing.
Can a bot use TOTAL as a crypto filter?
A bot can use TOTAL only if the data source, refresh interval, threshold and execution rule are explicit. “Buy when TOTAL rises” is incomplete. A usable rule might require TOTAL3 above a defined level, USDT.D below a threshold, a selected coin’s 15-minute reclaim, a stop beyond invalidation and a fixed risk limit.
Quantum Algo’s free public indicators mark order blocks and fair value gaps; Zeno provides confirmed Buy/Sell signals with stop-loss, take-profit and built-in risk management. QuantumBot is the $199/mo automated execution service. Plans are $19, $39 and $79 per month; cancel anytime. Keep the market filter and product roles separate. QuantumBot does not make TOTAL analysis, choose the coin or invent a stop.
| Layer | What it measures | Job in the plan |
|---|---|---|
| TOTAL | Whole crypto market value | Regime context |
| TOTAL3 | Alt-market value | Altcoin backdrop |
| BTC.D | Bitcoin share | Leadership context |
| Execution chart | Tradable coin | Entry and risk |
How should a market-cap dashboard be recorded?
Record the symbol, feed, timeframe, current level, prior range, direction and the disagreement between TOTAL, TOTAL3 and BTC.D. A screenshot without those labels becomes hard to compare later.
I also record what the dashboard changed. If it only made me feel bullish but did not improve coin selection or stop placement, it did not add evidence. A context tool earns its place by changing a decision.
What does broad expansion look like on a real chart?
On a 4-hour layout, broad expansion looks like TOTAL and TOTAL3 holding higher lows while the execution coin reclaims a level. It does not require every token to rise together. It requires enough participation that the selected trade is not fighting the market’s capital direction.
I want room between the reclaim and the next opposing high. If the market-cap stack is constructive but the coin is already at resistance, I wait. Context can support patience as easily as it supports a long search.
How should the filter work during a fast selloff?
During a fast selloff, a falling TOTAL line tells me the market is losing value, but it does not tell me when the low is in. I wait for stabilization, a sweep and a reclaim on the tradeable symbol. The first bounce is information, not an obligation.
The journal should separate the market-cap event from the entry event. That separation prevents hindsight: a later recovery in TOTAL cannot be used to pretend the initial short was obvious.
What should a crypto trader ignore?
Ignore the urge to treat TOTAL as a ticker that can be bought. It is a map of market value, and maps are useful only when the route, risk and destination are defined.
Use the market-cap stack to reduce the number of weak ideas. Then give the chart its own evidence: structure, liquidity, volume, invalidation and a target.
How can this be tested without overfitting?
Choose a fixed observation window and write the TOTAL state before looking at the trade result. Compare broad, concentrated and defensive states across a meaningful sample. Do not move the threshold after seeing which reading would have won.
The clean test asks whether the filter improves selection, average R, drawdown or rule adherence. If it improves none of those, it may still be interesting, but it is not yet part of a trading plan.
How does this fit Quantum Algo’s product?
Quantum Algo’s free public indicators help traders mark order blocks and fair value gaps on the execution chart. Zeno is the separate signal layer with Buy/Sell signals, SL/TP and built-in risk management.
QuantumBot can execute supported signals for $199/mo. None of those products turns a market-cap dashboard into a guaranteed signal, so the written role of each layer matters.
What is the one-sentence rule?
Use TOTAL to decide which crypto charts deserve attention, not to decide that a coin must be bought. Require price to earn the order.
That rule is deliberately portable across BTC, ETH, SOL and other liquid markets. The symbols change; the responsibility to define entry, stop and target does not.
What does a market-cap reclaim fail to tell you?
A reclaim on TOTAL does not tell you whether the move is liquid on the symbol you want to trade. Crypto value can expand because a large asset reprices while the altcoin you are watching remains trapped under resistance. The chart is useful precisely because it keeps those facts separate.
Before taking a trade, I check the coin’s spread, recent volume, range and nearby liquidity. A supportive market-cap backdrop with poor execution conditions is still a pass. The filter improves the shortlist; it does not waive the normal trade checklist.
How can TOTAL improve a watchlist?
Rank the watchlist into broad-support, concentrated-support and defensive buckets. In broad support I can keep more liquid altcoins under review; in concentration I may keep BTC and ETH but remove marginal alt ideas; in defense I wait for a clear reclaim rather than forcing a continuation.
This ranking is more useful than a bullish/bearish label because it changes attention. The best market-context tool often earns its value by telling me where not to spend the next hour.
What belongs in the post-trade review?
Save the pre-trade state, the entry state and the exit state for TOTAL, TOTAL3, BTC.D and USDT.D. Then record whether the coin followed the expected relationship. A failed trade can still be a good filter if the coin-specific setup was valid and the loss was within risk.
Review the filter over groups of trades rather than a single result. The goal is to discover when context improves selection, not to turn one market-cap print into a prediction engine.
How does timeframe alignment prevent a bad read?
A weekly TOTAL trend, a daily TOTAL3 range and a 15-minute SOL entry are not contradictory simply because they point in different directions. They answer different questions. The higher timeframe describes the environment; the execution timeframe describes the event that can be risked. I write the timeframe beside every observation so a short-term pullback is not mistaken for a market-cap regime change.
When the timeframes truly disagree, I reduce the number of assumptions. A daily expansion with a 15-minute failure may still produce a later long, but it does not justify chasing the first bounce. The market-cap stack gives me patience and the execution chart gives me a measurable trigger.
How should a trader use the chart in a review meeting?
Put the market-cap stack on the left of the review and the trade chart on the right. Ask three questions: did the context classify the environment correctly, did the coin-specific setup meet the rule, and did the exit respect the original target? This prevents the result from rewriting the reason for the trade.
The review should include no-trade examples. If TOTAL3 was defensive and the trader stayed out of a weak altcoin continuation, that is evidence even though there is no P&L line. Good filters are often visible in the bad trades they prevented.
TOTAL is a market-context filter. Compare TOTAL, TOTAL2, TOTAL3, BTC.D and USDT.D, then let the execution chart define the entry, stop and target. Broad expansion can improve selection, but no market-cap line guarantees a coin trade.
◆ Interactive check
Can you use TOTAL without turning it into a signal?
Questions traders ask about crypto market context
Total crypto market cap is the combined market value of the tracked cryptocurrency market. Traders use the TOTAL chart to understand broad expansion or contraction before narrowing attention to BTC, ETH or altcoins.
The TOTAL chart is used for market context and regime analysis. It can help decide whether to search for long or short setups, but it does not provide the entry, stop or target for a specific coin.
TOTAL is the broad crypto market-cap view, while TOTAL3 excludes Bitcoin and Ethereum. Comparing them helps show whether a move is broad or concentrated in the largest assets.
It is better treated as a context indicator than a guaranteed leading signal. It can show market expansion before a particular coin confirms, but the relationship changes with composition and liquidity.
Compare the direction and location of TOTAL with BTC.D. TOTAL rising while BTC.D rises can describe Bitcoin-led strength; TOTAL and TOTAL3 rising together can describe broader participation. The execution chart still decides the trade.
Rising USDT.D can reflect defensive positioning, falling volatile-asset value or changes in stablecoin supply. Compare it with TOTAL3, price structure and volume rather than treating one candle as a signal.
Yes, as a selection filter. Use TOTAL3 and the relevant execution chart to decide whether an altcoin has reclaimed structure, enough liquidity and a realistic path to target.
Quantum Algo’s free public indicators mark Smart Money Concepts structures such as order blocks and fair value gaps. Zeno provides confirmed Buy/Sell signals with SL/TP and built-in risk management; it does not turn TOTAL into a guaranteed signal.
QuantumBot can execute a fully specified signal plan where a supported connection is available. The plan must define the data source, threshold, execution symbol, trigger, stop, target and risk.
Quantum Algo publishes a timestamped ledger showing a 75% win rate across 160 posted trades, with 120 wins and 40 losses. That is evidence to verify, not a promise for a crypto market-cap setup.