MVRV Z-Score: What It Is, How to Read It, the Cycle Zones and the Limits

The MVRV Z-score measures how far Bitcoin's market cap sits above or below its realized cap — the value of each coin at the price it last moved — divided by the standard deviation of market cap. Readings above about 7 coincided with past cycle tops and readings below 0 with bottoms, but each cycle has peaked lower and the 2024–2025 cycle stayed around 2–3. Use it as multi-year context, not as a trade signal.
Few on-chain charts are shared as widely as the MVRV Z-score, with its red band that caught the tops of 2013, 2017 and 2021 and its green band at the bear-market lows. Its logic is sound — it compares today's price with what holders paid — but the cycle that followed did not behave like the chart said it would. This guide explains market and realized value, the formula, how to read the zones, why the peaks keep falling, how it compares with other cycle indicators, and includes a calculator.
Indicators that prove themselves in public.
One engine, four precision tools — the Gold (XAU) Scalper, the institutional Gravity Zone, the Zeno momentum Oscillator, and Zeno Stocks for equities.



What is the MVRV Z-score?
The MVRV Z-score is a Bitcoin on-chain indicator that measures how far Bitcoin's market value has moved above or below its realized value, scaled by how volatile market value has been. In plain terms, it asks: compared with what holders paid on average, how stretched is the price today — and is that stretch unusual by Bitcoin's own history? Readings far above zero have historically coincided with cycle tops; readings below zero with cycle bottoms.
The formula is (market cap − realized cap) ÷ standard deviation of market cap. Market cap is price times circulating supply. Realized cap values every coin at the price when it last moved on-chain. The standard deviation, in the classic version, is taken over Bitcoin's entire price history. The result is an oscillator that has ranged from below 0 at bear-market lows to around 7–10 at past manias.
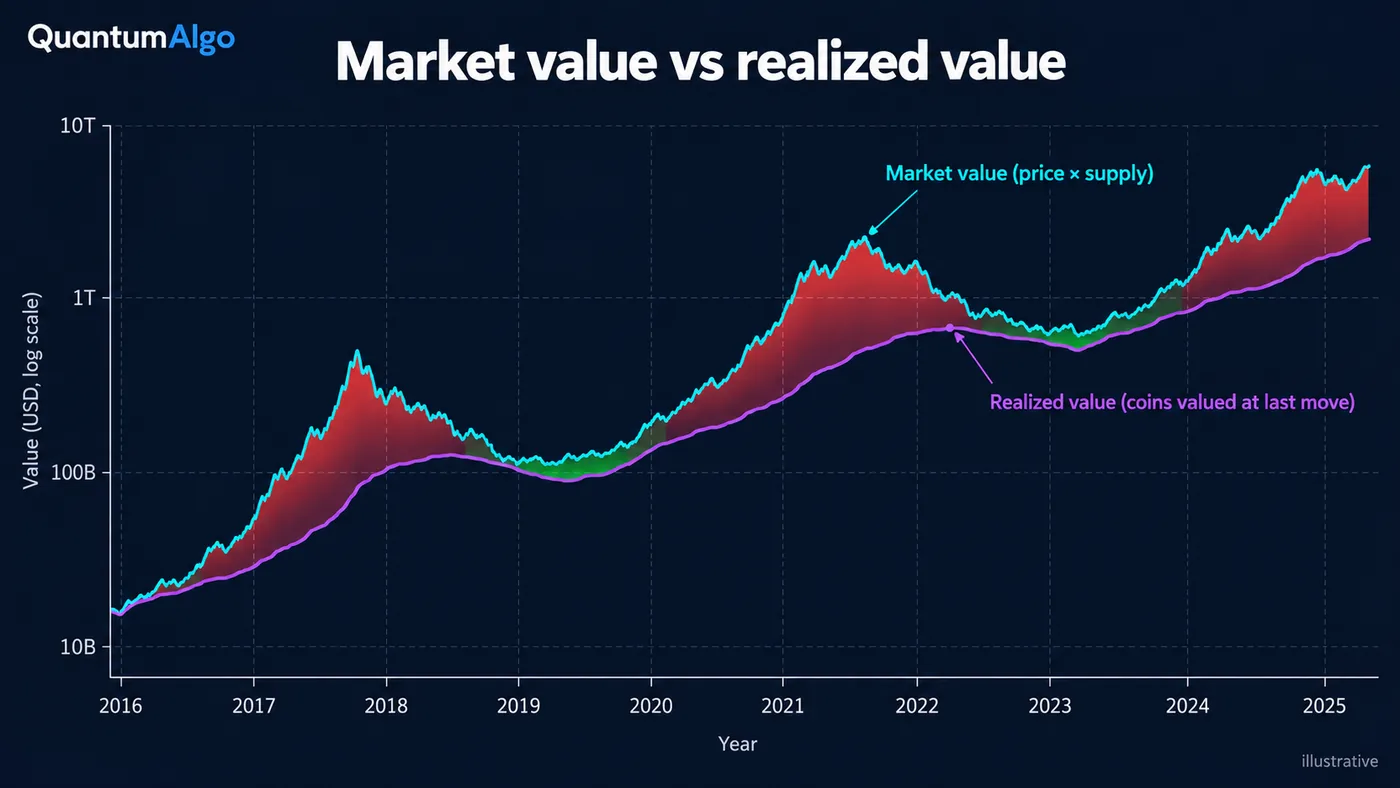
What are market value and realized value?
| Metric | Definition | What it represents |
|---|---|---|
| Market value (market cap) | Price × circulating supply | What all bitcoin are worth at today's price |
| Realized value (realized cap) | Each coin valued at the price when it last moved | Roughly the aggregate cost basis of holders |
| Realized price | Realized cap ÷ supply | The average price at which coins last moved |
| MVRV ratio | Market cap ÷ realized cap | How far above the average cost basis the market trades |
| MVRV Z-score | (Market cap − realized cap) ÷ std. dev. of market cap | How unusual that gap is by historical standards |
Realized cap is what makes the metric work. Market cap moves with every tick, but realized cap only changes when coins move: a coin bought at $20,000 and held keeps counting at $20,000 until it is spent. That makes realized cap a slow-moving estimate of what the market paid. Coin Metrics introduced it in its network data, Nic Carter popularised it in 2018 and Glassnode credits Antoine Le Calvez with coining the term in September 2018.
The MVRV ratio followed: Murad Mahmudov and David Puell published it on 1 October 2018, with readings above 3.7 marking overvaluation and below 1 undervaluation. The Z-score variant, by an analyst writing as Awe & Wonder, appeared in late 2018 and divided the market-minus-realized gap by the standard deviation of market cap, which made peaks comparable across cycles.
How do you read the MVRV Z-score?
| Z-score | Reading | Historical context |
|---|---|---|
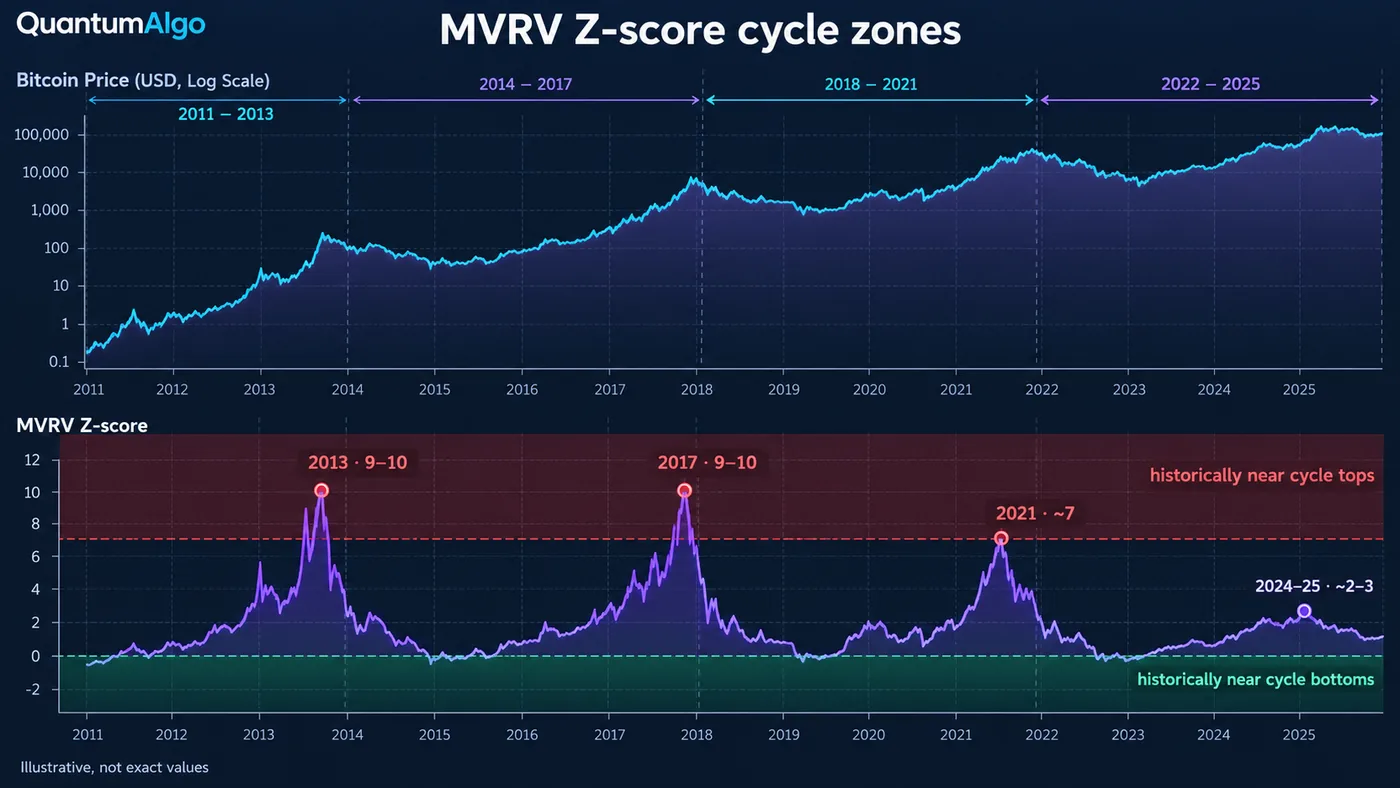
| Above ~7 | Red zone — extreme | Coincided with the 2013 and 2017 tops (about 9–10) and briefly the 2021 top (about 7) |
| 5 – 7 | Overheated | The original article's warning band |
| 2 – 5 | Mid-cycle | Holders in solid profit; most bull-market time is spent here |
| 0 – 2 | Low | Market value close to realized value |
| Below 0 | Green zone — undervalued | Coincided with the 2015, 2018 and 2022 bear-market lows |
The common chart convention shades readings above about 7 red and below 0 green. Chart sites have noted that the red zone historically picked the market high of each cycle within a couple of weeks, and the green zone the broad bottoming area. Two cautions belong next to that record. First, each cycle peaked lower: about 9–10 in 2013 and 2017, about 7 in 2021, and readings in the 2024–2025 cycle mostly stayed between about 2 and 3 — the classic red zone was never reached. Second, providers calculate the score slightly differently, so the same date shows different values on different sites.

Automate your trades. Let Quantum Algo trade for you.
Every signal executed on your own account — on your account, with the plan you define.
Why have MVRV Z-score peaks been getting lower?
Several reasons, all structural. The standard deviation in the classic formula covers Bitcoin's whole history, including the wild early years; as market cap grew, the gap needed to reach the same Z-score grew too. Diminishing returns: a larger, more liquid asset with institutional holders has made smaller multiples from its cost basis each cycle. Off-chain ownership: a growing share of bitcoin sits in ETFs and with custodians, where coins move less on-chain, which changes how realized cap reflects buying and selling. And lost coins — coins that have not moved since the early years still count in supply at a near-zero realized value.
Analysts have responded with variants. Bitcoin Magazine Pro publishes a two-year rolling version that measures the standard deviation over the last two years only, which adapts the scale to the current cycle. Glassnode and others publish MVRV for short-term holders (coins younger than 155 days) and long-term holders separately, which shows which group is in profit. None of these turns the metric into a timing tool; they make the context more current.
How do traders use the MVRV Z-score?
- Use it for the cycle, not the day. The Z-score moves slowly and works on a multi-month to multi-year view. It is context for position sizing and risk, not an entry trigger.
- Watch the extremes. Below 0 has historically been a favourable accumulation zone; the overheated bands have been areas to reduce risk.
- Account for lower peaks. Do not wait for 7 if the cycle is maturing at lower readings — compare with the rolling version and with other cycle metrics.
- Confirm with other metrics. MVRV ratio, NUPL, the Pi Cycle Top, the power law and funding rates.
- Time entries on the price chart. Structure, liquidity and confirmation on the chart decide when; the Z-score decides how aggressive to be.
How does MVRV compare with other cycle indicators?
| Indicator | What it measures | Top / bottom reading |
|---|---|---|
| MVRV Z-score | Market vs realized value, scaled by volatility | Above ~7 / below 0 (historically) |
| MVRV ratio | Market cap ÷ realized cap | Above ~3.5–3.7 / below 1 |
| NUPL | (Market cap − realized cap) ÷ market cap | High profit share / net loss |
| STH / LTH MVRV | MVRV for coins under / over 155 days old | Shows which cohort is in profit |
| Puell Multiple | Daily issuance in USD ÷ its 365-day average | Miner revenue extremes |
| Pi Cycle Top | 111-day MA crossing above 2 × 350-day MA | Top signal only |
NUPL is mathematically linked to MVRV — it equals 1 − 1/MVRV — so the two always agree; they present the same information as a ratio and as a share of profit. The Puell Multiple, by David Puell, measures miner revenue rather than holder profit, and the Pi Cycle Top, by Philip Swift, is a price-only moving-average crossover. Using metrics built on different data — holders, miners and price — is more informative than stacking several versions of MVRV.
MVRV calculator
Enter market cap, realized cap and the standard deviation of market cap from your data source (in billions of dollars, all on the same date), and optionally the circulating supply. The calculator returns the Z-score, the MVRV ratio, NUPL, the realized and market price, and which historical zone the reading falls in. The sample values are illustrative.
Reference data
| Item | Value |
|---|---|
| Z-score formula | (Market cap − realized cap) ÷ std. dev. of market cap |
| MVRV ratio | Market cap ÷ realized cap |
| NUPL | (Market cap − realized cap) ÷ market cap = 1 − 1/MVRV |
| Realized cap | Coined Sept 2018 (Glassnode credits Antoine Le Calvez); Coin Metrics data |
| MVRV ratio published | 1 October 2018, Murad Mahmudov and David Puell |
| MVRV Z-score | Late 2018, Awe & Wonder |
| Common zones | Above ~7 red; below 0 green |
| Original overheated band | Above 5 |
| Past tops (approx.) | 2013 and 2017 about 9–10; 2021 about 7 |
| 2024–2025 cycle | Mostly about 2–3; red zone not reached |
| STH / LTH split | 155 days |
| Free charts | Bitcoin Magazine Pro (LookIntoBitcoin), Glassnode Studio, BGeometrics, Bitbo, NewHedge |
Worked example: reading a mid-cycle Z-score
Suppose Bitcoin's market cap is $2.2 trillion, its realized cap $1.05 trillion and the standard deviation of market cap over its history $480 billion. The Z-score is (2,200 − 1,050) ÷ 480 = 2.40; the MVRV ratio is 2.10 and NUPL 52%. With 19.9 million coins in supply, the realized price is about $52,800 against a market price of about $110,600.
The reading: holders are, on average, sitting on more than double their cost basis, but the score is nowhere near the historical red zone. A cycle-aware investor would treat this as mid-cycle — not a reason to buy aggressively or to exit — and would watch for two things: a rising Z-score with lower peaks than the last cycle (the pattern of 2024–2025), and confirming signals from other metrics. Entries and exits would still be timed on the chart. These are the calculator's sample values.
What mistakes do traders make with the MVRV Z-score?
- Using it as a trade signal. It is a multi-year context metric; it can stay elevated or depressed for months.
- Waiting for the old peaks. Peak readings have fallen each cycle; the 2024–2025 cycle did not reach the classic red zone.
- Comparing numbers across providers. Different sites calculate slightly differently; compare a provider with its own history.
- Ignoring structural change. ETFs, custody and lost coins change what realized cap captures.
- Applying it to altcoins blindly. MVRV exists for other assets, but shorter histories and different holder behaviour make the zones unreliable.
- Treating below 0 as a guaranteed bottom. It has marked bottoming areas, which can last months and include further declines.
How does the MVRV Z-score fit with chart analysis?
On-chain cycle metrics answer "where are we in the cycle?"; charts answer "is now the moment?". The two work best together: a low Z-score says risk is historically favourable, and a structure shift with a liquidity sweep on the weekly or daily chart says buyers have stepped in. A high Z-score says take risk off the table progressively, and a break of structure on the chart says when. The best crypto indicator guide covers the chart side for crypto, and Bitcoin dominance and the Fear & Greed Index add sentiment context.
MVRV Z-score is available as community scripts on TradingView and as free charts on several on-chain sites. Alongside it, the free Quantum Algo indicators mark liquidity, structure and key levels on TradingView, and Zeno, the premium engine, prints its own buy and sell signals with an entry, a stop and two targets on Bitcoin and crypto charts. The public track record lists every call.
The MVRV Z-score compares Bitcoin's market value with what holders paid, scaled by history. Its extremes have marked cycle tops and bottoms, but peaks have fallen each cycle and providers calculate it differently. Use it as context for how much risk to take over months and years, alongside other cycle metrics, and time the actual trades on the chart.
◆ Interactive check
Can you read the MVRV Z-score?
Questions traders ask about the MVRV Z-score
A Bitcoin on-chain indicator: market cap minus realized cap, divided by the standard deviation of market cap. It shows how stretched the price is versus what holders paid, relative to Bitcoin's history.
(Market cap − realized cap) ÷ standard deviation of market cap. Market cap is price × supply; realized cap values each coin at the price it last moved; the classic version takes the standard deviation over all of Bitcoin's history.
Readings below 0 have historically coincided with bear-market lows and readings near 0 with good long-term entries. It is context for risk, not a precise buy signal; time entries on the chart.
Historically, readings above about 7 coincided with cycle tops (about 9–10 in 2013 and 2017, about 7 in 2021). Peaks have fallen each cycle, and the 2024–2025 cycle stayed around 2–3, so waiting for the old red zone can mean waiting for a signal that never comes.
The MVRV ratio is market cap ÷ realized cap, with readings above about 3.5–3.7 overheated and below 1 undervalued. The Z-score divides the market-minus-realized gap by the standard deviation of market cap, scaling it for volatility.
Providers use slightly different data and calculations, and some offer rolling versions (for example a two-year rolling standard deviation). Compare a provider's readings with its own history.
It still describes how far price sits above holders' cost basis, but structural changes — ETFs and custody, lost coins, diminishing returns — mean the classic zones have not been reached recently. Use it alongside other metrics.
The Z-score variant was introduced in late 2018 by an analyst writing as Awe & Wonder, building on the MVRV ratio by Murad Mahmudov and David Puell and on realized cap from Coin Metrics.
Yes — community scripts reproduce it using market cap and realized cap data, and several on-chain sites publish free charts.
Versions exist for other assets, but shorter histories and different holder behaviour make the Bitcoin zones unreliable for altcoins.
References & Related Guides
Read next
- Pi Cycle Top Indicator
- Bitcoin Power Law
- Best Crypto Indicator
- Bitcoin Dominance Explained
- Crypto Fear and Greed Index
- Total Crypto Market Cap
- Altcoin Season Explained
- Funding Rate Trading
- Crypto Market Breadth
- Crypto Trading for Beginners
- Free TradingView indicators
- Zeno — the premium engine
Primary sources
- Glassnode — MVRV Z-Score
- Glassnode — Realized Capitalization
- Coin Metrics — Realized cap (CapRealUSD)
- Mahmudov & Puell — Bitcoin Market-Value-to-Realized-Value (MVRV) Ratio (2018)
- Awe & Wonder — Introducing the Bitcoin MVRV Z-Score metric
- LookIntoBitcoin — MVRV Z-Score chart
- Bitcoin Magazine — How the updated MVRV Z-Score improves predictions (2025)