What Is Stablecoin Dominance and How Do You Trade It?
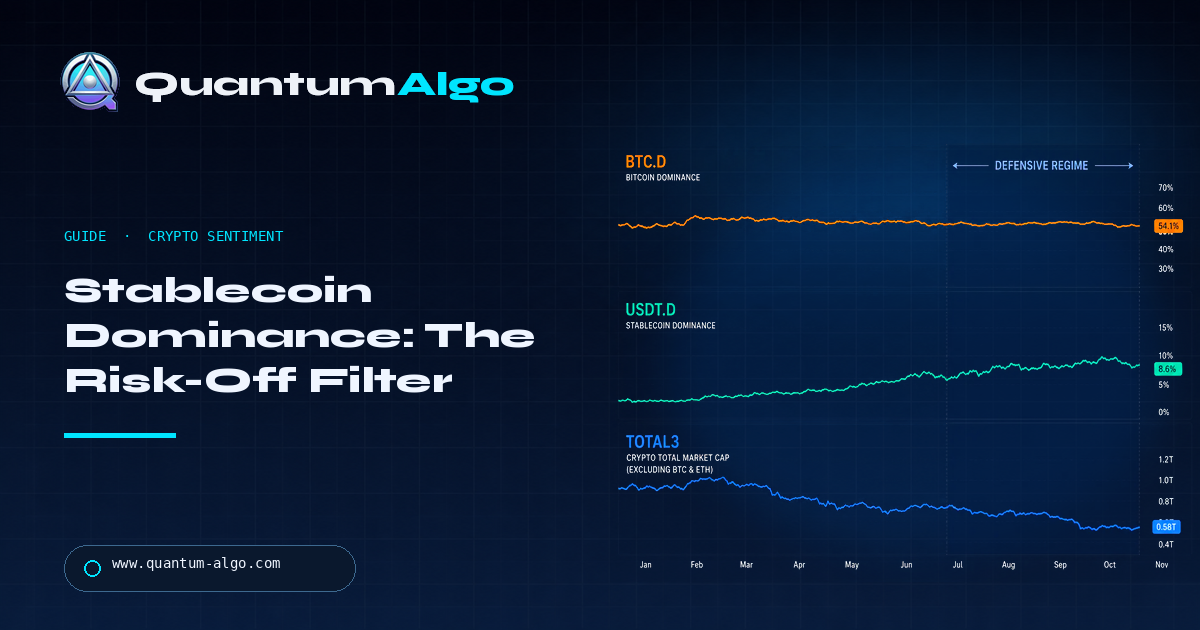
Stablecoin dominance measures the share of crypto market value held in stablecoins, commonly tracked through USDT.D. Rising dominance often reflects capital moving toward a defensive dollar-like holding; falling dominance can support risk-on rotation, but only when TOTAL3 and price structure confirm it.
BTC dominance gets most of the attention, but stablecoin dominance answers a different question: is crypto capital sitting in a stable parking place or moving into volatile assets? I use USDT.D as a regime filter for altcoins, never as a standalone entry. A rising line can warn that alt exposure is losing sponsorship; a falling line can improve the backdrop without telling me which coin to buy.
Indicators that prove themselves in public.
One engine, four precision tools — the Gold (XAU) Scalper, the institutional Gravity Zone, the Zeno momentum Oscillator, and Zeno Stocks for equities.
Use the guide as a decision filter, not as a collection of labels. The market, the session and the invalidation still decide whether an idea deserves risk.
What is stablecoin dominance in crypto?
Stablecoin dominance is the percentage of the total crypto market capitalization represented by stablecoins. USDT.D is the chart traders most often reference, but the exact calculation and market-cap universe depend on the data provider. It is a relative measure, so it can rise because stablecoins grow, because volatile assets fall, or both.
That distinction matters. If USDT.D climbs while stablecoin supply is flat and altcoins are falling, the message is different from a climb caused by new stablecoin issuance during a broad market expansion.
| Item | Value / rule | Why it matters |
|---|---|---|
| Formula | USDT.D = USDT market cap ÷ total crypto market cap (× 100) | A percentage, so it can rise while the USDT supply is flat if alts fall |
| Symbols | CRYPTOCAP:USDT.D · CRYPTOCAP:USDC.D · CRYPTOCAP:TOTAL · CRYPTOCAP:BTC.D | All available on TradingView without a paid data feed |
| Rising dominance | Capital parking in dollars → risk-off bias for alts | Confirms weakness when TOTAL3 is also falling |
| Falling dominance | Stablecoins deploying into BTC/alts → risk-on bias | Strongest when BTC.D falls at the same time (alt rotation) |
| Inverse read | USDT.D often mirrors TOTAL; divergence between them is the signal | Use structure on USDT.D like any chart: sweeps, BOS, FVG |
| Caveats | Stablecoin mints/burns and depegs distort the ratio; compare with USDC.D | A supply event is not a sentiment change |
Why can USDT.D act as a risk-off indicator?
Stablecoins are designed to hold a relatively stable value against fiat currency, so traders often use them as a temporary parking place inside crypto markets. When USDT.D rises sharply, it can signal that the denominator—volatile crypto market value—is weakening relative to stablecoin value. I read that as defensive pressure, not as proof that every coin must fall.
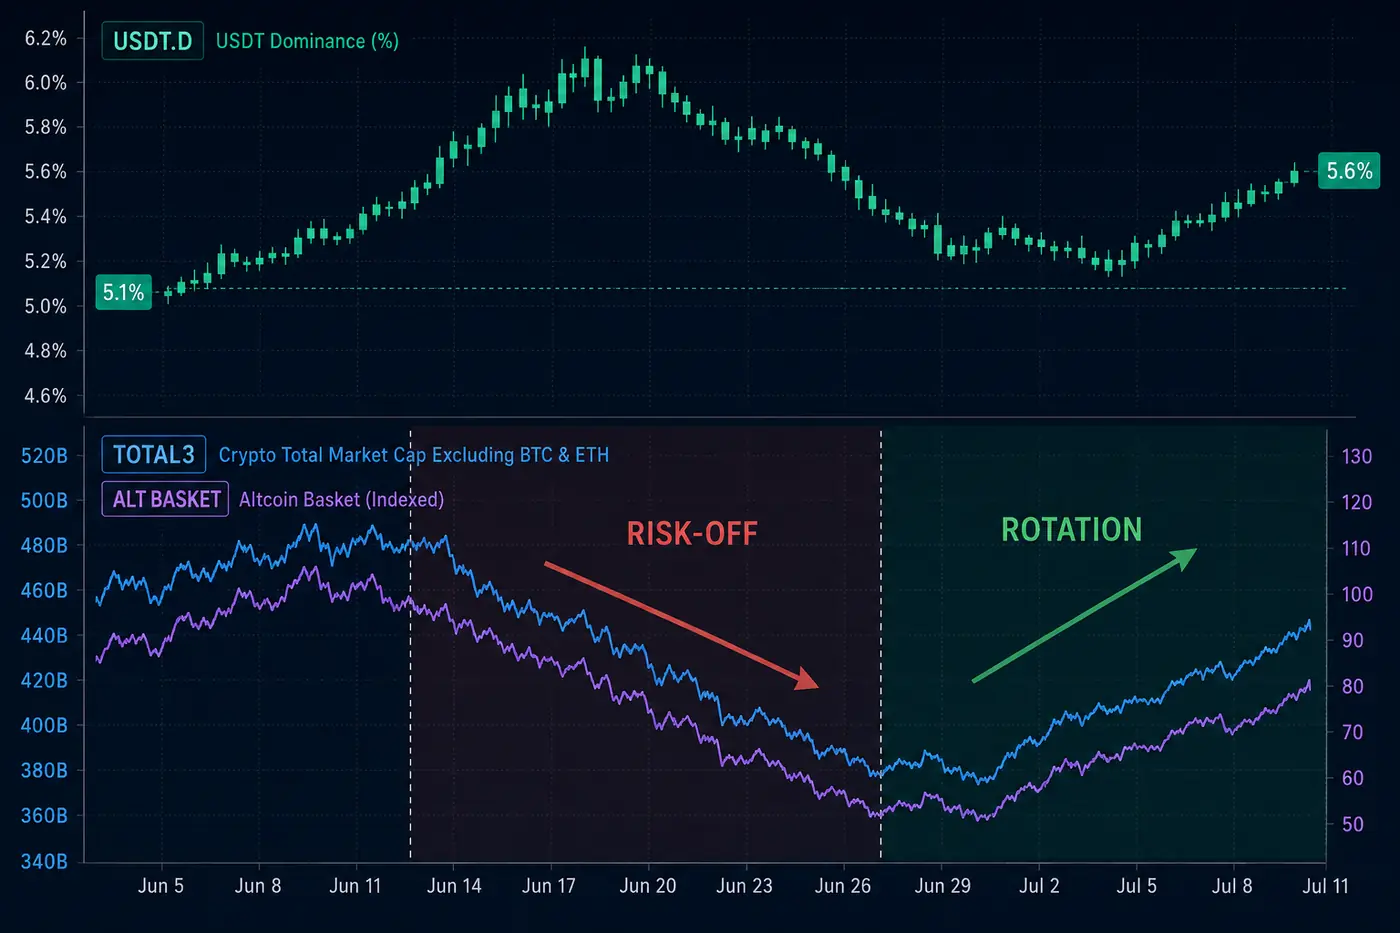
Context beats folklore. A one-day spike may be a hedge; a multi-session rise through a prior high deserves more respect. The chart needs price confirmation.
How is stablecoin dominance different from BTC dominance?
BTC dominance compares Bitcoin’s market capitalization with the rest of the crypto market. Stablecoin dominance compares stablecoins with the total crypto market. BTC.D can rise because capital rotates from altcoins into Bitcoin, while USDT.D can rise because capital leaves volatile assets altogether.
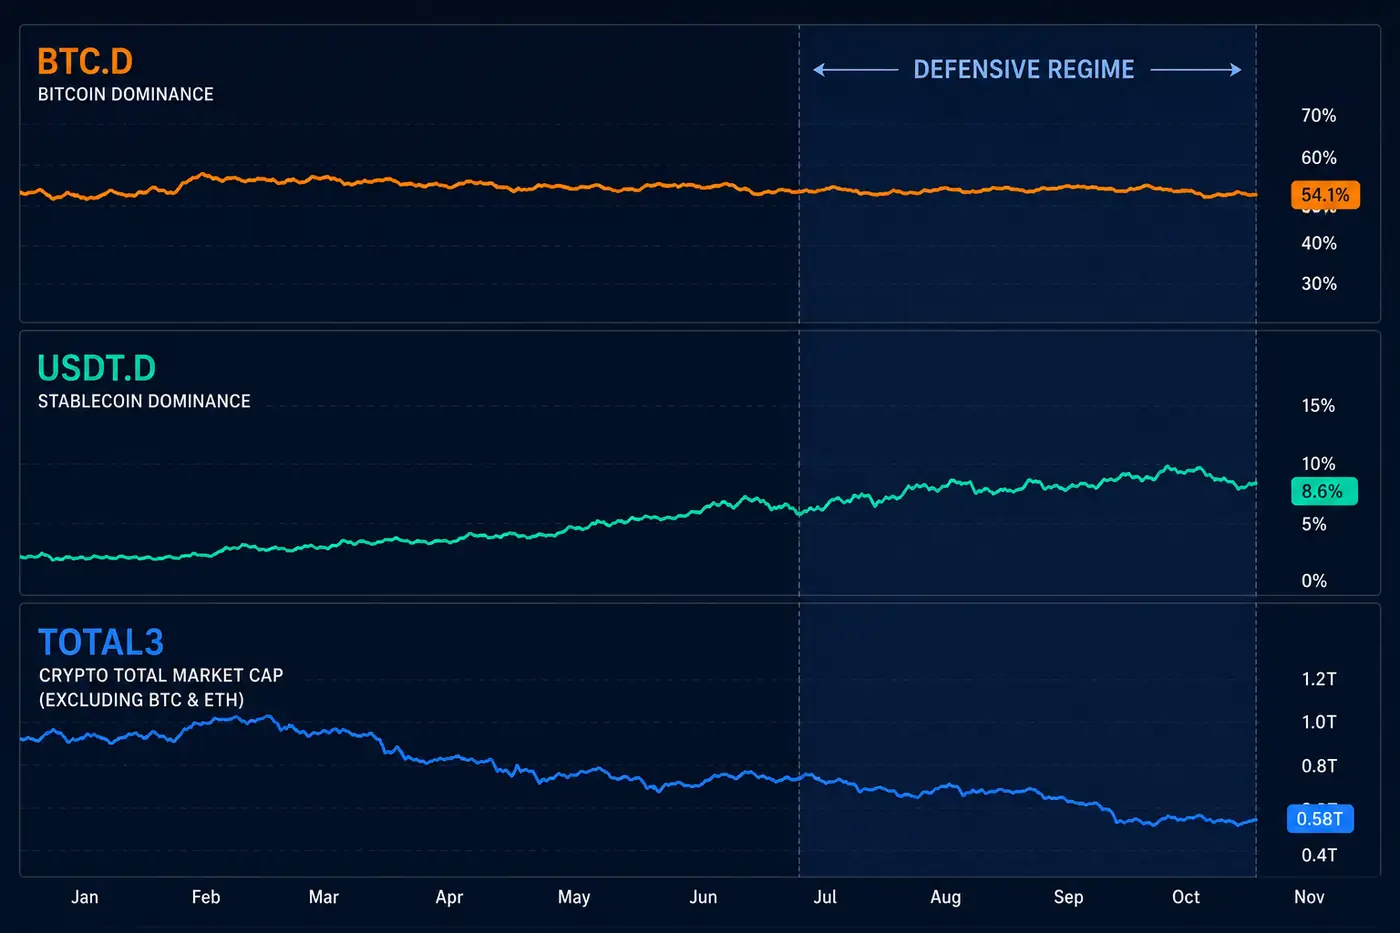
That creates useful combinations. BTC.D rising with USDT.D falling can describe Bitcoin leadership inside a risk-on market. BTC.D flat with USDT.D rising and TOTAL3 falling is a more defensive picture.

Automate your trades. Let Quantum Algo trade for you.
Every signal executed on your own account — on your account, with the plan you define.
What does rising USDT.D say about altcoins?
Rising USDT.D usually makes the altcoin backdrop harder, especially when TOTAL3 is below a broken range and the alt basket cannot reclaim VWAP. It does not mean every altcoin short is good. A coin can outperform while the broader market is defensive if its own structure is strong.
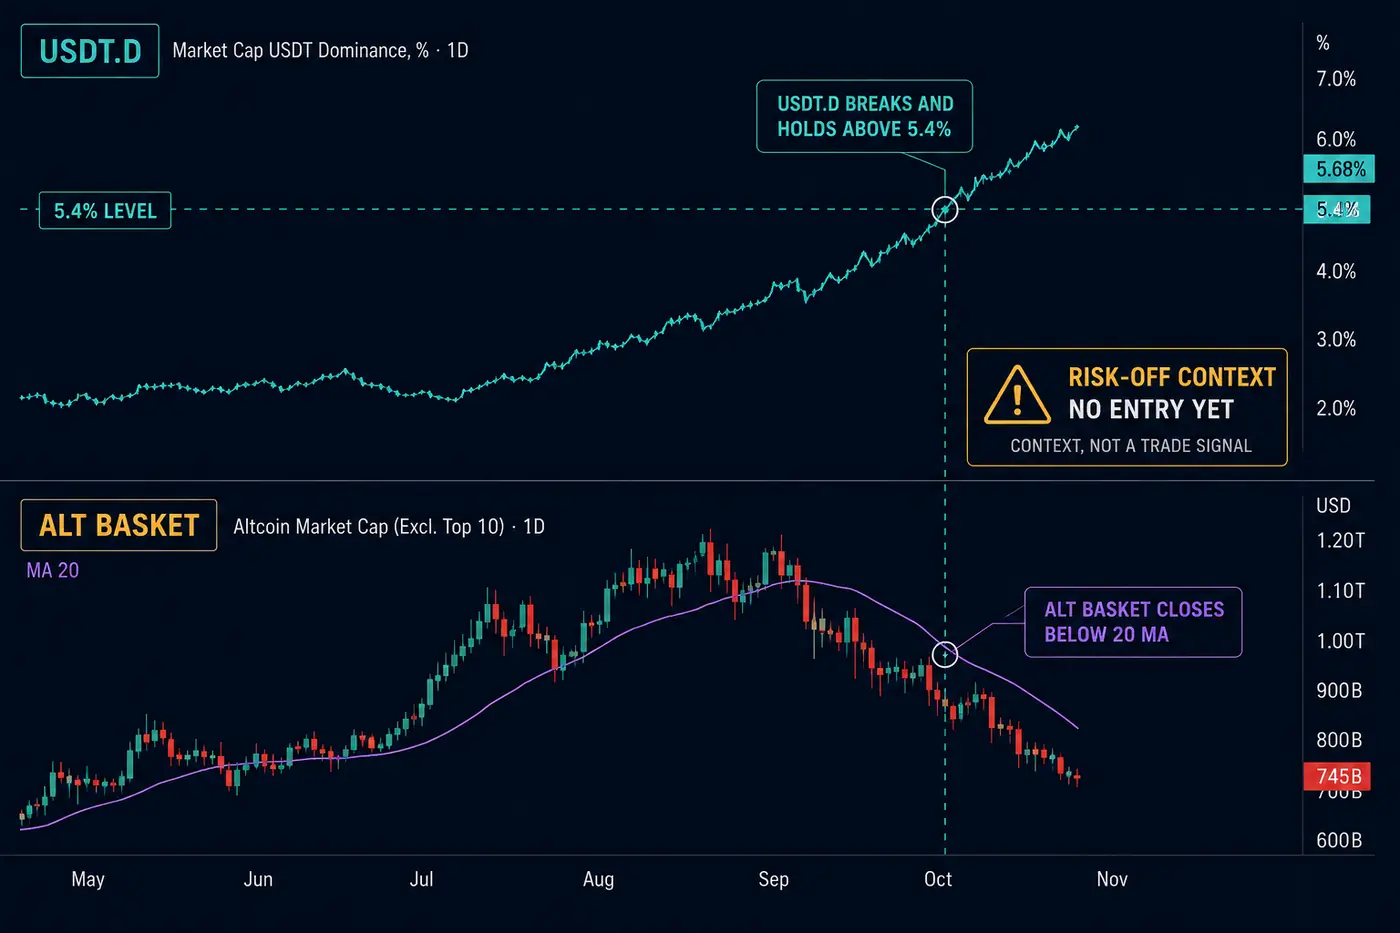
I use the filter to reduce low-quality longs, not to manufacture a position. If the price setup is excellent and the filter disagrees, I either wait or reduce exposure according to the plan.
When does falling USDT.D confirm risk-on rotation?
Falling USDT.D is more useful when it happens alongside improving TOTAL3, rising breadth across the alt basket and reclaimed price levels. The sequence I want is dominance weakness, market-cap expansion and a coin-specific structure break or reclaim. One green candle on USDT.D is not enough.
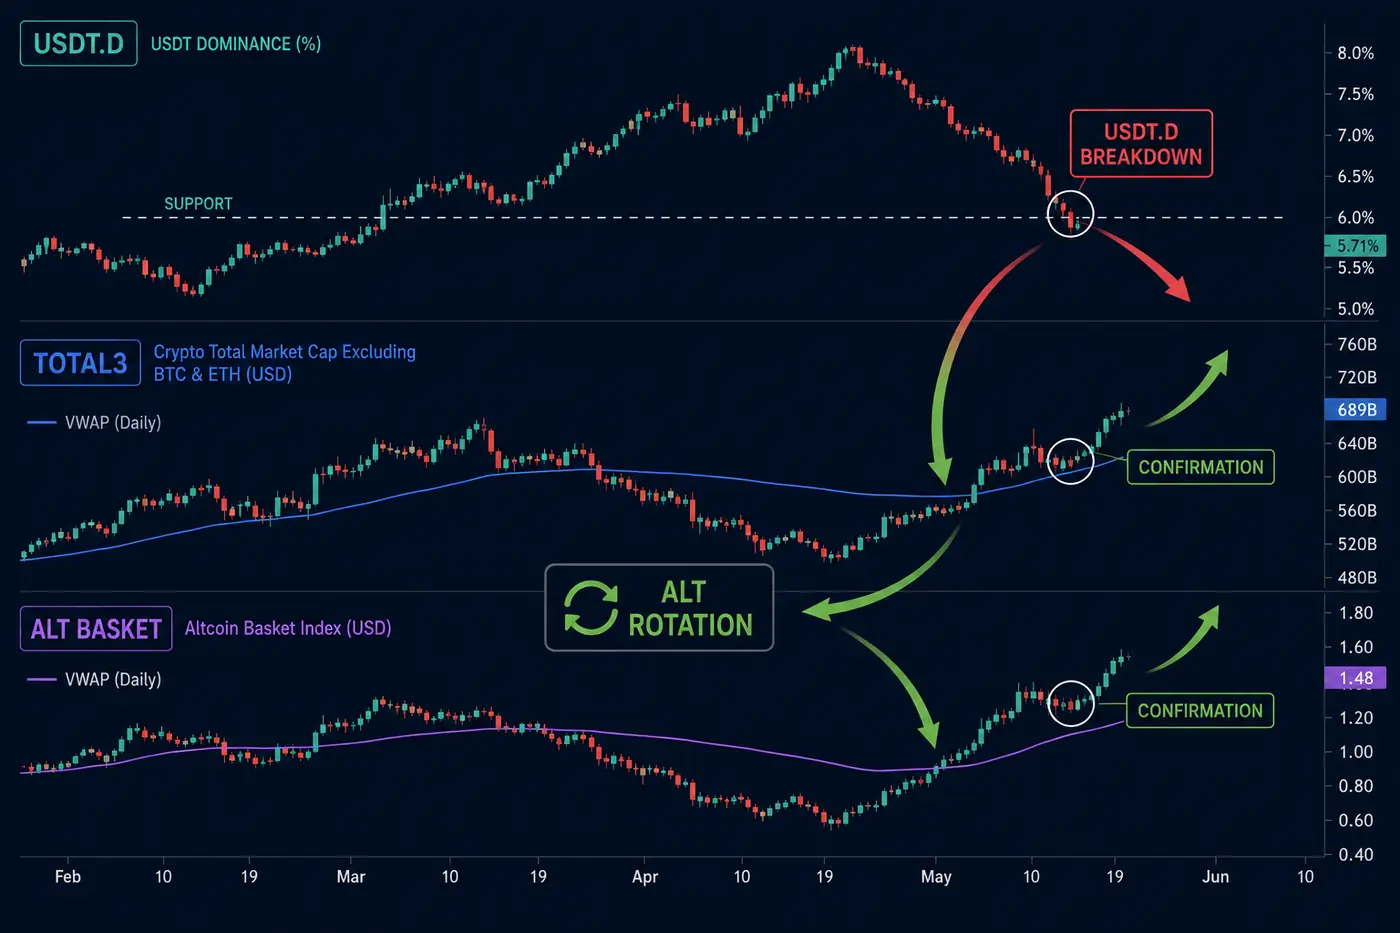
Rotation can also be temporary. Mark the level USDT.D broke and watch whether it accepts below it. A quick wick followed by a reclaim turns the apparent rotation into a failed signal.
How do you combine USDT.D with TOTAL3 and price structure?
Use each chart for one job. USDT.D describes defensive demand. TOTAL3 describes the market value of crypto excluding BTC and ETH. BTC.D describes leadership. Your execution chart—BTC, ETH or an altcoin—provides the entry, stop and target.
The free public Quantum Algo indicators mark SMC structures such as order blocks and FVGs on the execution chart. They do not draw stablecoin-dominance signals. Zeno provides confirmed Buy/Sell signals with SL/TP and built-in risk management; it is not a USDT.D overlay.
Can stablecoin dominance give a false signal?
Yes. Stablecoin market caps change, data feeds differ and a defensive move can be brief. A rising USDT.D line may also reflect new stablecoin issuance rather than a rush out of risk assets. Compare the line with TOTAL3, volume and the actual structure of the coin you plan to trade.
If the filters disagree, disagreement is the information. Wait for the chart you trade to resolve the conflict instead of letting one ratio dictate the whole position.
How do you build a stablecoin dominance trading plan?
Mark the weekly and daily USDT.D levels, then identify whether the line is expanding, ranging or breaking. Check TOTAL3 for confirmation. Finally, move to the execution chart and require a structure event, such as a sweep and reclaim, displacement or break-and-retest.
This is a context stack, not a signal promise. For related crypto context, compare Bitcoin dominance, altcoin season and crypto SMC trading.
Can a bot use stablecoin dominance as a filter?
A bot can use the filter if the data source, update interval, threshold and execution rule are specified. It should not buy an altcoin because USDT.D dropped for one candle. The signal needs the execution symbol, structure trigger, stop, target and risk limit.
Quantum Algo’s free public indicators mark order blocks and fair value gaps; Zeno provides confirmed Buy/Sell signals with stop-loss, take-profit and built-in risk management. QuantumBot is the $199/mo automated execution service. Plans are $19, $39 and $79 per month; cancel anytime.
| Tool | What it measures | Its job in the plan |
|---|---|---|
| USDT.D | Stablecoin share of crypto value | Defensive capital-location filter |
| BTC.D | Bitcoin share of crypto value | Leadership and rotation context |
| TOTAL3 | Alt-market capitalization | Breadth of non-BTC/ETH value |
| Execution chart | Price, liquidity and invalidation | Actual entry and risk decision |
Why can stablecoin dominance rise for different reasons?
USDT.D is a ratio, not a direct sentiment meter. It can rise because stablecoin capitalization grows, because the value of volatile crypto assets falls, or because both happen at once. A trader who calls every rising line “money leaving crypto” is making a stronger claim than the chart proves. I use the line as a capital-location clue and then compare it with TOTAL, TOTAL2, TOTAL3, BTC.D and the execution asset.
On a daily chart, a rising USDT.D line alongside falling TOTAL3 and weak altcoin breadth is a coherent defensive regime. On a short intraday chart, a one-candle rise can be a temporary hedge or a data adjustment. The timeframe changes the meaning of the move. I mark weekly and daily levels for the backdrop, then use the actual coin’s 1-hour or 15-minute structure for the trade.
Stablecoin supply also matters. A new issuance event can lift the denominator or numerator without representing an immediate rotation into a specific altcoin. That is why the line should not be read alone. Compare the slope, the level, the market-cap response and the price structure. If they disagree, reduce certainty instead of choosing the panel that supports the position already in mind.
How do you read USDT.D, BTC.D and TOTAL3 together?
Give each chart one job. USDT.D describes defensive stablecoin share. BTC.D describes Bitcoin’s share relative to the broader crypto market. TOTAL3 describes the capitalization of crypto excluding Bitcoin and Ether. A falling BTC.D with rising TOTAL3 can support a rotation into alts, but if USDT.D is also rising, the move may be selective or fragile. A falling USDT.D with weak TOTAL3 can mean the ratio changed without broad altcoin demand.
I use a four-quadrant note: risk-on expansion, Bitcoin leadership, defensive parking or mixed. The label is provisional until the execution chart agrees. For example, falling USDT.D and rising TOTAL3 is a useful backdrop for looking for long setups, but the chosen altcoin still needs a sweep, reclaim or displacement. The dashboard filters the search; it does not choose the coin or the entry.
When the market is mixed, the best trade can be no trade. Waiting for USDT.D to accept below a broken level while TOTAL3 holds a reclaim may reduce the number of impulsive altcoin entries. If the dominance line wicks through a level and immediately reclaims it, I treat the apparent rotation as failed until price proves otherwise.
How should crypto traders test dominance filters?
Define the filter in advance. Write down the timeframe, the dominance symbol, the change threshold, the confirmation market and the execution trigger. A rule such as “USDT.D down is bullish” cannot be tested. A rule such as “after a daily close below last week’s USDT.D low, only take 1-hour altcoin reclaims while TOTAL3 remains above its prior-day high” can be logged and challenged.
Keep separate samples for BTC, large-cap alts and thin-liquidity tokens. A market-wide ratio may be useful for the first two and irrelevant for the third. Include funding, spread and slippage in the result. Crypto trades do not happen at the chart’s ideal price simply because the dashboard looks aligned. The cleaner the definition, the easier it is to connect a filter to a manual plan or a properly specified automation rule.
How should you handle a USDT.D signal that arrives before price?
Early context is useful only if it creates patience. If USDT.D breaks a daily level but the altcoin you want to buy is still below a broken 1-hour structure, wait. The dominance chart can tell you to monitor a setup; it cannot override the execution chart. I mark the time of the dominance break, then wait for the coin, TOTAL3 and liquidity conditions to line up.
The reverse problem is late confirmation. If an altcoin has already made a two-R move while USDT.D finally confirms a rotation, the dashboard is describing the move rather than offering a fresh entry. Look for a new structure event or a retest. Do not use a macro ratio to justify buying into an extended candle.
Token selection also matters. Market-wide dominance can align with BTC and large caps while a thin altcoin remains driven by its own token release, listing or liquidity event. For smaller tokens, add a local volume and spread check. A correct market regime does not remove execution risk, and a dashboard with three green panels cannot guarantee that an individual market will follow it.
For automation, translate the filter into explicit states: dominance above or below a named level, TOTAL3 trend, execution symbol, structure trigger, stop distance and maximum risk. QuantumBot can execute a defined plan where a supported connection is available, but it cannot infer which altcoin the dashboard “feels” favours. Precision in the rule is what makes later verification possible.
What should a crypto dominance dashboard show before entry?
Before entry, the dashboard should show the USDT.D level, its current state, the TOTAL3 response, BTC.D leadership and the actual execution chart. I keep the dashboard small because a dozen correlated panels can create the illusion of certainty. The goal is to see whether capital is expanding, concentrating or moving defensively, then make the decision on the chart that can be traded.
For a BTC-to-alt rotation, I want the alt basket to do more than print one green candle. It should reclaim a meaningful level, hold that reclaim and show enough liquidity for the planned stop and target. If USDT.D falls but the altcoin remains below a broken daily low, the macro backdrop is early context, not a buy order.
Take the dashboard screenshot at entry and at exit. This makes it possible to learn whether dominance helped with selection, timing or simply confidence. Those are different jobs, and only the first two are useful to a repeatable process.
What is the dominance rule I would actually trade?
I would use USDT.D to narrow the search, not to choose the entry. A falling dominance line must be supported by TOTAL3 or the relevant market-cap basket, then the coin itself must reclaim structure with a defined stop and target. Rising dominance can reduce long exposure without becoming an automatic short.
This keeps a ratio in its proper role. It describes capital location; it does not know the spread, liquidity or invalidation on the token you are about to trade. That separation is what makes the dashboard useful for both manual review and explicit automation.
What should the dominance checklist leave out?
It should leave out the claim that one USDT.D candle predicts altcoins, the assumption that BTC.D and USDT.D are interchangeable and the idea that a dashboard can choose a token. Ratios provide context; market structure and risk still decide the trade.
On a volatile crypto session, patience is part of the filter. Wait for the execution market to agree rather than letting a macro chart create urgency.
How does session context change a dominance filter?
USDT.D is a higher-timeframe ratio, but the coin you execute can change character during the US and Asia sessions. Mark when the dominance level breaks, then check whether liquidity and volume on the chosen coin are actually available. A market-wide risk-on backdrop is weaker if the token has no clean book or reliable spread.
For a manual plan, the session tag tells you when to expect a retest. For automation, it becomes a rule input: only execute when the data feed is fresh and the selected market meets the liquidity condition. That is more useful than pretending the ratio is a standalone signal.
How should a dominance-filtered target be chosen?
Choose the target from the execution chart’s liquidity, not from the dominance line. USDT.D can support a rotation while the coin meets resistance one step above entry. If the path offers less than the planned multiple, wait for a better structure or skip the trade. Macro context never replaces a realistic exit. The ratio helps rank the setup, not price the exit.
USDT.D is a capital-location filter. Rising dominance can warn of defensive pressure; falling dominance can support rotation. Confirm it with TOTAL3 and the execution chart, and never confuse stablecoin dominance with BTC dominance.
◆ Interactive check
Can you use USDT.D without trading the ratio blindly?
Questions traders ask about crypto / market context
Stablecoin dominance is the percentage of total crypto market capitalization represented by stablecoins. Traders often watch USDT.D as a relative measure of capital held in a stable parking place rather than in volatile crypto assets.
No. BTC dominance measures Bitcoin’s share of the crypto market; stablecoin dominance measures stablecoins’ share. BTC.D can rise during a rotation into Bitcoin, while USDT.D can rise during broader defensive positioning.
Rising USDT.D can indicate defensive demand, falling volatile-asset market capitalization or changes in stablecoin supply. Compare it with TOTAL3, price structure and volume before acting.
Falling USDT.D can improve the backdrop for altcoins when TOTAL3 rises and the execution chart confirms a reclaim or breakout. It does not identify which altcoin to buy or guarantee continuation.
It is better described as a context filter than a guaranteed leading indicator. It can move before altcoin price confirms a regime, but the relationship changes with market conditions and data construction.
Mark higher-timeframe USDT.D levels, identify whether dominance is expanding or breaking, compare it with TOTAL3 and BTC.D, then wait for structure on the asset you actually trade. The ratio itself is not your entire trade plan.
Yes. Use USDT.D for market context and SMC tools for the execution chart’s location and displacement. Quantum Algo’s free public indicators mark order blocks and FVGs; Zeno provides signals with SL/TP and risk management.
The free public indicators focus on SMC structures on TradingView charts. Zeno is the signal layer and does not draw stablecoin-dominance labels or turn USDT.D into a guaranteed entry.
Yes. Data providers differ, stablecoin supply can change and defensive moves can be brief. A reliable process compares USDT.D with TOTAL3, BTC.D, volume and the actual execution chart.
QuantumBot can automate a defined signal plan where a supported connection is available. The plan must specify the data source, threshold, execution trigger, stop, target and risk.
Quantum Algo publishes a timestamped ledger showing 75% across 160 posted trades, with 120 wins and 40 losses. That record is available to verify and is not a promise for crypto rotation or any account.
References & Related Guides
Read next
Authoritative sources
- CoinMarketCap: stablecoin market-cap overview
- DefiLlama: stablecoin market overview
- Tether: transparency information