Pi Cycle Top Indicator: How It Works, Its Track Record and Why It Missed the Latest Top
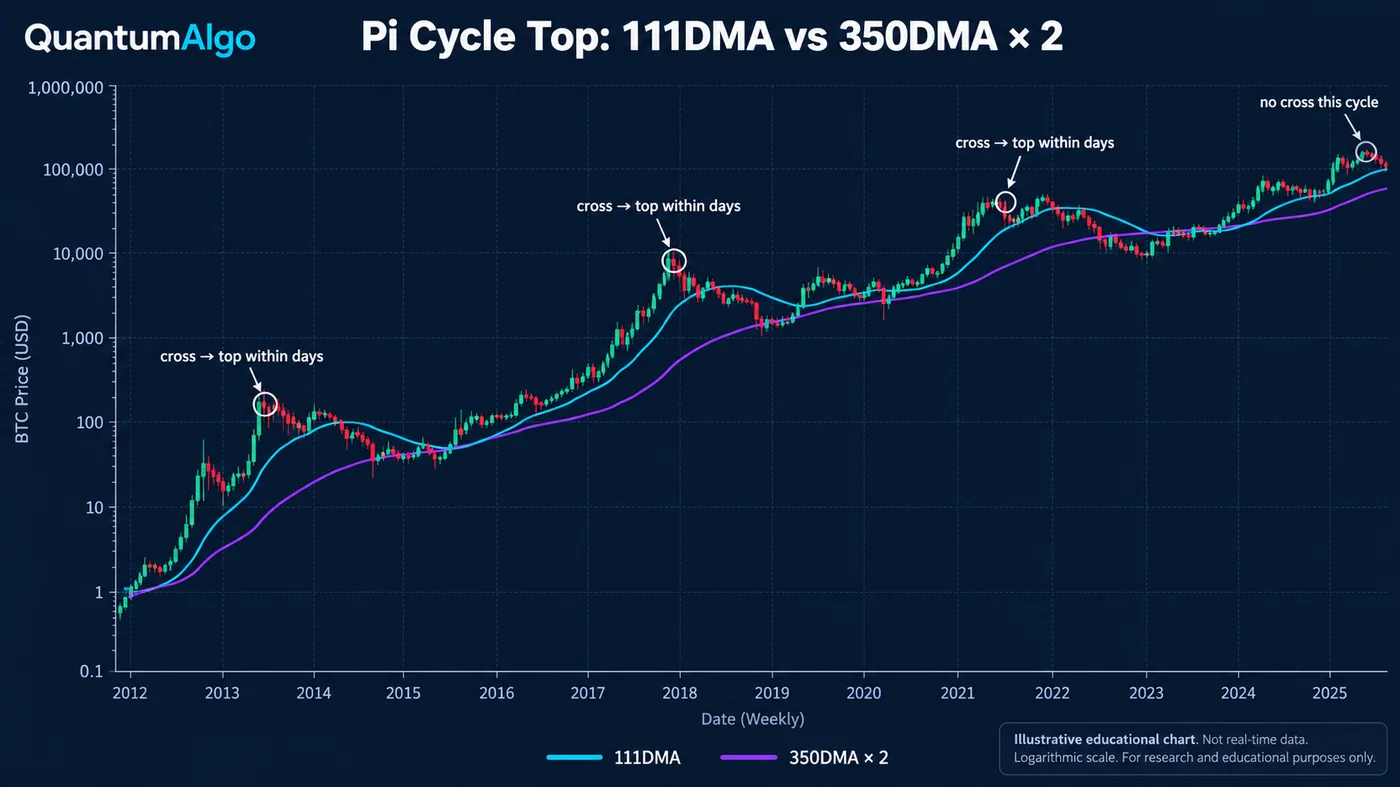
The Pi Cycle Top indicator flags a bitcoin cycle top when the 111-day moving average crosses above twice the 350-day moving average. Created by Philip Swift in 2019, it signalled within days of the 2013, 2017 and April 2021 peaks, but never crossed at the October 2025 top. Treat it as one stretch gauge, not a sell signal.
Few indicators have a record as clean as the Pi Cycle Top: two moving averages that met within days of three bitcoin cycle peaks. Few have failed as publicly: in the cycle that topped in October 2025, the lines never met. Both facts are useful. The first shows what the indicator measures — a parabolic final leg — and the second shows what it cannot see. This guide covers what the Pi Cycle Top is, how it is calculated and why it is called "pi", the track record cycle by cycle, why it missed 2025, how to read the distance to the cross, how traders use it now, a worked look at the 2021 signal, the mistakes, and a calculator for the current gap.
Indicators that prove themselves in public.
One engine, four precision tools — the Gold (XAU) Scalper, the institutional Gravity Zone, the Zeno momentum Oscillator, and Zeno Stocks for equities.



What is the Pi Cycle Top indicator?
The Pi Cycle Top indicator is a bitcoin cycle signal built from two moving averages: the 111-day simple moving average and twice the 350-day simple moving average. When the faster 111-day line rises to meet the doubled 350-day line, the indicator flags a likely cycle top. It was created by Philip Swift, founder of Look Into Bitcoin — which ran for two years as Bitcoin Magazine Pro before becoming independent again in 2026 — and published in April 2019.
Its fame comes from timing. In the 2013, 2017 and 2021 bull markets the two lines crossed within days of major peaks — twice in 2013 — which is an extraordinary record for something as simple as two averages. Its notoriety comes from what happened next: in the cycle that topped in October 2025 the lines never crossed at all. Both facts belong in any honest description, and together they decide how the indicator should be used — as one gauge of how stretched a bull market is, not as a sell button.
It sits alongside the other long-horizon bitcoin gauges on the site: the power law for where price sits in its long-run corridor, the fear and greed index for sentiment, and bitcoin dominance for where the money is rotating.
How is the Pi Cycle Top calculated?
| Line | Calculation | Role |
|---|---|---|
| Fast line | 111-day simple moving average of the daily close | Tracks the speed of the current advance |
| Slow line | 350-day simple moving average × 2 | A doubled long-term trend; the "too far, too fast" boundary |
| Signal | 111-day SMA crosses above 2 × 350-day SMA | Historically within days of a cycle top |
| Ratio form | 111-day SMA ÷ (2 × 350-day SMA) | A cross is a ratio of 1.0 |
The name is a coincidence that stuck. 350 divided by 111 is about 3.153, close to π (3.14159), and Swift noted it when he published the indicator. There is no deeper mathematics in it: the two lengths were chosen because they fitted the previous tops, not because of the circle constant.
What the cross actually measures is acceleration. The 111-day average is roughly the last four months; the 350-day is roughly the last year. For the four-month average to reach double the one-year average, price has to have risen very far, very fast — the parabolic final leg that past bitcoin cycles ended with. When a bull market tops out in a slower, broader way, the cross never comes.
How accurate has the Pi Cycle Top been?
| Cycle | Signal | What followed |
|---|---|---|
| 2013 (spring) | Early April 2013 | The April 2013 spike top within days |
| 2013 (winter) | Early December 2013 | The cycle top within days, followed by a decline of about 85% into January 2015, roughly 13 months later |
| 2017 | Mid-December 2017 | The cycle top near $19,800 within days; a decline of about 84% over the following year |
| 2021 | April 12, 2021 | A peak near $64,900 two days later and a drop of about 53% within ten weeks — but a higher high came in November without a signal |
| 2025 | None | The cycle topped in October 2025 near $126,000 with the lines far apart |
Read with the dates in front of you, the record is four signals at the tops of three cycles — and an asterisk. The 2021 signal marked the first peak of a double-topped cycle, not its final high: bitcoin fell by half, recovered and made a new all-time high in November 2021 with no second cross. Then in the cycle that peaked in 2025 the indicator did not fire at all. A tool that worked by fitting the shape of three parabolic tops stopped working when the shape changed.

Automate your trades. Let Quantum Algo trade for you.
Every signal executed on your own account — on your account, with the plan you define.
Why did the Pi Cycle Top miss the 2025 top?
The likeliest explanation is that bitcoin's cycles have become less explosive. Each cycle's peak has been a smaller multiple of the previous one, volatility has fallen, and a growing share of demand now comes through spot ETFs and corporate treasuries that buy steadily rather than in a final frenzy. A slower, broader advance never pushes the four-month average to double the one-year average, so the condition that defined a "top" simply stopped being met.
Some analysts argue the signal is late rather than broken, with the lines still capable of converging if a stronger leg arrives; others treat 2025 as proof that the parameters were fitted to a market that no longer exists. Either way the practical conclusion is the same. The ratio is still a useful measure of how stretched the advance is — a reading near 1.0 would still mean a market moving dangerously fast — but the absence of a cross is not evidence that a top is far away.
How do you read the distance to the cross?
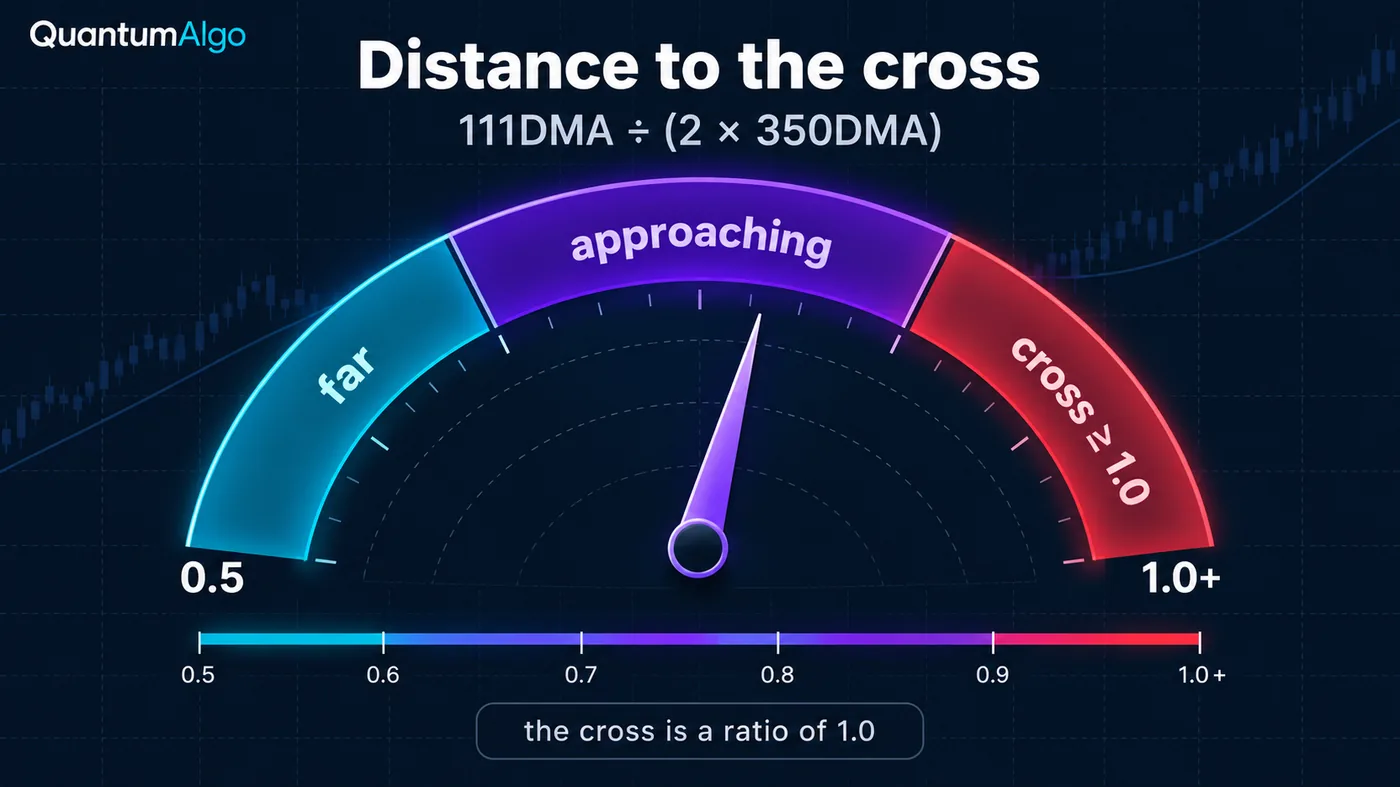
Watching two lines on a log chart hides how far apart they are. The ratio form makes it explicit: divide the 111-day average by twice the 350-day average. A ratio of 1.0 is the cross; 0.9 means the fast average is within 10% of the threshold; a falling ratio means the advance is slowing even if price is still rising.
- Read the two averages on a daily BTCUSD chart. Add a 111-period and a 350-period simple moving average; double the second in your head or with a script.
- Compute the ratio. Fast ÷ (2 × slow). Under 0.75 is far; 0.75–0.9 is a running trend; above 0.9 is approaching.
- Watch the direction. A rising ratio means the advance is accelerating; a falling ratio during new highs means momentum is fading.
- Cross-check other gauges. Power-law position, MVRV, funding rates and sentiment. One stretched gauge is a warning; several are a regime.
- Act on structure, not the gauge. Reduce or hedge into a stretched reading; exit on a weekly break of structure.
How do traders use the Pi Cycle Top today?
Used well, the Pi Cycle is a risk dial. Long-term holders scale out of a portion of a position as the ratio approaches 1.0 rather than waiting for a cross that may not come; active traders treat a high reading as a reason to tighten stops and stop adding, not as a short signal. It works best combined with the gauges that measure different things: the power law corridor for valuation against the long-run trend, the funding rate for leverage in the derivatives market, total crypto market cap and altcoin season readings for speculative excess, and the halving cycle for timing context.
There is also a mirror version for bottoms, the Pi Cycle Bottom indicator, which compares a 471-day simple moving average multiplied by 0.745 with a 150-day exponential moving average and signals when the two meet. It has a shorter and looser record and is best read the same way: as one input to a cycle view, never as the trade.
Pi Cycle distance calculator
Enter the current 111-day and 350-day simple moving averages from a daily BTCUSD chart, and optionally how much each has changed per day recently. The calculator returns the ratio, the dollar gap to a cross, the zone, and — if the slopes are given — whether the lines are converging and roughly how long a cross would take at the current pace. The defaults are illustrative values.
Reference data
| Item | Value |
|---|---|
| Created by | Philip Swift (Look Into Bitcoin, formerly Bitcoin Magazine Pro), April 2019 |
| Market | Bitcoin (BTCUSD), daily closes |
| Signal | 111-day SMA ≥ 2 × 350-day SMA |
| Ratio | 111-day SMA ÷ (2 × 350-day SMA); 1.0 = cross |
| Name | 350 ÷ 111 ≈ 3.153, close to π — a coincidence |
| Historical signals | April 2013, December 2013, December 2017, April 12, 2021 |
| 2021 note | Marked the April peak; the November 2021 all-time high came without a signal |
| 2025 cycle | No cross; the cycle topped in October 2025 near $126,000 |
| Bottom version | Pi Cycle Bottom: 471-day SMA × 0.745 vs 150-day EMA |
| Checked | October 2026 |
Worked example: the April 2021 signal and what came after
Through the first months of 2021 bitcoin went almost vertical, and the 111-day average climbed toward double the 350-day. On April 12, 2021 the lines crossed. Two days later bitcoin printed a high near $64,900, and within about ten weeks it had fallen roughly 53%, to the low $30,000s. A trader who sold at the cross caught the top of that leg almost exactly.
Then the market did what the indicator could not see. Bitcoin rebuilt through the summer and made a new all-time high near $69,000 in November 2021, with the 111-day average nowhere near the doubled 350-day — the advance was broader and slower, so no second signal came. A trader who used the April cross as "the top of the cycle" and stayed out missed the second leg; a trader who used it as "the advance is dangerously fast, take risk off" was right twice. The second reading is the one that survived 2025 as well, when the same slower, broader shape produced a top with no signal at all.
What mistakes do traders make with the Pi Cycle Top?
- Treating the absence of a cross as proof that the top is far away. In 2025 the top came with no cross.
- Shorting the cross. The signal historically marked tops, not the timing of the decline that followed.
- Using it on altcoins or other markets. The lengths were fitted to bitcoin's past cycles.
- Reading the lines on a linear chart, where the gap is impossible to judge. Use the ratio.
- Using exponential averages by mistake. The signal is defined on simple moving averages.
- Ignoring the 2021 double top. The signal marked the first peak, not the final high.
- Relying on one gauge. Combine it with valuation, leverage and sentiment measures.
How do cycle gauges fit with structure and the free indicators?
Cycle gauges answer "how stretched is this market"; structure answers "has it turned". The free library covers the second question on TradingView: the Market Bottom Finder marks capitulation lows that cycle tops eventually lead to, the Liquidation Magnet shows where leveraged positions cluster in a stretched market, and the Smart Money Concepts Engine prints the weekly break of structure that confirms a top. Zeno, the premium engine, prints buy and sell signals with a stop and targets on the daily and intraday charts, so a stretched Pi Cycle reading becomes a reason to take Zeno's sell signals more seriously rather than a trade on its own. The best crypto indicator guide covers the rest of the crypto toolkit.
The Pi Cycle Top measures acceleration: the four-month average reaching double the one-year average. It caught three parabolic tops and missed the slower 2025 one. Read it as a ratio, treat readings near 1.0 as a reason to take risk off, never treat the absence of a cross as safety, and combine it with valuation, leverage and structure.
◆ Interactive check
Do you know what the Pi Cycle measures?
Questions traders ask about the Pi Cycle Top
A bitcoin cycle indicator that flags a likely top when the 111-day simple moving average crosses above twice the 350-day simple moving average. It was created by Philip Swift and published in April 2019.
It crossed within days of the 2013, 2017 and April 2021 peaks, but the November 2021 high came without a second signal and the October 2025 cycle top came with no cross at all. That makes it a useful stretch gauge with a broken timing record.
No. Bitcoin topped in October 2025 near $126,000 while the 111-day average stayed well below twice the 350-day average. It was the first cycle in which the indicator did not fire.
Because 350 divided by 111 is about 3.153, close to the value of π. The lengths were chosen to fit past tops; the link to pi is a coincidence.
Add two simple moving averages to a daily BTCUSD chart, one of length 111 and one of length 350, and multiply the second by 2 — or use one of the community Pi Cycle scripts that plot the doubled line and mark the cross.
A mirror version that compares a 471-day simple moving average multiplied by 0.745 with a 150-day exponential moving average and signals when they meet. It has a shorter, looser record than the top version and should be used the same way: as context.
A cross has historically marked an advance that is too fast to last, so reducing risk into it has been sensible. Selling everything on the signal would have missed the second leg of 2021, and waiting for a signal would have missed the 2025 top.
Not reliably. The 111 and 350-day lengths were fitted to bitcoin's cycles; altcoins have shorter histories and different cycle shapes.
Bitcoin's cycles have become less parabolic, with lower volatility and steadier demand from ETFs and treasuries. A slower advance never lifts the four-month average to double the one-year average, so the condition is not met.
Cycle gauges set the risk level; structure sets the trade. The free indicators mark capitulation lows, liquidation clusters and weekly breaks of structure on TradingView, and Zeno prints the buy and sell signals with a stop and targets.
References & Related Guides
Read next
- Bitcoin Power Law
- Crypto Fear and Greed Index
- Bitcoin Dominance Explained
- Altcoin Season Explained
- Total Crypto Market Cap
- Funding Rate Trading
- Best Crypto Indicator
- Moving Averages Guide
- Golden Cross and Death Cross
- Halving cycle in SMC context
- Market Bottom Finder (free indicator)
- Zeno — the premium engine