Gold & the Dollar (DXY): The Complete Correlation Guide
Gold and the US Dollar Index (DXY) are strongly inversely correlated, with a coefficient of roughly −0.5 to −0.8 and near −0.85 over the long run, because gold is priced in dollars: a stronger dollar makes gold dearer for foreign buyers. The relationship is a strong tendency, not a rule; it breaks during risk-off events.
Do Gold and the Dollar (DXY) Really Move Inversely?
Yes — most of the time. Gold (XAUUSD) and the US Dollar Index (DXY) share one of the most reliable inverse relationships in all of macro: when the dollar strengthens, gold tends to fall, and when the dollar weakens, gold tends to rise. Studies from the World Gold Council and others put the historical correlation coefficient typically between −0.5 and −0.8 depending on the period measured, with the St. Louis Fed citing figures near −0.85 over the long run. A coefficient of −1.0 would mean perfect opposition; 0 would mean no relationship. So the link is strong — but, crucially, not a physical law.
Understanding both halves of that sentence — that the inverse relationship is strong and that it breaks down — is what separates traders who use the DXY as a genuine edge from those who get burned assuming it always holds. This guide covers why the relationship exists, exactly when it breaks, and how to actually trade gold using the dollar as context.
Why does a stronger dollar push gold lower?
The core reason is mechanical: gold is priced globally in US dollars (as XAU/USD, dollars per troy ounce). When the dollar strengthens, it takes fewer dollars to buy an ounce of gold, so the dollar price of gold falls. It also becomes more expensive for buyers holding other currencies — a stronger dollar means a foreign buyer needs more of their local currency to acquire the dollars to buy gold — which dampens global demand and pushes the price down further. A weaker dollar does the reverse: gold gets cheaper for foreign buyers, demand rises, and XAUUSD climbs.
There are two deeper drivers layered on top of this pricing mechanic. First, safe-haven competition: both gold and the dollar are considered safe assets, so in normal conditions money rotating into one tends to rotate out of the other. Second, real interest rates: gold pays no yield, so when real rates (nominal rates minus inflation) are high, holding dollars or bonds is more attractive than gold — and high real rates usually coincide with a strong dollar. When real rates are low or negative, gold shines and the dollar often softens. These forces normally reinforce the inverse link, which is why it shows up so consistently on the charts.
What does the DXY actually measure?
A subtlety trips up many traders: the DXY is not "the dollar" in absolute terms — it is a ratio. The US Dollar Index measures the dollar against a basket of six major currencies (euro, yen, pound, Canadian dollar, Swedish krona, Swiss franc), heavily weighted toward the euro. That means the DXY can rise even while the dollar is losing purchasing power, as long as the basket currencies are weakening faster.
This is exactly why you sometimes see gold and the DXY both rising for extended periods, which looks like the inverse relationship has failed. It hasn't, necessarily — the DXY may simply be reflecting relative weakness in the euro and yen rather than genuine dollar strength, while gold rises on its own drivers (central-bank buying, real-rate expectations, geopolitical demand). Treating the DXY as a perfect proxy for the dollar's intrinsic value, rather than a relative measure against a currency basket, is one of the most common analytical errors in gold trading.
What does the gold-DXY correlation look like on a chart?
The cleanest way to internalise the relationship is to overlay the two and watch them mirror each other. In the chart below, gold and the DXY are plotted together over the same window: as the dollar index pushes up, gold presses down, and vice versa — the classic seesaw. Notice how the turning points line up: a DXY top often coincides with a gold bottom, and a DXY breakdown with a gold breakout.
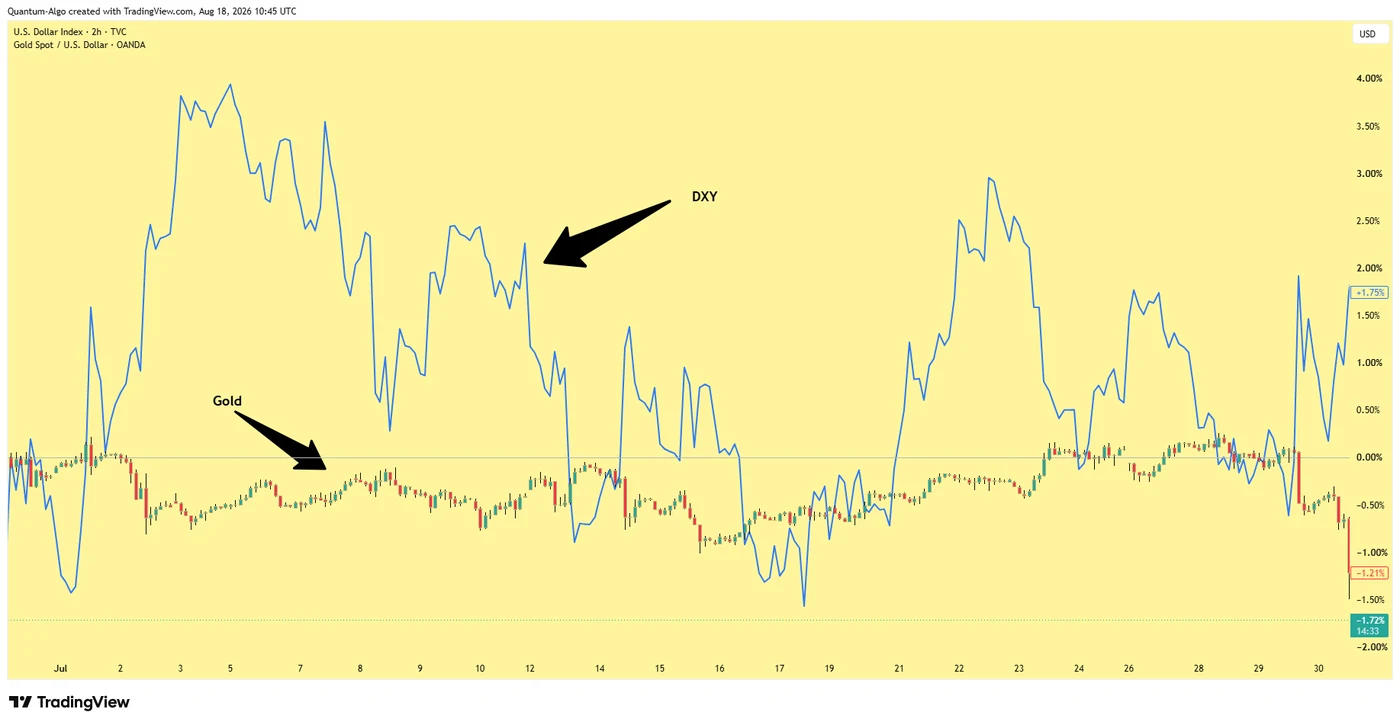
This visual is the whole thesis in one image, but it also hints at the nuance: the mirror is not perfect frame-for-frame. There are stretches where the two drift, lead, or lag each other. That imperfection is not a reason to distrust the relationship — it is the reason to measure it rather than assume it, which we cover next.
When the Inverse Relationship Breaks Down
The single most important thing to know is that the gold–DXY correlation is a strong tendency, not a constant. It weakens, strengthens, and occasionally inverts. The classic breakdown happens during acute risk-off events — a financial crisis, a war, a systemic shock. In those moments investors flood into both the dollar (for its liquidity as the world's reserve currency) and gold (as the ultimate safe haven) at the same time. Both strengthen together, and the usual inverse relationship temporarily disappears.
Other breakdown drivers include aggressive central-bank gold buying (which lifts gold regardless of the dollar), divergent monetary policy that moves the DXY on foreign-currency weakness rather than dollar strength, and periods where real-rate expectations dominate both assets in the same direction. This is why professionals never enter a gold trade solely because of what the DXY is doing. The dollar is one input — often a powerful confirming one — but not the entire thesis. The biggest error a trader can make here is treating the inverse relationship as a rule to be obeyed rather than a tendency to be weighed.
When the gold-DXY link holds and when it breaks
| Condition | DXY | Gold | Gold-DXY relationship |
|---|---|---|---|
| Dollar strengthens in normal conditions | Rises | Tends to fall | Inverse holds |
| Real interest rates rise | Usually firm | Headwind, tends to fall | Inverse holds |
| Real interest rates fall | Often softer | Tailwind, tends to rise | Inverse holds |
| Acute risk-off shock | Rises on demand for liquidity | Rises as a safe haven | Breaks: both rise together |
| Aggressive central-bank gold buying | Any direction | Lifted regardless of the dollar | Loosens |
| DXY up on euro or yen weakness | Rises as a basket ratio | Can rise on its own drivers | Looks broken, often is not |
◆A rolling correlation coefficient shows how much weight the DXY deserves at any moment.
Should the DXY trigger a gold trade or confirm it?
Used correctly, the DXY becomes a high-value confirming and context tool for gold trades. Practical approaches:
1. Confirmation, not trigger. Take your gold setup from your own process — structure, a level, a signal — then check the DXY. A gold long is stronger when the DXY is also rolling over; a gold short is stronger when the DXY is breaking up. If the DXY flatly contradicts your gold setup, that's a reason for caution.
2. Divergence spotting. When gold and the DXY stop mirroring each other — for example, the DXY makes a new high but gold refuses to make a new low — that divergence often signals the current move is exhausting. A DXY that can't push gold lower is showing hidden gold strength.
3. Session timing. The inverse relationship is typically most reliable during the high-liquidity London–New York overlap, when both instruments see real participation. Correlations measured in thin sessions are less trustworthy.
4. Measure, don't assume. Use a correlation-coefficient indicator (available on TradingView and MT5) comparing XAUUSD and DXY over a rolling window (e.g., 20–60 bars) to see how strong the relationship is right now. When the rolling correlation is deeply negative, DXY signals carry more weight; when it drifts toward zero, the relationship is temporarily unreliable and you should lean less on it.

Automate your trades. Let Quantum Algo trade for you.
Every signal executed on your own account — 24/7, hands-off.
How does a DXY divergence confirm a gold reversal?
Imagine gold has been selling off for a week alongside a rising DXY — the textbook inverse move. Then something shifts: the DXY pushes to a fresh high, but gold fails to make a corresponding new low, instead holding above its prior swing low. This is a bearish-DXY / bullish-gold divergence, and it is one of the most useful signals the relationship produces.
The logic is straightforward. If the dollar is stronger than before but can no longer force gold lower, some other force is supporting gold — central-bank demand, safe-haven flows, or real-rate expectations turning. The seesaw is losing its grip. A trader watching this would tighten shorts, and on a subsequent market structure shift to the upside in gold — ideally with the DXY now also turning down — would look for a long. Risk sits below the gold swing low that held despite the DXY's new high.
Notice what the DXY did and did not do here. It did not trigger the trade — a structure shift did. It confirmed the thesis by revealing exhaustion in the down-move before price alone made it obvious. That is the correct role of the dollar in gold trading: an early, independent tell that raises or lowers your confidence in a setup you found through your own process.
Beyond the DXY: Other Forces That Move Gold
The dollar is the biggest single driver of gold, but it is not the only one, and a complete trader weighs the others so they know when to expect the correlation to bend. Real interest rates are arguably as important: because gold yields nothing, rising real rates are a headwind and falling real rates a tailwind, sometimes overriding the dollar entirely. Central-bank buying has become a structural source of demand that can lift gold independent of the DXY for months. Geopolitical risk and inflation expectations drive safe-haven and store-of-value demand, and ETF and physical flows add or remove marginal demand.
Why does this matter for using the DXY? Because when one of these forces is dominant, the gold–DXY correlation temporarily loosens, and you should expect it. A gold rally powered by aggressive central-bank buying can shrug off a firm dollar for a long time. Knowing the other drivers is what lets you interpret a broken correlation correctly — as a different force taking the wheel — rather than concluding the relationship has stopped working. For a deeper read on gold specifically, our complete gold trading guide and best indicators for gold cover the instrument end to end.
Trading Gold and the Dollar with Quantum Algo
The gold–DXY relationship gives you macro context — but you still need precise levels and structure to turn that context into trades. Quantum Algo's Smart Money Concepts tools map the liquidity, order blocks, and market structure on gold (XAUUSD), so when the DXY confirms your directional bias, you can enter at levels that actually matter rather than guessing. The approach is simple and robust: let the dollar tell you whether conditions favour longs or shorts in gold, and let structure tell you where to act — all backed by a verified public track record.
For traders focused on gold, this is the ideal pairing: macro from the DXY, precision from the tools. Combine it with a dedicated read of the right indicators for gold and sound risk management, and the dollar stops being a vague headline and becomes a concrete, tradeable edge.
See the indicator → Verify the track recordFrequently Asked Questions
Yes, gold (XAUUSD) and the US Dollar Index (DXY) have a strong inverse correlation, historically around −0.5 to −0.8 (some measures cite near −0.85 long-term). When the dollar strengthens, gold tends to fall; when the dollar weakens, gold tends to rise. The main reason is that gold is priced in US dollars. However, it is a strong tendency rather than a rule, and it can break down during risk-off events.
Primarily because gold is priced globally in US dollars. When the dollar strengthens, it takes fewer dollars to buy an ounce of gold and gold becomes more expensive for foreign buyers, reducing demand and lowering the price. A weaker dollar makes gold cheaper for foreign buyers, increasing demand. Safe-haven competition and real interest rates reinforce this inverse relationship.
Yes, though it's less common. It typically happens during acute risk-off events — financial crises, wars, systemic shocks — when investors buy both the dollar (for liquidity) and gold (as a safe haven) simultaneously. It can also occur because the DXY is a ratio against a currency basket, so it can rise on foreign-currency weakness while gold rises on its own drivers like central-bank buying.
Research typically places it between −0.5 and −0.8 depending on the period, with some long-run measures near −0.85. A coefficient of −1.0 would mean perfect inverse movement and 0 would mean no relationship. The −0.5 to −0.8 range indicates a strong but not absolute inverse link that can weaken or temporarily break, especially during extreme events.
The DXY (US Dollar Index) measures the value of the US dollar against a basket of six major currencies — the euro, yen, pound, Canadian dollar, Swedish krona, and Swiss franc — heavily weighted toward the euro. It reflects the dollar's relative strength, not its absolute purchasing power. Because it's a ratio against a basket, the DXY can rise even when the dollar is weakening if the basket currencies weaken faster.
Mainly during acute risk-off events, when investors buy both gold and the dollar as safe havens simultaneously. It also loosens during aggressive central-bank gold buying, when divergent monetary policy moves the DXY on foreign-currency weakness, or when real-rate expectations drive both assets the same way. This is why you should never trade gold on the DXY alone.
Use it as a confirming factor, not a trigger. Take your gold setup from your own process, then check the DXY: a gold long is stronger when the DXY is rolling over, a short stronger when the DXY is breaking up. Watch for divergences (DXY makes a new high but gold won't make a new low) as reversal warnings, and measure the rolling correlation to know how much weight the DXY deserves right now.
It's one of the more reliable relationships in macro, but it's a strong tendency, not a guarantee. It's most reliable in liquid sessions (the London–New York overlap) and when the rolling correlation is deeply negative. It becomes unreliable during risk-off shocks and when other forces — central-bank buying, real rates — dominate. Measure it rather than assuming it always holds.
Real interest rates (gold yields nothing, so rising real rates are a headwind), central-bank buying, geopolitical risk, inflation expectations, and ETF/physical demand flows. When one of these forces dominates, the gold–DXY correlation can temporarily loosen — a gold rally driven by central-bank demand can shrug off a firm dollar for months. Knowing these drivers helps you interpret a broken correlation correctly.
A divergence occurs when gold and the DXY stop mirroring each other — for example, the DXY makes a new high but gold fails to make a new low, or the DXY breaks down but gold won't rally. Divergences often signal the current move is exhausting: if a stronger dollar can no longer push gold lower, some other force is supporting gold, which can precede a reversal.
It can, and it's typically most reliable during the high-liquidity London–New York session overlap when both instruments see real participation. In thin sessions the relationship is noisier and less trustworthy. Intraday traders often use a correlation-coefficient indicator over a short rolling window to gauge whether the inverse link is currently strong enough to lean on.
The DXY provides macro context, but you still need precise levels. Quantum Algo's Smart Money Concepts tools map liquidity, order blocks, and market structure on XAUUSD, so when the DXY confirms your directional bias you can enter at meaningful levels rather than guessing. The dollar tells you whether conditions favour longs or shorts; structure tells you where to act — backed by a verified public track record.
References & Related Guides
More in this topic
- ADX Indicator: Complete Trading Guide
- AlphaTrend Indicator: Complete Trading Guide
- ATR (Average True Range): Complete Trading Guide
- Awesome Oscillator: Complete Indicator Guide
- What Are the Best Volume Indicators?
- Bollinger Bands — Complete Trading Indicator Guide
- CCI Indicator: Complete Guide
- Chandelier Exit: Complete Trading Guide
- Donchian Channels: Complete Indicator Guide
- Fibonacci Bollinger Bands: Complete Trading Guide
- Fibonacci Retracement — Complete Trading Guide
- Hull Moving Average (HMA): Complete Trading Guide
- Gaussian Channel Indicator Guide
- Best Buy/Sell Indicator Guide
Core reading
- BOS & CHoCH: Complete Market Structure Guide
- Order Blocks Trading: Complete Guide
- Best TradingView Indicators — Complete Guide
- Risk Management in Trading — Complete Guide
- Candlestick Patterns Guide — Engulfing, Pinbar & More
- All Premium Guides
- Quantum Algo on TradingView
- Public Track Record