Liquidity Void
A liquidity void is a price region that was traversed so fast that almost no volume traded there — a large gap on the chart and the profile — which price tends to refill quickly and completely when it returns.
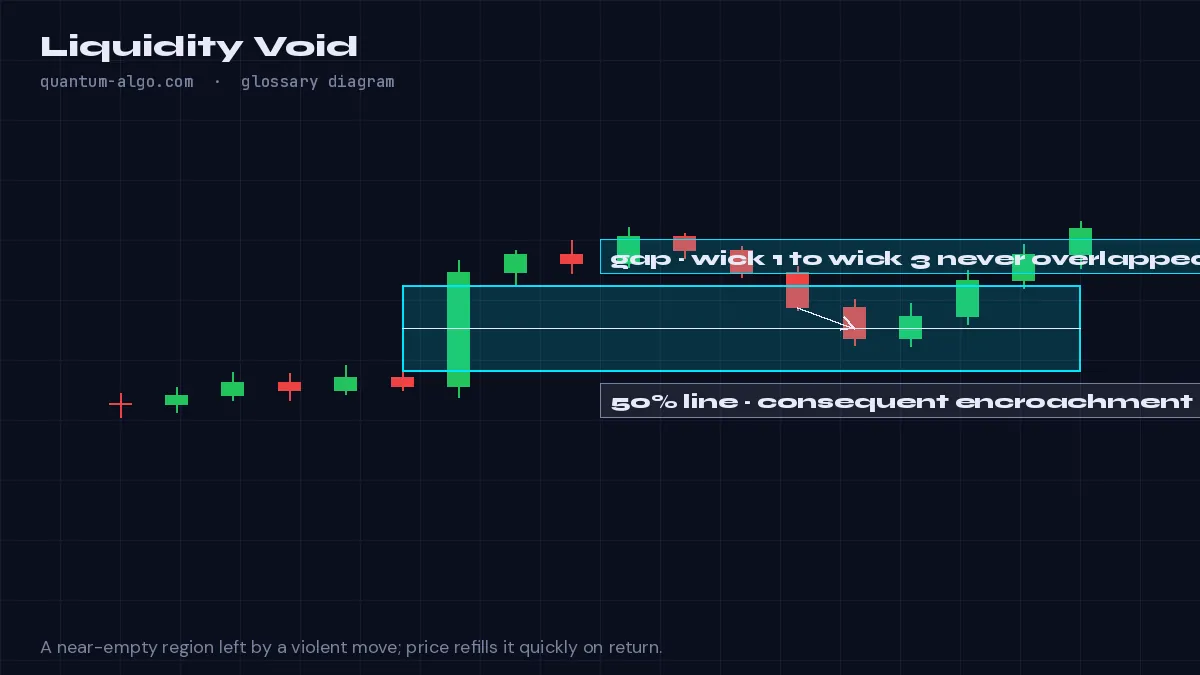
What it means
A liquidity void is a fair value gap on a larger scale: a stretch of price with little or no traded volume, created by a violent move — a news candle, a liquidation cascade, a low-liquidity breakout. On a volume profile it shows as a thin, single-print area; on the candle chart as one or several candles whose bodies cover ground nothing else traded.
Voids attract price because there are no resting orders inside them to slow a move. When price re-enters a void it tends to travel through it rapidly to the far side, where volume — and therefore decisions — resumes. That makes voids both targets (the far edge) and warnings (do not expect support inside one).
The distinction from a fair value gap is scale and volume: an FVG is a three-candle imbalance that may hold as support; a void is a larger, near-empty region that typically fills fully. The Institutional Volume Profile shows voids as low-volume nodes.
How to identify it on a chart
- Find a fast move with several consecutive large-bodied candles.
- On the volume profile, the same region shows as a thin, low-volume band.
- Expect price to move quickly through it on return; use the far edge as a target.
Worked example
A liquidation cascade drops SOL from 148 to 131 in twelve minutes. The profile shows almost no volume between 134 and 145. Two days later price re-enters at 134 and runs to 145 in one hour — the void refilled.
See it on the chart, read it in depth
Frequently asked questions
Is a liquidity void the same as a fair value gap?
Related but not the same: an FVG is a three-candle imbalance that may act as support; a void is a larger low-volume region that usually fills completely.
Do voids always fill?
Most do, because nothing inside stops price; but a strong trend can leave a void unfilled for weeks. Treat the far edge as a target, not a certainty.
How do I see voids on a chart?
A volume profile makes them obvious as thin bands; on candles, look for stacked large bodies with no overlapping wicks.
Can I trade inside a void?
Expect no support or resistance inside; enter at its edges and target the opposite edge.
Related terms
See Liquidity Void on your TradingView chart
Zeno reads Smart Money structure across timeframes and prints the entry, stop and targets — with a public record of every posted trade. The free indicators draw the concepts this page defines.